. 2020 Oct;17(171):20200588.
doi: 10.1098/rsif.2020.0588. Epub 2020 Oct 21.

A bioenergetic model to predict habitability, biomass and biosignatures in astrobiology and extreme conditions

Affiliations

A bioenergetic model to predict habitability, biomass and biosignatures in astrobiology and extreme conditions

P M Higgins et al. J R Soc Interface. 2020 Oct.

Abstract

In order to grow, reproduce and evolve life requires a supply of energy and nutrients. Astrobiology has the challenge of studying life on Earth in environments which are poorly characterized or extreme, usually both, and predicting the habitability of extraterrestrial environments. We have developed a general astrobiological model for assessing the energetic and nutrient availability of poorly characterized environments to predict their potential biological productivity. NutMEG (nutrients, maintenance, energy and growth) can be used to estimate how much biomass an environment could host, and how that life might affect the local chemistry. It requires only an overall catabolic reaction and some knowledge of the local environment to begin making estimations, with many more customizable parameters, such as microbial adaptation. In this study, the model was configured to replicate laboratory data on the growth of methanogens. It was used to predict the effect of temperature and energy/nutrient limitation on their microbial growth rates, total biomass levels, and total biosignature production in laboratory-like conditions to explore how it could be applied to astrobiological problems. As temperature rises from 280 to 330 K, NutMEG predicts exponential drops in final biomass ([Formula: see text]) and total methane production ([Formula: see text]) despite an increase in peak growth rates ([Formula: see text]) for a typical methanogen in ideal conditions. This is caused by the increasing cost of microbial maintenance diverting energy away from growth processes. Restricting energy and nutrients exacerbates this trend. With minimal assumptions NutMEG can reliably replicate microbial growth behaviour, but better understanding of the synthesis and maintenance costs life must overcome in different extremes is required to improve its results further. NutMEG can help us assess the theoretical habitability of extraterrestrial environments and predict potential biomass and biosignature production, for example on exoplanets using minimum input parameters to guide observations.

Keywords: energy limitation; habitability; methanogens; microbial maintenance; modelling; nutrient limitation.


Conflict of interest statement

We declare we have no competing interest.

Figures
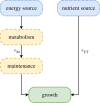
Figure 1.
Figure 1.
Flowchart to demonstrate the concept of the model. ϵM and ϵUT are the energetic efficiencies of maintenance and nutrient uptake, respectively.
Figure 2.
Figure 2.
Predicted maintenance power required for the empirical methanogens and typical optimal methanogen (TOM). This shows the required maintenance cost [Wcell1] for the TOM (orange line) and empirical methanogens (blue crosses) to grow optimally at various temperatures. For both, error bounds indicate possible variations in power supply due to variation in ATP yield per CO2 metabolized; between 0.5 and 1.5 [44,45]. Initial [CH4] was unknown in the data, so a value which yielded a maintenance cost equivalent to Tijhuis et al. [43] at 300 K for the TOM was used.
Figure 3.
Figure 3.
Growth curves of simulated typical optimal methanogens (TOM) under energy or nutrient limitation. The TOM, methanogens which exhibit maximum growth rates across given temperatures, are shown growing in their optimal conditions in each subplot and growing in energy or nutrient limited conditions at various temperatures. Columns from left to right show the effect of [CO2], [H2], [P] and kP, the latter the rate constant of phosphorus uptake. Each row shows the same changes at different temperatures. The optimal dissolved [CO2] and [H2] vary with temperature (electronic supplementary material, figure S3) so changes are shown with a % change on the optimal concentration at that temperature. The filled-in segments show variation in growth curves at various yields of ATP per mol CO2—between 0.5 and 1.5. Where the dark blue curve appears absent it is obstructed by the light blue curve; for these cases εUT = 1 and energy is the main limiting factor, as increasing nutrient availability does not increase growth rates.
Figure 4.
Figure 4.
Peak growth rates, final biomass values and total CH4 production of the simulated typical optimal methanogens (TOM), growing under energy or nutrient limitation. The TOM, methanogens which exhibit maximum growth rates across given temperatures, growing in their optimal conditions are shown by the dark blue line in each subplot and growing in energy or nutrient limited conditions at various temperatures. For the TOM in energy and nutrient saturated conditions, as temperature rises from 280 to 330 K NutMEG predicts exponential drops in final biomass (109106cellsl1) and total methane production (623μM) despite an increase in peak growth rates (0.0070.14h1). Equivalent doubling times are approximately 100–5 h. Columns from left to right show the effect of [CO2], [H2], [P] and kP, the latter the rate constant of phosphorus uptake. The optimal dissolved CO2 and H2 vary with temperature (electronic supplementary material, figure S3) so changes are shown with a % change on the optimal concentration at that temperature. The filled-in segments show variation in growth curves at various yields of ATP per mol CO2—between 0.5 and 1.5. Where the dark blue curve appears absent it is obstructed by the light blue curve; for these cases εUT = 1 and energy is the main limiting factor, as increasing nutrient availability does not increase growth rates.
Figure 5.
Figure 5.
Factor by which the synthesis energy of the typical optimal methanogen needs to be increased for the optimal maintenance power to be zero. The correction to the Esyn needed for the maintenance to be zero while still returning empirical growth rates. More realistic Esyn values could be between the values used for this study and the values on this contour.

References

    1. Cockell CS. 2011. Life in the lithosphere, kinetics and the prospects for life elsewhere. Phil. Trans. R. Soc. A 369, 516–537. (10.1098/rsta.2010.0232) - DOI - PubMed
    1. Harrison JP, Gheeraert N, Tsigelnitskiy D, Cockell CS. 2013. The limits for life under multiple extremes. Trends Microbiol. 21, 204–212. (10.1016/j.tim.2013.01.006) - DOI - PubMed
    1. Ehlmann BL, Edwards CS. 2014. Mineralogy of the martian surface. Annu. Rev. Earth Planet. Sci. 42, 291–315. (10.1146/annurev-earth-060313-055024) - DOI
    1. Jakosky BM, Shock EL. 1998. The biological potential of Mars, the early Earth, and Europa. J. Geophys. Res.: Planets 103, 19 359–19 364. (10.1029/98JE01892) - DOI - PubMed
    1. Fisk MR, Giovannoni SJ. 1999. Sources of nutrients and energy for a deep biosphere on Mars. J. Geophys. Res.: Planets 104, 11 805–11 815. (10.1029/1999JE900010) - DOI

Publication types

LinkOut - more resources