. 2020 Oct;17(171):20200608.
doi: 10.1098/rsif.2020.0608. Epub 2020 Oct 21.

Neutral components show a hierarchical community structure in the genotype-phenotype map of RNA secondary structure

Affiliations

Neutral components show a hierarchical community structure in the genotype-phenotype map of RNA secondary structure

Marcel Weiß et al. J R Soc Interface. 2020 Oct.

Abstract

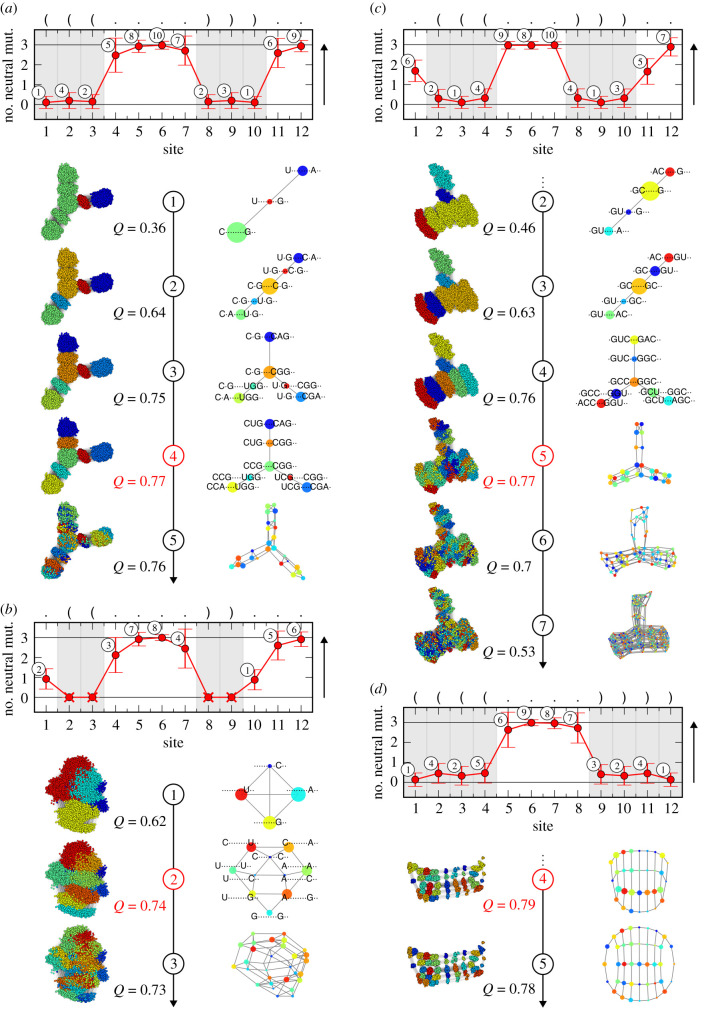
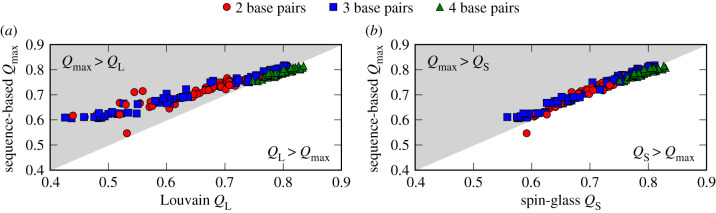
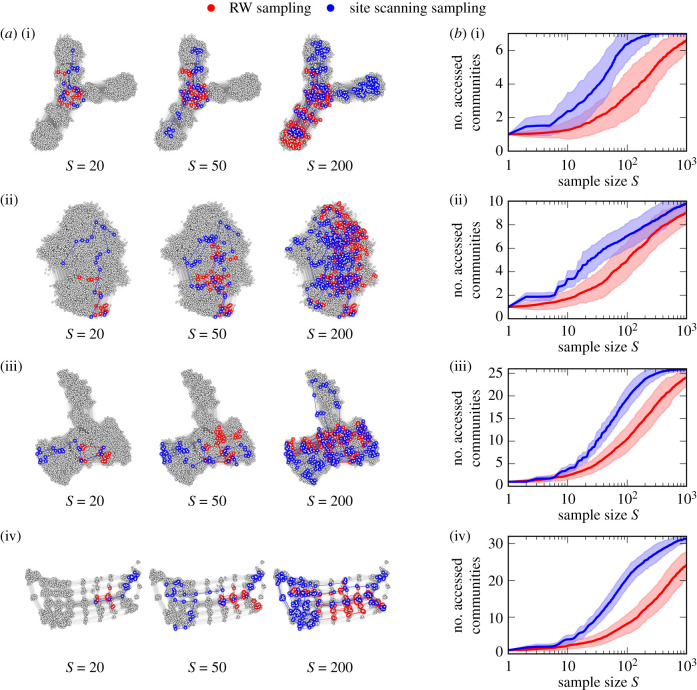
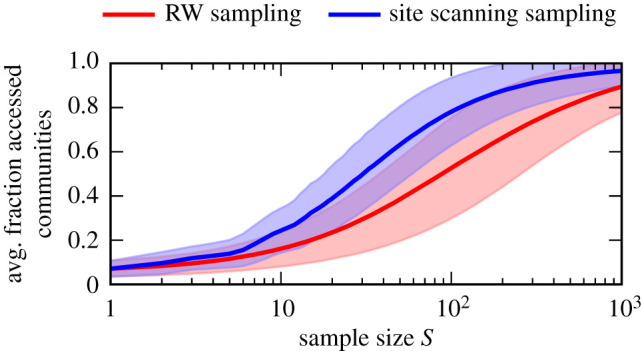
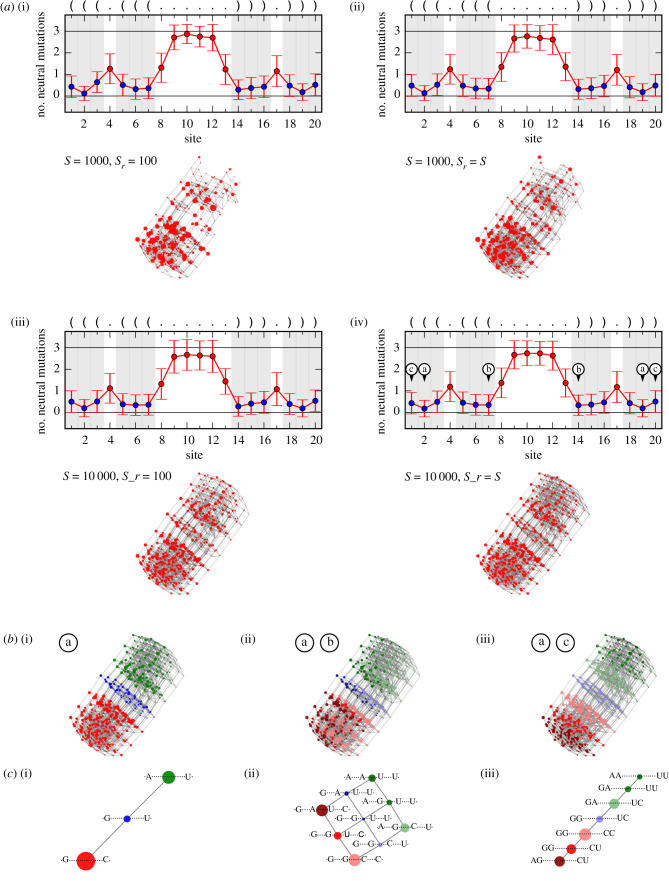
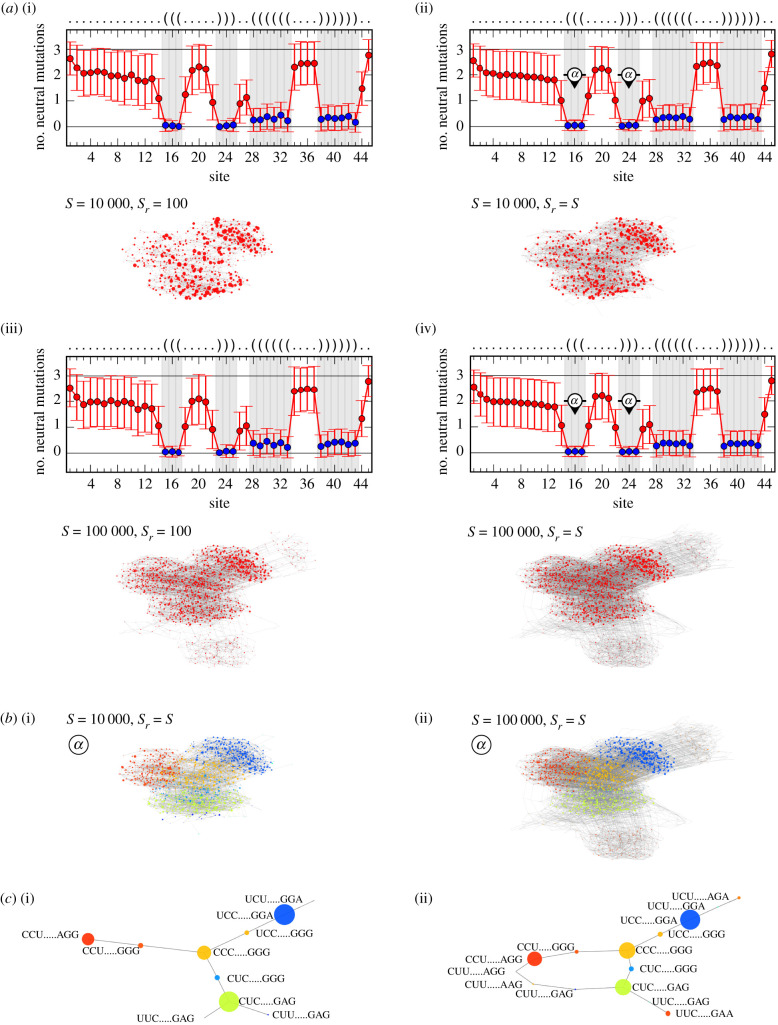
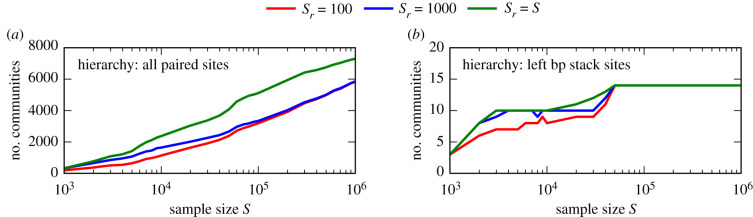
Genotype-phenotype (GP) maps describe the relationship between biological sequences and structural or functional outcomes. They can be represented as networks in which genotypes are the nodes, and one-point mutations between them are the edges. The genotypes that map to the same phenotype form subnetworks consisting of one or multiple disjoint connected components-so-called neutral components (NCs). For the GP map of RNA secondary structure, the NCs have been found to exhibit distinctive network features that can affect the dynamical processes taking place on them. Here, we focus on the community structure of RNA secondary structure NCs. Building on previous findings, we introduce a method to reveal the hierarchical community structure solely from the sequence constraints and composition of the genotypes that form a given NC. Thereby, we obtain modularity values similar to common community detection algorithms, which are much more complex. From this knowledge, we endorse a sampling method that allows a fast exploration of the different communities of a given NC. Furthermore, we introduce a way to estimate the community structure from genotype samples, which is useful when an exhaustive analysis of the NC is not feasible, as is the case for longer sequence lengths.

Keywords: RNA secondary structure; community structure; genotype–phenotype map; network.


Conflict of interest statement

We declare we have no competing interests.

Figures

Figure 1.
Figure 1.
Depiction of the sequence-based communities method applied to four example NCs of the L = 12 RNA secondary structure GP map: (a) NC of rank 32 (size: 19 488, secondary structure: ‘(((… .))). .’, (b) 36 (size: 18 468, ‘.((… .))…’, (c) 41 (size: 16 815, ‘.(((…))). .’, and (d) 94 (size: 7341, ‘((((… .))))’). In each of the four cases, at the top, the average number of neutral mutations per site averaged over all genotypes of the NC is displayed. The crosses indicate fully constrained sites (zero average number of neutral mutations). The shaded grey areas highlight paired sites. The numbers indicate the ordering of the sites according to their constraint (average number of neutral mutations), with the site having the smallest non-zero average number of neutral mutations receiving number 1 and so on. If sites have exactly the same constraint, they receive the same number. In each case, underneath the top figure, for a range of steps, the full NC network with coloured communities, its modularity Q and its coarse-grained network representation are shown, respectively, according to associating the communities with letter combinations at the positions of the sites with a number up to and including the respective step number. Both the full and coarse-grained networks are plotted using a force-directed graph layout algorithm. In addition, if the coarse-grained networks are not too large, the associated letter combinations are shown. The red step numbers and modularity values indicate the respective step that leads to the community structure with maximum modularity. The examples demonstrate that the community structure of an NC can be revealed by considering the sites in order of their decreasing constraint levels. Larger decreases in the constraint are associated with a change in the hierarchy layer.
Figure 2.
Figure 2.
Maximum modularity values Qmax by our sequence-based communities method versus the modularity values Q by two common community detection algorithms: (a) Louvain (QL) and (b) spin-glass (QS) algorithm, for the 200 largest NCs of the L = 12 RNA secondary structure GP map. The coloured dots indicate the number of base pairs in the phenotypes corresponding to the NCs. Our method reveals community structures of modularity similar to or larger than the Louvain algorithm, and of modularity similar to the spin-glass algorithm.
Figure 3.
Figure 3.
(a) Examples of genotype samples of size S = 20, S = 50 and S = 200 generated by random walk (RW) sampling and site scanning sampling, respectively, for the four example NCs of the L = 12 RNA secondary structure GP map (also shown in figure 1): (i) NC of rank 32, (ii) 36, (iii) 41 and (iv) 94. (b) Average number of accessed communities as a function of the sample size S for both sampling methods, averaged over 100 repetitions of the sampling, respectively. The shaded bands indicate the standard deviation. As the basis for the number of communities, respectively, we use the community structure with maximum modularity obtained by our sequence-based communities method. In all cases, site scanning sampling leads to a faster exploration of the NC communities.
Figure 4.
Figure 4.
Average fraction of accessed communities as a function of the sample size S for random walk (RW) and site scanning sampling, averaged over the 200 largest NCs of the L = 12 RNA secondary structure GP map and 100 repetitions, respectively. The shaded bands indicate the standard deviation for the averaging over the 200 largest NCs. As the basis for the number of communities, respectively, we use the community structure with maximum modularity obtained by our sequence-based communities method. The results support the findings in figure 3b: site scanning sampling outperforms RW sampling in terms of a fast exploration of the NC communities.
Figure 5.
Figure 5.
(a) Community structure estimation results for the NC comprising the fRNAdb sequence with entry ID FR422569 and length L = 20. For four sample and random subsample size combinations: (i) S = 1000, Sr = 100, (ii) S = 1000, Sr = S, (iii) S = 10 000, Sr = 100 and (iv) S = 10 000, Sr = S, the average number of neutral mutations per site averaged over the random subsample and the estimated coarse-grained network are shown. For the average number of neutral mutations per site, the shaded grey areas as well as the blue markers highlight the paired sites, i.e. the positions for which the realized letter combinations are associated with communities. For the coarse-grained network in (a(iv)), a force-directed graph layout is used, the networks in (a(i)), (a(ii)) and (a(iii)) are drawn with respect to this layout. (b) Coarse-grained network from (a(iv)) with coloured communities and (c) further coarse-grained networks according to the letter combinations at positions (i) ‘a’, (ii) ‘a’ and ‘b’, and (iii) ‘a’ and ‘c’ marked in (a(iv)), respectively. For the further coarse-grained networks, additionally, the associated letter combinations are shown. The results highlight that the coarse-grained network itself displays a community structure of which the most significant division is caused by the pair of most constrained paired sites (sites at positions ‘a’).
Figure 6.
Figure 6.
(a) Community structure estimation results for the NC comprising the fRNAdb sequence with entry ID FR039335 and length L = 45. For four sample and random subsample size combinations: (i) S = 10 000, Sr = 100, (ii) S = 10 000, Sr = S, (iii) S = 100 000, Sr = 100 and (iv) S = 100 000, Sr = S, the average number of neutral mutations per site averaged over the random subsample and the estimated coarse-grained network are shown. For the average number of neutral mutations per site, the shaded grey areas as well as the blue markers highlight the paired sites, meaning the positions for which the realized letter combinations are associated with communities. For the coarse-grained network in (a(iv)), a force-directed graph layout is used, the networks in (a(i)), (a(ii)) and (a(iii)) are drawn with respect to this layout. (b) Coarse-grained networks ((i) for S = 10 000, Sr = S from (a(ii)) and (ii) for S = 100 000, Sr = S from (a(iv))) with coloured communities and (c) further coarse-grained networks according to the letter combinations at the positions marked by ‘α’ in (a(ii)) and (a(iv)). For the further coarse-grained networks, additionally, the associated letter combinations are shown. The results highlight that the most significant division of the coarse-grained network is caused by the more constrained paired sites in the left base pair stack of the secondary structure.
Figure 7.
Figure 7.
Number of found coarse-grained communities of the NC comprising the fRNAdb sequence with entry ID FR039335 and length L = 45 (also considered in figure 6) as a function of the sample size S for three random subsample sizes of Sr = 100, Sr = 1000 and Sr = S, respectively. (a) Hierarchy layer for considering all paired sites of the respective secondary structure and (b) hierarchy layer for only considering the more constrained left base pair (bp) stack sites. While there is no saturation for the former hierarchy layer, the number of found communities saturates for the latter hierarchy layer.

Similar articles

Cited by

References

    1. Wright S. 1932. The roles of mutation, inbreeding, crossbreeding, and selection in evolution. Proc. Sixth Int. Congr. Genet. 1, 355–366.
    1. Maynard Smith J. 1970. Natural selection and the concept of a protein space. Nature 225, 563–564. (10.1038/225563a0) - DOI - PubMed
    1. Eigen M, Winkler-Oswatitsch R, Dress A. 1988. Statistical geometry in sequence space: a method of quantitative comparative sequence analysis. Proc. Natl Acad. Sci. USA 85, 5913–5917. (10.1073/pnas.85.16.5913) - DOI - PMC - PubMed
    1. Greenbury SF, Schaper S, Ahnert SE, Louis AA. 2016. Genetic correlations greatly increase mutational robustness and can both reduce and enhance evolvability. PLoS Comput. Biol. 12, 1–27. (10.1371/journal.pcbi.1004773) - DOI - PMC - PubMed
    1. Schuster P, Fontana W, Stadler PF, Hofacker IL. 1994. From sequences to shapes and back: a case study in RNA secondary structures. Proc. R. Soc. Lond. B 255, 279–284. (10.1098/rspb.1994.0040) - DOI - PubMed

Publication types

LinkOut - more resources