. 2020 Oct 20;20(1):347.
doi: 10.1186/s12876-020-01464-z.

Establishment of prognostic nomogram for elderly colorectal cancer patients: a SEER database analysis

Affiliations

Establishment of prognostic nomogram for elderly colorectal cancer patients: a SEER database analysis

Chaoran Yu et al. BMC Gastroenterol. .

Abstract

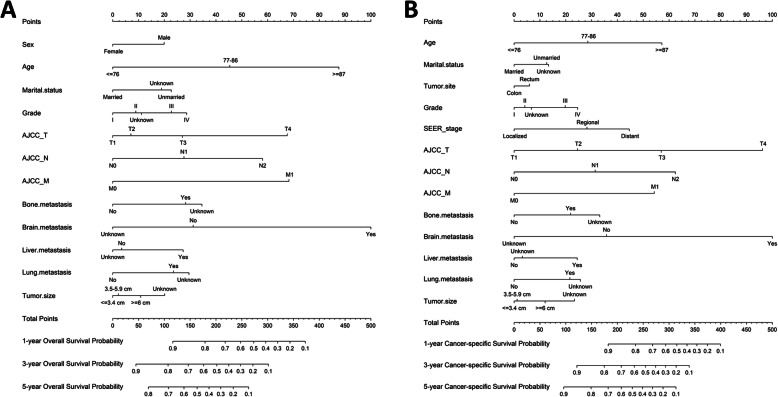
Background: This study aimed to establish nomogram models of overall survival (OS) and cancer-specific survival (CSS) in elderly colorectal cancer (ECRC) patients (Age ≥ 70).

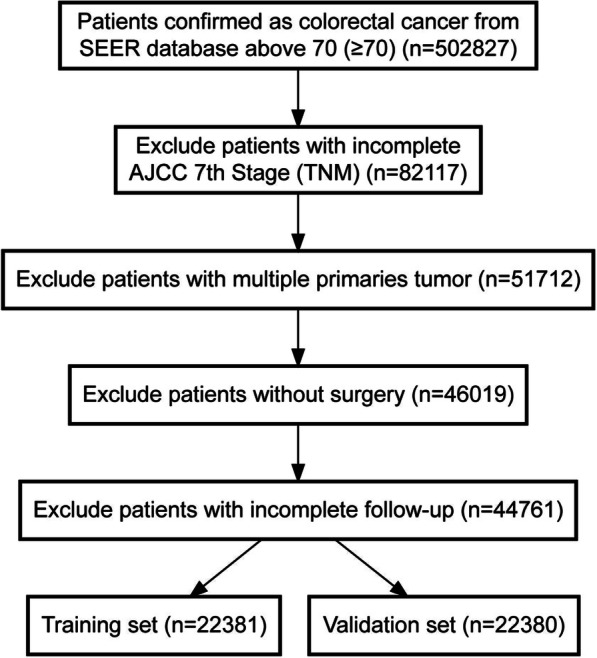
Methods: The clinical variables of patients confirmed as ECRC between 2004 and 2016 were retrieved from the Surveillance, Epidemiology, and End Results (SEER) database. Univariate and multivariate analysis were performed, followed by the construction of nomograms in OS and CSS.

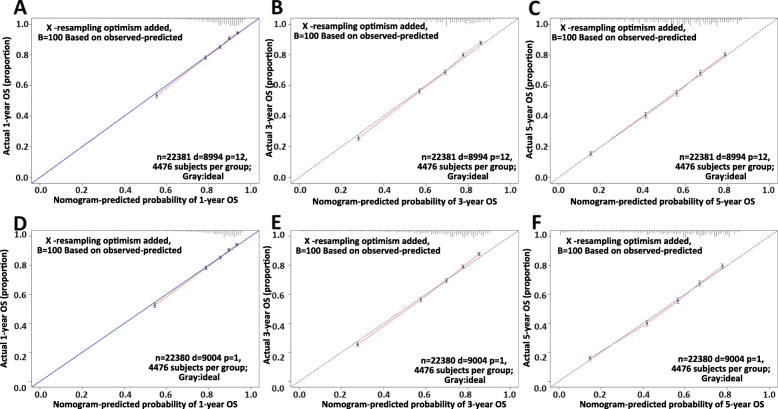
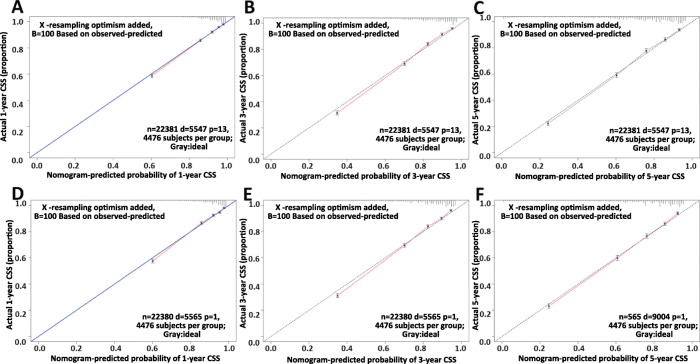
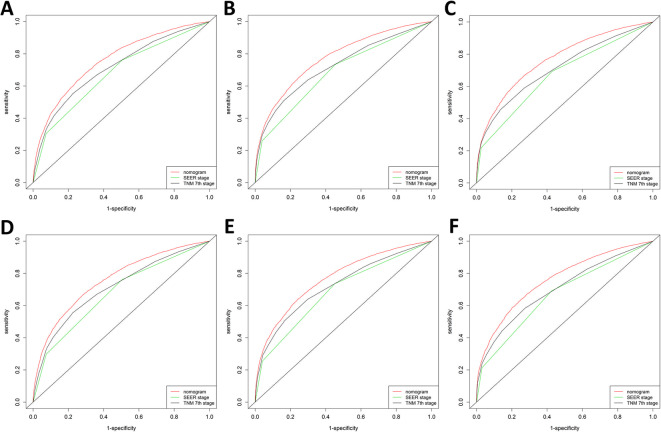
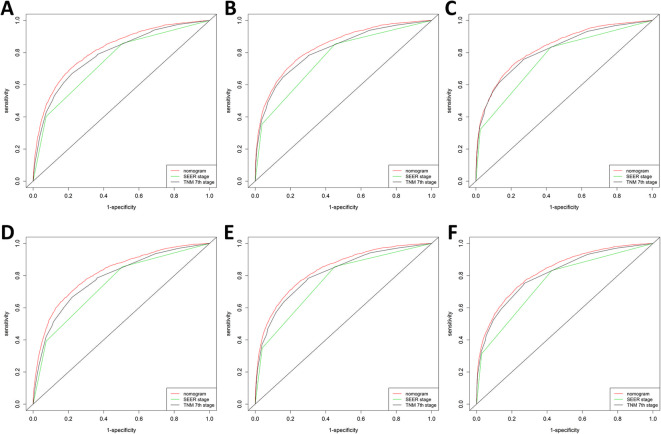
Results: A total of 44,761 cases were finally included in this study. Both C-index and calibration plots indicated noticeable performance of newly established nomograms. Moreover, nomograms also showed higher outcomes of decision curve analysis (DCA) and the area under the curve (AUC) compared to American Joint Committee on Cancer (AJCC) tumor-node-metastasis (TNM) stage and SEER stage.

Conclusions: This study established nomograms of elderly colorectal cancer patients with distinct clinical values compared to AJCC TNM and SEER stages regarding both OS and CSS.

Keywords: Cancer-specific survival; Elderly colon cancer; Nomogram; Overall survival; SEER.


Conflict of interest statement

All authors declare no conflict of interest in this study.

Figures

Fig. 1
Fig. 1
The inclusion criteria flowchart of recruited patients in SEER database
Fig. 2
Fig. 2
The X-tile analysis of best-cutoff points of age and tumor size variables. a X-tile plot of training sets in age; b the cutoff point was highlighted using a histogram of the entire cohort; c the distinct prognosis determined by the cutoff point was shown using a Kaplan-Meier plot (low subset = blue, middle subset = gray, high subset = magenta); d X-tile plot of training sets in tumor size; e the cutoff point was highlighted using a histogram; f Kaplan-Meier plot of prognosis determined by the cutoff point (low subset = blue, middle subset = gray, high subset = magenta)
Fig. 3
Fig. 3
Establishment of overall survival (OS) and cancer-specific survival (CSS) nomograms. a Construction of OS nomogram; b construction of CSS nomogram
Fig. 4
Fig. 4
Calibration plots of OS nomogram model. a 1-year calibration plot of OS using training set; b 3-year calibration plot of OS using training set; c 5-year calibration plot of OS using training set; d 1-year calibration plot of OS using validation set; e 3-year calibration plot of OS using validation set; f 5-year calibration plot of OS using validation set
Fig. 5
Fig. 5
Calibration plots of CSS nomogram model. a 1-year calibration plot of CSS using training set; b 3-year calibration plot of CSS using training set; c 5-year calibration plot of CSS using training set; d 1-year calibration plot of CSS using validation set; e 3-year calibration plot of CSS using validation set; f 5-year calibration plot of CSS using validation set
Fig. 6
Fig. 6
Decision curve analysis (DCA) of OS and CSS nomograms. a DCA of OS nomogram using training set; b DCA of OS nomogram using validation set; c DCA of CSS nomogram using training set; d DCA of CSS nomogram using validation set
Fig. 7
Fig. 7
Receiver operating characteristics curve (ROC) comparison of OS nomogram, AJCC TNM stage and SEER stage. a1-year ROC of OS nomogram using train set; b 3-year ROC of OS nomogram using training set; c 5-year ROC of OS nomogram using training set; d 1-year ROC of OS nomogram using validation set; e 3-year ROC of OS nomogram using validation set; f 5-year ROC of OS nomogram using validation set
Fig. 8
Fig. 8
ROC comparison of CSS nomogram, AJCC TNM stage and SEER stage. a 1-year ROC of CSS nomogram using train set; b 3-year ROC of CSS nomogram using training set; c 5-year ROC of CSS nomogram using training set; d 1-year ROC of CSS nomogram using validation set; e 3-year ROC of CSS nomogram using validation set; f 5-year ROC of CSS nomogram using validation set

Similar articles

Cited by

References

    1. Arnold M, Sierra MS, Laversanne M, et al. Global patterns and trends in colorectal cancer incidence and mortality [J] Gut. 2017;66(4):683–691. doi: 10.1136/gutjnl-2015-310912. - DOI - PubMed
    1. Siegel RL, Miller KD, Fedewa SA, et al. Colorectal cancer statistics, 2017. CA Cancer J Clin. 2017;67(3):177–193. doi: 10.3322/caac.21395. - DOI - PubMed
    1. Ferlay J, Steliarova-Foucher E, Lortet-Tieulent J, Rosso S, Coebergh JW, Comber H, Forman D, Bray F. Cancer incidence and mortality patterns in Europe: estimates for 40 countries in 2012. Eur J Cancer. 2013;49(6):1374–1403. doi: 10.1016/j.ejca.2012.12.027. - DOI - PubMed
    1. Chen W, Zheng R, Baade PD, et al. Cancer statistics in China, 2015. CA Cancer J Clin. 2016;66(2):115–132. doi: 10.3322/caac.21338. - DOI - PubMed
    1. Network CGA. Comprehensive molecular characterization of human colon and rectal cancer. Nature. 2012;487(7407):330. doi: 10.1038/nature11252. - DOI - PMC - PubMed