. 2020 Oct 20;16(1):397.
doi: 10.1186/s12917-020-02612-z.

Mechanisms of ivermectin-induced wound healing

Affiliations

Mechanisms of ivermectin-induced wound healing

Daniel Kwesi Sia et al. BMC Vet Res. .

Abstract

Background: Wounds cause structural and functional discontinuity of an organ. Wound healing, therefore, seeks to re-establish the normal morphology and functionality through intertwined stages of hemostasis, inflammation, proliferation, and tissue remodelling. Ivermectin, a macrolide, has been used as an endectoparasiticide in human and veterinary medicine practice for decades. Here, we show that ivermectin exhibits wounding healing activity by mechanisms independent of its well-known antiparasitic activity. This study aimed to evaluate the wound healing property of ivermectin cream using histochemistry and enzyme-linked immunosorbent assay techniques.

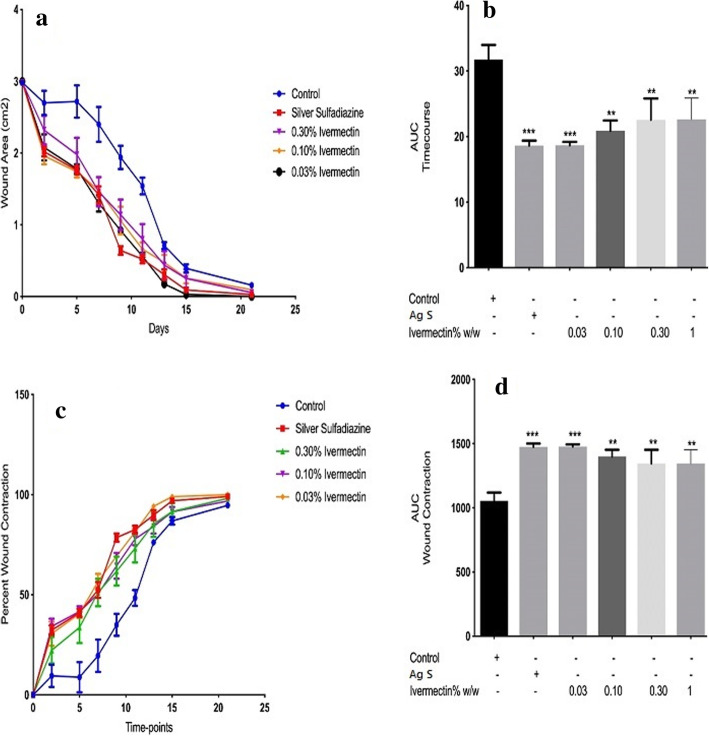
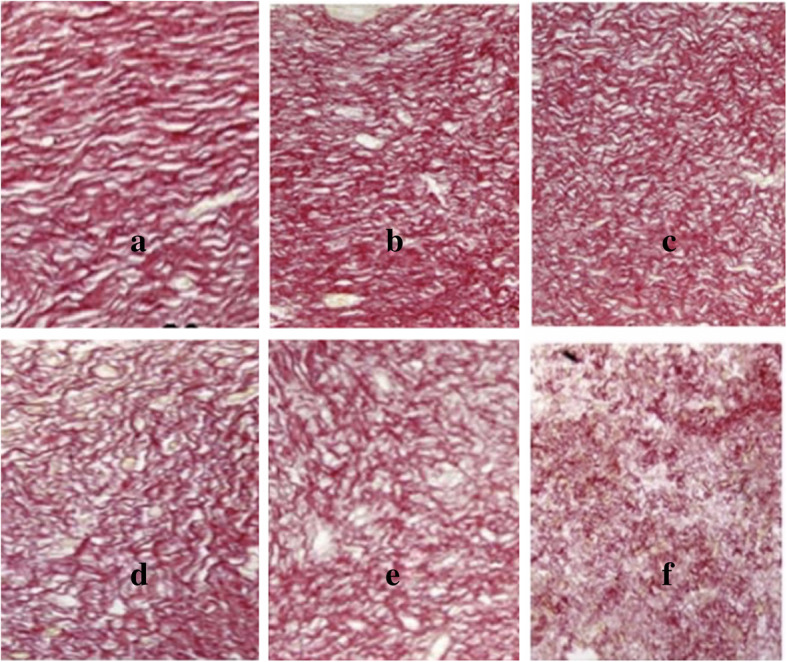
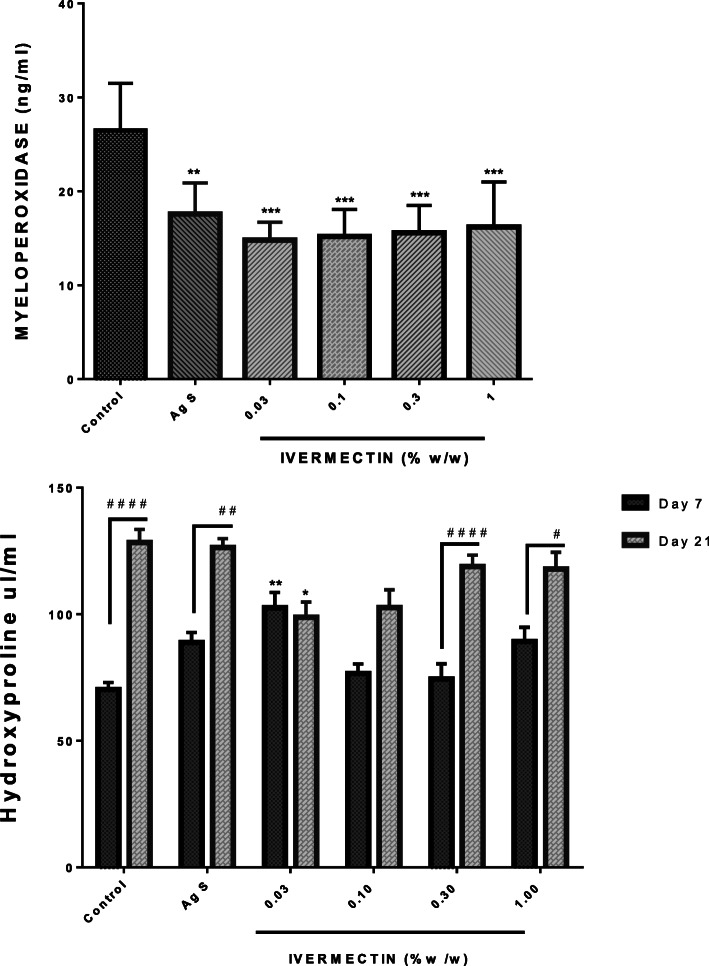
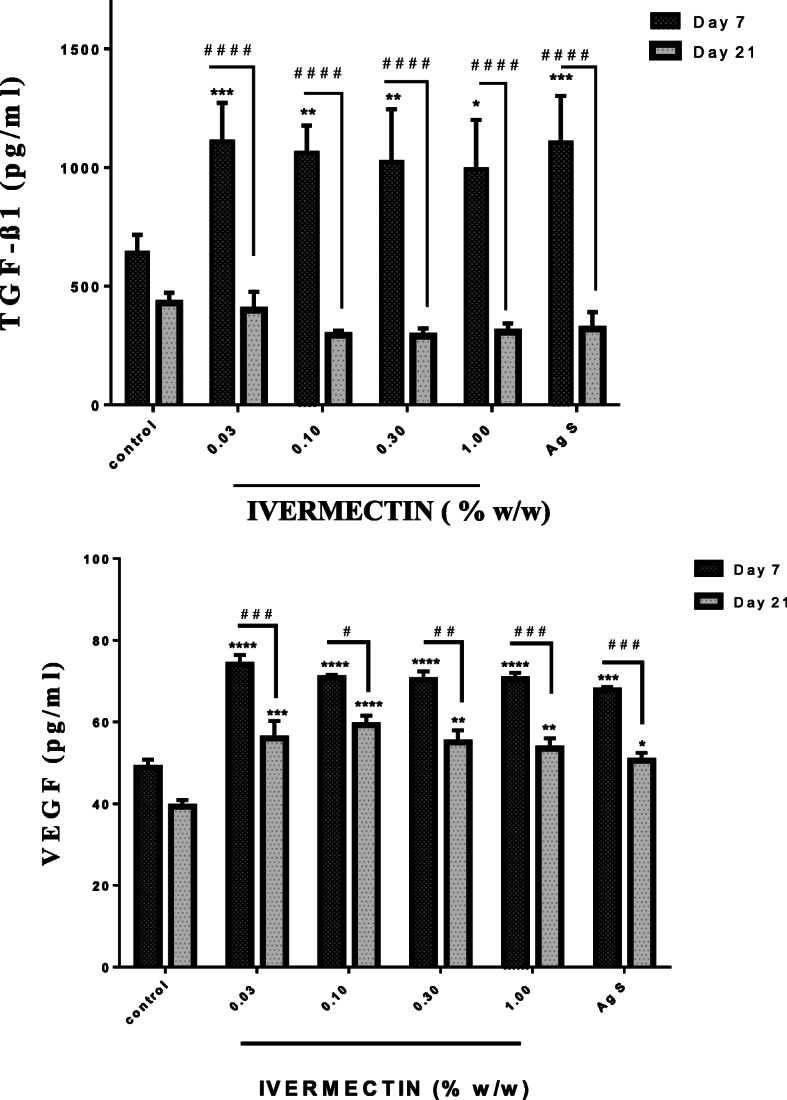
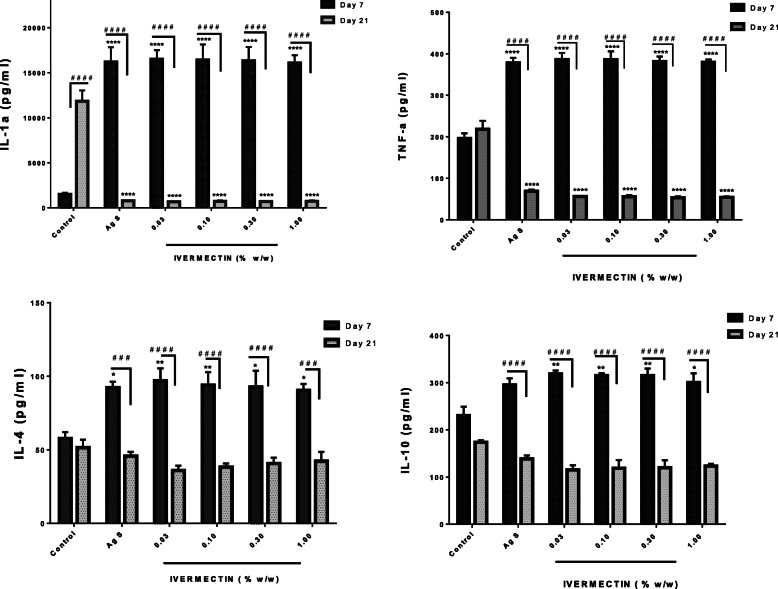
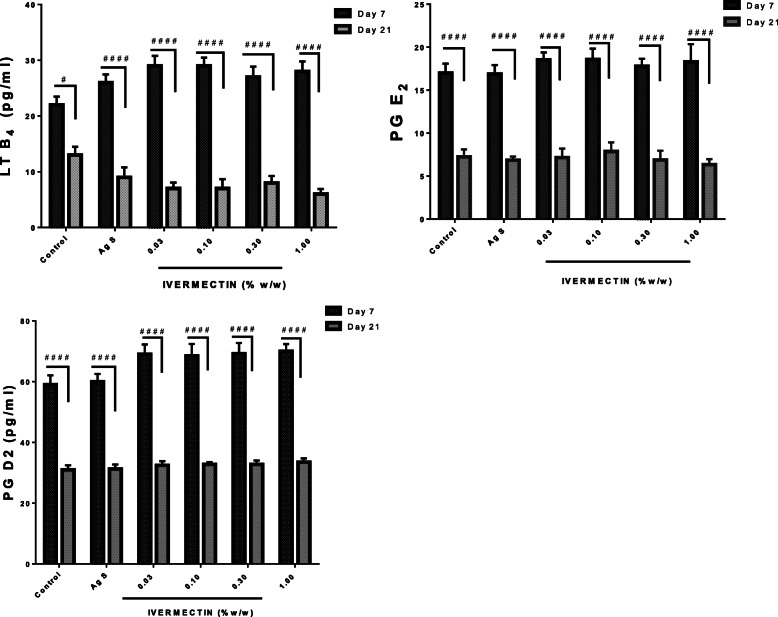
Results: Non-irritant dose of ivermectin cream (0.03-1%) decreased wound macroscopic indices such as exudation, edge edema, hyperemia, and granulation tissue deposition by day 9 compared to day 13 for the vehicle-treated group. This corresponded with a statistically significant wound contraction rate, hydroxyproline deposition, and a decreased time to heal rate. The levels of growth factors TGF-β1 and VEGF were significantly elevated on day 7 but decreased on day 21. This corresponded with changes in cytokines (IL-1α, IL-4, IL-10, and TNF-α) and eicosanoids (LTB4, PGE2, and PGD2) levels on days 7 and 21.. Interestingly, low doses of ivermectin cream (0.03-0.1%) induced wound healing with minimal scarring compared to higher doses of the cream and the positive control, Silver Sulfadiazine.

Conclusion: Ivermectin promotes wound healing partly through modulation of the inflammatory process and the levels of Transforming Growth Factor-Beta 1 and Vascular Endothelial Growth Factor. Low doses of ivermectin cream have the potential to be used in treating wounds with minimal scar tissue formation.

Keywords: Cytokines; Eicosanoids; Growth factors; Hydroxyproline; Ivermectin; TGF-β 1; VEGF.


Conflict of interest statement

Authors have no competing interests.

Figures

Fig. 1
Fig. 1
Morphometric evaluation of the effects of ivermectin cream on cutaneous wound contraction. The time-course of the healing process (a) with the corresponding Areas Under Curve (AUC) (b); Wound Contraction rate (WC) expressed in percentages (c) with the corresponding AUCs (d) are as presented. Statistical analysis for each AUCs is by One-Way ANOVA. ** means p < 0.01 and *** means p < 0.001 when compared to the vehicle (naïve) control group
Fig. 2
Fig. 2
Effects of ivermetin cream on wound collagen content. The wound tissues were taken and fixed in 4% phosphate-buffered formaldehyde (PBF) and stained with Picrosirius Red solution. Photomicrographs showed the degree of red color intensity connoting collagen density as observed in Control (a), Ag S (b), 1% ivermectin (c), 0.30% ivermectin (d), 0.10% ivermectin (e), 0.03% ivermectin (f). Image Scale bar is 40 μm. Micrographs were captured at 400x magnification with a resolution of 12.0 Megapixels
Fig. 3
Fig. 3
Effects of ivermectin cream on cutaneous wound tissue levels of MPO and hydroxyproline. Sprague-Dawley rats were anaesthetised and excision wounds created as described in the methods. Animals were sacrificed on either day 7 or day 21 post-wounding. The levels of myeloperoxidase on day 7 as well as levels of hydroxyproline on day 7 and day 21 were measured and presented as mean ± SEM. The statistical analysis for MPO levels was by One-Way ANOVA. * means p < 0.05, ** means p < 0.01,*** means p < 0.001 for treated groups when compared to the vehicle (naïve) control group. The statistical analysis for hydroxyproline was by Two-Way ANOVA followed by Bonferroni's post hoc test. * means p < 0.05,** means p < 0.01 when compared to the corresponding day control levels whilst # means p < 0.05, ## means p < 0.01, #### means p < 0.0001 when comparing levels on day 7 to day 21 within a group
Fig. 4
Fig. 4
Effects of ivermectin cream on cutaneous wound levels of TGF-B1 and VEGF. Sprague Dawley rats were anaesthetised and excision wounds created as described in the methods. Animals was sacrificed either on day 7 or day 21 post-wounding. The levels of TGF-ß1 on day 7 and day 21 as well as the levels of VEGF on day 7 and day 21 were measured and presented as mean ± SEM. The statistical analysis was by Two-Way ANOVA. Results shown as *p < 0.05,**p < 0.01,***p < 0.001, ****p < 0.0001, for all treated groups compared to vehicle (naïve) control group and # p < 0.05, ## p < 0.01, ### p < 0.001, #### p < 0.0001 represent comparison between levels on Day 7 and 21 within a group
Fig. 5
Fig. 5
Effects of ivermectin on IL-1α, IL-4, IL-10, and TNF-α levels in cutaneous wounds. Sprague Dawley rats were anaesthetised and excision wounds created as described in the methods. Animals were sacrificed either on day 7 or day 21 post-wounding. The levels of the cytokines on day 7 and day 21 are presented graphically as mean ± SEM. The statistical analysis is by two-Way ANOVA followed by Bonferrroni's post hoc test. Results presented as *p < 0.05, **p < 0.01, ***p < 0.001, ****p < 0.0001 when comapred to the vehicle (naïve) control group and # p < 0.05, ## p < 0.01, ### p < 0.001, #### p < 0.0001 represent comparison between levels on Day 7 and 21 within a group
Fig. 6
Fig. 6
Effects of ivermectin on LTB4, PGE2 and PGD2 levels in cutaneous wound. Sprague Dawley rats were anaesthetised and excision wounds created as described in the methods. Animals were sacrificed either on day 7 or day 21 post-wounding. The levels of eicosanoids on day 7 and day 21 are presented graphically as as mean ± SEM. The Two-Way ANOVA statistical analysis results are shown as; # p< 0.05, #### p< 0.0001 when levels on day 7 are compared to levels on day 21 of the same group

References

    1. Guo S, DiPietro LA. Factors affecting wound healing. J Dent Res. 2010;89(3):219–229. - PMC - PubMed
    1. Gauglitz GG, Korting HC, Pavicic T, Ruzicka T, Jeschke MG. Hypertrophic scarring and keloids: pathomechanisms and current and emerging treatment strategies. Mol Med. 2011;17(1–2):113–125. - PMC - PubMed
    1. Lindley LE, Stojadinovic O, Pastar I, Tomic-Canic M. Biology and biomarkers for wound healing. Plast Reconstr Surg. 2016;138(3):18S. - PMC - PubMed
    1. Berman B, Maderal A, Raphael B. Keloids and hypertrophic scars: pathophysiology, classification, and treatment. Dermatologic Surg. 2017;43:S3–S18. - PubMed
    1. Brockmann L, Giannou AD, Gagliani N, Huber S. Regulation of TH17 cells and associated cytokines in wound healing, tissue regeneration, and carcinogenesis. Int J Mol Sci. 2017;18(5):1033. - PMC - PubMed

LinkOut - more resources