Elasticity spectra as a tool to investigate actin cortex mechanics
- PMID: 33081777
- PMCID: PMC7576730
- DOI: 10.1186/s12951-020-00706-2
Elasticity spectra as a tool to investigate actin cortex mechanics
Abstract
Background: The mechanical properties of single living cells have proven to be a powerful marker of the cell physiological state. The use of nanoindentation-based single cell force spectroscopy provided a wealth of information on the elasticity of cells, which is still largely to be exploited. The simplest model to describe cell mechanics is to treat them as a homogeneous elastic material and describe it in terms of the Young's modulus. Beside its simplicity, this approach proved to be extremely informative, allowing to assess the potential of this physical indicator towards high throughput phenotyping in diagnostic and prognostic applications.
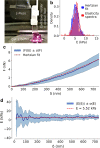
Results: Here we propose an extension of this analysis to explicitly account for the properties of the actin cortex. We present a method, the Elasticity Spectra, to calculate the apparent stiffness of the cell as a function of the indentation depth and we suggest a simple phenomenological approach to measure the thickness and stiffness of the actin cortex, in addition to the standard Young's modulus.
Conclusions: The Elasticity Spectra approach is tested and validated on a set of cells treated with cytoskeleton-affecting drugs, showing the potential to extend the current representation of cell mechanics, without introducing a detailed and complex description of the intracellular structure.
Keywords: Actin cortex; Cell mechanics; Cytoskeleton; Force spectroscopy; Nanoindentation; Scanning probe microscopy.
Conflict of interest statement
The authors declare that they have no competing interests.
Figures


Similar articles
-
Evaluation of the elastic Young's modulus and cytotoxicity variations in fibroblasts exposed to carbon-based nanomaterials.J Nanobiotechnology. 2019 Feb 23;17(1):32. doi: 10.1186/s12951-019-0460-8. J Nanobiotechnology. 2019. PMID: 30797235 Free PMC article.
-
Nonlinear Cellular Mechanical Behavior Adaptation to Substrate Mechanics Identified by Atomic Force Microscope.Int J Mol Sci. 2018 Nov 4;19(11):3461. doi: 10.3390/ijms19113461. Int J Mol Sci. 2018. PMID: 30400365 Free PMC article.
-
Modulating cancer cell mechanics and actin cytoskeleton structure by chemical and mechanical stimulations.J Biomed Mater Res A. 2019 Aug;107(8):1569-1581. doi: 10.1002/jbm.a.36670. Epub 2019 Apr 25. J Biomed Mater Res A. 2019. PMID: 30884131
-
Medical applications of the intrinsic mechanical properties of single cells.Acta Biochim Biophys Sin (Shanghai). 2016 Oct;48(10):865-871. doi: 10.1093/abbs/gmw081. Epub 2016 Aug 18. Acta Biochim Biophys Sin (Shanghai). 2016. PMID: 27542404 Review.
-
Actin Mechanics and Fragmentation.J Biol Chem. 2015 Jul 10;290(28):17137-44. doi: 10.1074/jbc.R115.636472. Epub 2015 May 8. J Biol Chem. 2015. PMID: 25957404 Free PMC article. Review.
Cited by
-
Piezo1 - Serine/threonine-protein phosphatase 2A - Cofilin1 biochemical mechanotransduction axis controls F-actin dynamics and cell migration.Heliyon. 2024 Jun 5;10(11):e32458. doi: 10.1016/j.heliyon.2024.e32458. eCollection 2024 Jun 15. Heliyon. 2024. PMID: 38933959 Free PMC article.
-
Nanotopography reveals metabolites that maintain the immunomodulatory phenotype of mesenchymal stromal cells.Nat Commun. 2023 Feb 10;14(1):753. doi: 10.1038/s41467-023-36293-7. Nat Commun. 2023. PMID: 36765065 Free PMC article.
-
Dissecting cell membrane tension dynamics and its effect on Piezo1-mediated cellular mechanosensitivity using force-controlled nanopipettes.Nat Methods. 2024 Jun;21(6):1063-1073. doi: 10.1038/s41592-024-02277-8. Epub 2024 May 27. Nat Methods. 2024. PMID: 38802520 Free PMC article.
-
Non-contact elastography methods in mechanobiology: a point of view.Eur Biophys J. 2022 Mar;51(2):99-104. doi: 10.1007/s00249-021-01567-9. Epub 2021 Aug 31. Eur Biophys J. 2022. PMID: 34463775 Free PMC article. Review.
-
Quantifying both viscoelasticity and surface tension: Why sharp tips overestimate cell stiffness.Biophys J. 2024 Jan 16;123(2):210-220. doi: 10.1016/j.bpj.2023.12.008. Epub 2023 Dec 12. Biophys J. 2024. PMID: 38087780 Free PMC article.
References
Publication types
MeSH terms
Substances
Grants and funding
LinkOut - more resources
Full Text Sources

