

Prostate cancer tumour control probability modelling for external beam radiotherapy based on multi-parametric MRI-GTV definition
- PMID: 33081804
- PMCID: PMC7574270
- DOI: 10.1186/s13014-020-01683-4
Prostate cancer tumour control probability modelling for external beam radiotherapy based on multi-parametric MRI-GTV definition
Abstract
Purpose: To evaluate the applicability and estimate the radiobiological parameters of linear-quadratic Poisson tumour control probability (TCP) model for primary prostate cancer patients for two relevant target structures (prostate gland and GTV). The TCP describes the dose-response of prostate after definitive radiotherapy (RT). Also, to analyse and identify possible significant correlations between clinical and treatment factors such as planned dose to prostate gland, dose to GTV, volume of prostate and mpMRI-GTV based on multivariate logistic regression model.
Methods: The study included 129 intermediate and high-risk prostate cancer patients (cN0 and cM0), who were treated with image-guided intensity modulated radiotherapy (IMRT) ± androgen deprivation therapy with a median follow-up period of 81.4 months (range 42.0-149.0) months. Tumour control was defined as biochemical relapse free survival according to the Phoenix definition (BRFS). MpMRI-GTV was delineated retrospectively based on a pre-treatment multi-parametric MR imaging (mpMRI), which was co-registered to the planning CT. The clinical treatment planning procedure was based on prostate gland, delineated on CT imaging modality. Furthermore, we also fitted the clinical data to TCP model for the two considered targets for the 5-year follow-up after radiation treatment, where our cohort was composed of a total number of 108 patients, of which 19 were biochemical relapse (BR) patients.
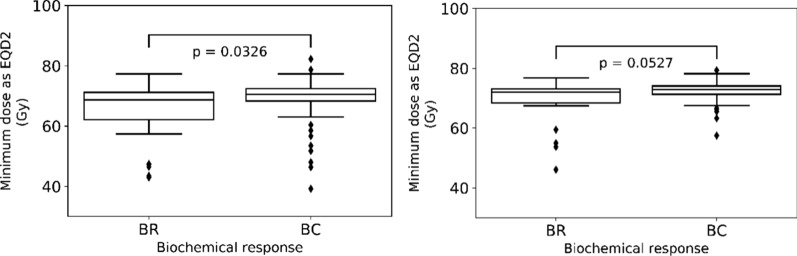
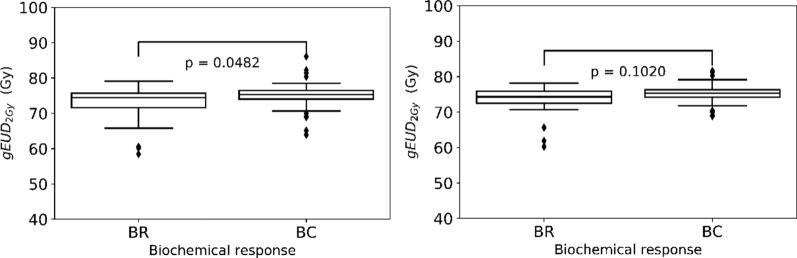
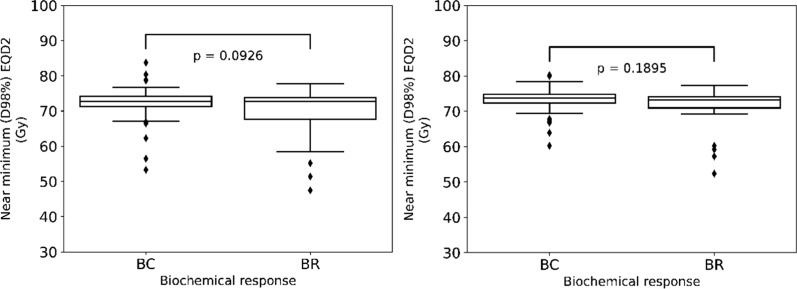
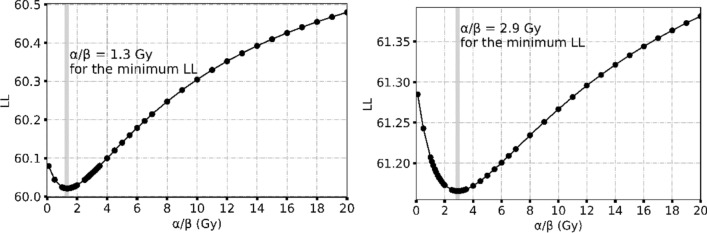
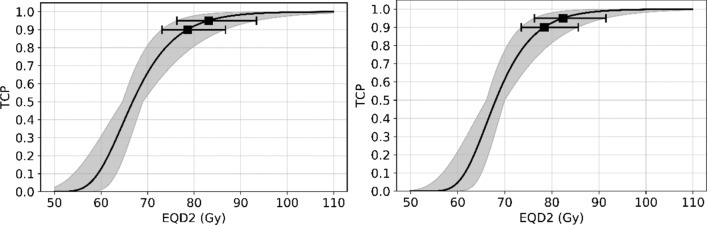
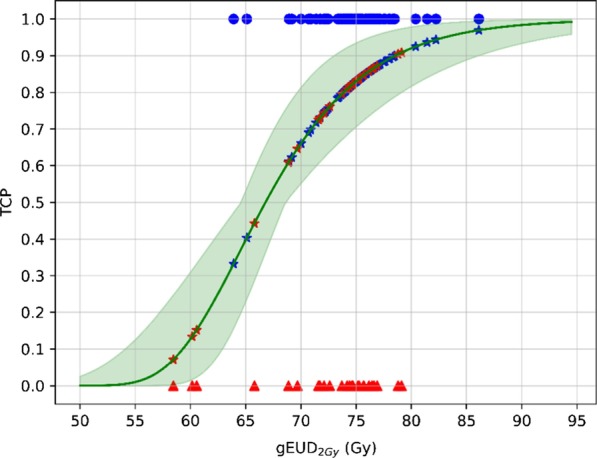
Results: For the median follow-up period of 81.4 months (range 42.0-149.0) months, our results indicated an appropriate α/β = 1.3 Gy for prostate gland and α/β = 2.9 Gy for mpMRI-GTV. Only for prostate gland, EQD2 and gEUD2Gy were significantly lower in the biochemical relapse (BR) group compared to the biochemical control (BC) group. Fitting results to the linear-quadratic Poisson TCP model for prostate gland and α/β = 1.3 Gy were D50 = 66.8 Gy with 95% CI [64.6 Gy, 69.0 Gy], and γ = 3.8 with 95% CI [2.6, 5.2]. For mpMRI-GTV and α/β = 2.9 Gy, D50 was 68.1 Gy with 95% CI [66.1 Gy, 70.0 Gy], and γ = 4.5 with 95% CI [3.0, 6.1]. Finally, for the 5-year follow-up after the radiation treatment, our results for the prostate gland were: D50 = 64.6 Gy [61.6 Gy, 67.4 Gy], γ = 3.1 [2.0, 4.4], α/β = 2.2 Gy (95% CI was undefined). For the mpMRI-GTV, the optimizer was unable to deliver any reasonable results for the expected clinical D50 and α/β. The results for the mpMRI-GTV were D50 = 50.1 Gy [44.6 Gy, 56.0 Gy], γ = 0.8 [0.5, 1.2], α/β = 0.0 Gy (95% CI was undefined). For a follow-up time of 5 years and a fixed α/β = 1.6 Gy, the TCP fitting results for prostate gland were D50 = 63.9 Gy [60.8 Gy, 67.0 Gy], γ = 2.9 [1.9, 4.1], and for mpMRI-GTV D50 = 56.3 Gy [51.6 Gy, 61.1 Gy], γ = 1.3 [0.8, 1.9].
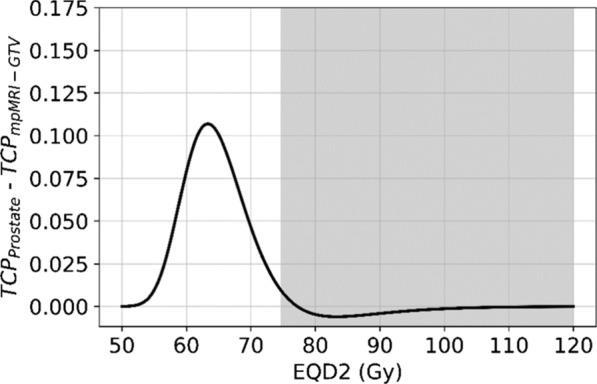
Conclusion: The linear-quadratic Poisson TCP model was better fit when the prostate gland was considered as responsible target than with mpMRI-GTV. This is compatible with the results of the comparison of the dose distributions among BR and BC groups and with the results achieved with the multivariate logistic model regarding gEUD2Gy. Probably limitations of mpMRI in defining the GTV explain these results. Another explanation could be the relatively homogeneous dose prescription and the relatively low number of recurrences. The failure to identify any benefit for considering mpMRI-GTV as the target responsible for the clinical response is confirmed when considering a fixed α/β = 1.6 Gy, a fixed follow-up time for biochemical response at 5 years or Gleason score differentiation.
Keywords: Linear-quadratic Poisson model; Multivariate logistic regression model; Prostate cancer; Therapy response prediction; Tumour control probability (TCP).
Conflict of interest statement
The authors declare that they have no competing interests.
Figures
References
-
- Wang L, Li C, Meng X, Li C, Sun X, Shang D, Pang L, Li Y, Lu J, Yu J. Dosimetric and radiobiological comparison of external beam radiotherapy using simultaneous integrated boost technique for esophageal cancer in different location. Front Oncol. 2019;9:674. doi: 10.3389/fonc.2019.00674. - DOI - PMC - PubMed
-
- Zamboglou C, Klein CM, Thomann B, Fassbender TF, Rischke HC, Kirste S, Henne K, Volegova-Neher N, Bock M, Langer M, Meyer PT, Baltas D, Grosu AL. The dose distribution in dominant intraprostatic tumour lesions defined by multiparametric MRI and PSMA PET/CT correlates with the outcome in patients treated with primary radiation therapy for prostate cancer. Radiat Oncol (London, England) 2018;13(1):65. doi: 10.1186/s13014-018-1014-1. - DOI - PMC - PubMed
MeSH terms
LinkOut - more resources
Full Text Sources
Medical
