Global trend of diabetes mortality attributed to vascular complications, 2000-2016
- PMID: 33081808
- PMCID: PMC7573870
- DOI: 10.1186/s12933-020-01159-5
Global trend of diabetes mortality attributed to vascular complications, 2000-2016
Abstract
Background: The global epidemic of diabetes mellitus continues to grow and affects developed and developing countries alike. Intensive glycemic control is thought to modify the risks for vascular complications, hence the risks for diabetes-related death. We investigated the trend of diabetic vascular complication-related deaths between 2000 and 2016 in the global diabetes landscape.
Methods: We collected 17 years of death certificates data from 108 countries in the World Health Organization mortality database between 2000 and 2016, with coding for diabetic complications. Crude and age-standardized proportions and rates were calculated. Trend analysis was done with annual average percentage change (AAPC) of rates computed by joinpoint regression.
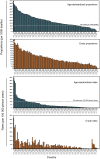
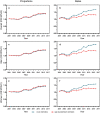
Results: From 2000 through 2016, 7,108,145 deaths of diabetes were reported in the 108 countries. Among them, 26.8% (1,904,787 cases) were attributed to vascular complications in damaged organs, including the kidneys (1,355,085 cases, 71.1%), peripheral circulatory (515,293 cases, 27.1%), nerves (28,697 cases, 1.5%) and eyes (5751 cases, 0.3%). Overall, the age-standardized proportion of vascular complication-related mortality was 267.8 [95% confidence interval (95% CI), 267.5-268.1] cases per 1000 deaths and the rate was 53.6 (95% CI 53.5-53.7) cases per 100,000 person-years. Throughout the 17-year period, the overall age-standardized proportions of deaths attributable to vascular complications had increased 37.9%, while the overall age-standardized mortality rates related to vascular complications had increased 30.8% (AAPC = 1.9% [1.4-2.4%, p < 0.05]). These increases were predominantly driven by a 159.8% increase in the rate (AAPC = 2.7% [1.2-4.3%, p < 0.05]) from renal complications. Trends in the rates and AAPC of deaths varied by type of diabetes and of complications, as well as by countries, regions and domestic income.
Conclusion: Diabetic vascular complication-related deaths had increased substantially during 2000-2016, mainly driven by the increased mortality of renal complications.
Keywords: Diabetes mellitus; Diabetic nephropathy; Mortality; Vascular complication.
Conflict of interest statement
All the authors declare that they have no conflict of interest.
Figures


References
-
- Saeedi P, Petersohn I, Salpea P, et al. Global and regional diabetes prevalence estimates for 2019 and projections for 2030 and 2045: Results from the International Diabetes Federation Diabetes Atlas, 9 (th) edition. Diabetes Res Clin Pract. 2019;157:107843. doi: 10.1016/j.diabres.2019.107843. - DOI - PubMed
-
- Zoungas S, Arima H, Gerstein HC, et al. Effects of intensive glucose control on microvascular outcomes in patients with type 2 diabetes: a meta-analysis of individual participant data from randomised controlled trials. Lancet Diabetes Endocrinol. 2017;5:431–437. doi: 10.1016/S2213-8587(17)30104-3. - DOI - PubMed
Publication types
MeSH terms
LinkOut - more resources
Full Text Sources
Medical

