. 2020 Oct 20;19(1):375.
doi: 10.1186/s12936-020-03440-0.

SNP barcodes provide higher resolution than microsatellite markers to measure Plasmodium vivax population genetics

Affiliations

SNP barcodes provide higher resolution than microsatellite markers to measure Plasmodium vivax population genetics

Abebe A Fola et al. Malar J. .

Abstract

Background: Genomic surveillance of malaria parasite populations has the potential to inform control strategies and to monitor the impact of interventions. Barcodes comprising large numbers of single nucleotide polymorphism (SNP) markers are accurate and efficient genotyping tools, however may need to be tailored to specific malaria transmission settings, since 'universal' barcodes can lack resolution at the local scale. A SNP barcode was developed that captures the diversity and structure of Plasmodium vivax populations of Papua New Guinea (PNG) for research and surveillance.

Methods: Using 20 high-quality P. vivax genome sequences from PNG, a total of 178 evenly spaced neutral SNPs were selected for development of an amplicon sequencing assay combining a series of multiplex PCRs and sequencing on the Illumina MiSeq platform. For initial testing, 20 SNPs were amplified in a small number of mono- and polyclonal P. vivax infections. The full barcode was then validated by genotyping and population genetic analyses of 94 P. vivax isolates collected between 2012 and 2014 from four distinct catchment areas on the highly endemic north coast of PNG. Diversity and population structure determined from the SNP barcode data was then benchmarked against that of ten microsatellite markers used in previous population genetics studies.

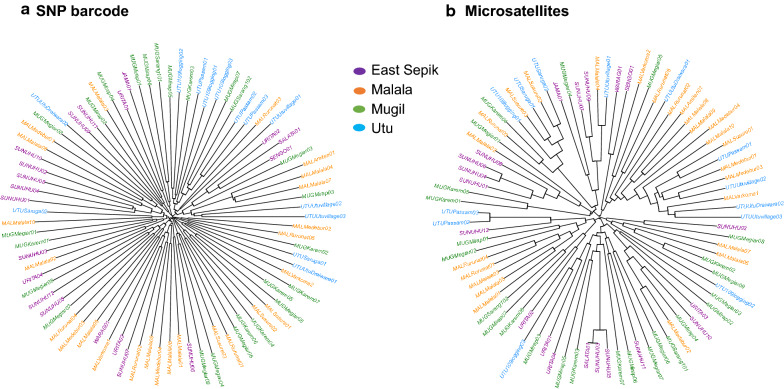
Results: From a total of 28,934,460 reads generated from the MiSeq Illumina run, 87% mapped to the PvSalI reference genome with deep coverage (median = 563, range 56-7586) per locus across genotyped samples. Of 178 SNPs assayed, 146 produced high-quality genotypes (minimum coverage = 56X) in more than 85% of P. vivax isolates. No amplification bias was introduced due to either polyclonal infection or whole genome amplification (WGA) of samples before genotyping. Compared to the microsatellite panels, the SNP barcode revealed greater variability in genetic diversity between populations and geographical population structure. The SNP barcode also enabled assignment of genotypes according to their geographic origins with a significant association between genetic distance and geographic distance at the sub-provincial level.

Conclusions: High-throughput SNP barcoding can be used to map variation of malaria transmission dynamics at sub-national resolution. The low cost per sample and genotyping strategy makes the transfer of this technology to field settings highly feasible.

Keywords: Diversity; Malaria; Microsatellites; Papua New Guinea; Plasmodium vivax; Population structure; Single Nucleotide Polymorphisms (SNPs).


Conflict of interest statement

The authors declare that they have no any competing interests.

Figures

Fig. 1
Fig. 1
Map of the study area. Map of Papua New Guinea showing the location of four distinct catchment areas from which P. vivax isolates were obtained (colored dots). A total of 94 P. vivax isolates were selected from 2012/13 East Sepik and 2014 Madang cross-sectional surveys. Samples were genotyped using both SNP barcodes and microsatellites. n = the number of genotyped P. vivax isolates. Black dots indicate three provinces of PNG where 20 WGS P. vivax obtained for the assay development
Fig. 2
Fig. 2
Genetic diversity of P. vivax populations from the north coast of Papua New Guinea. Genetic diversity was measured for four catchment areas on the north coast of Papua New Guinea using a SNP nucleotide diversity (π), which was measured by calculating the average number of pairwise differences at assayed SNPs between all members of sample using DnaSP Version 5.0 [65]; b Microsatellite Expected Heterozygosity (He = [n/(n-1)] [(1- Σpi2)] where n is the number of isolates sampled and pi is the allele frequency at the ith loci) using as FSTAT software version 2.9.4 [67]; c SNP barcode diversity and d microsatellite haplotype diversity. For c and d, box plots show the results from another genetic diversity metric, 1-mean pairwise allele sharing. The variation in the box and median distribution indicates variability in genotype relatedness amongst pairs of genotypes. The analysis was done using genetic distance matrix for 1-PS generated by the ‘dist. gene’ command in “Ape” R package
Fig. 3
Fig. 3
Bayesian cluster analysis of P. vivax genotypes from the north coast of Papua New Guinea. Cluster analysis was done using a SNP barcodes or b microsatellite haplotypes for 86 P. vivax isolates from four geographic regions of Papua New Guinea using STRUCTURE software version 2.3.4 [68]. STRUCTURE bar plots representing Individual ancestry coefficients are shown for K = 3, each vertical bar represents an individual haplotype and the membership coefficient (Q) within each of the genetic populations, as defined by the different colours
Fig. 4
Fig. 4
Discriminant analysis of principal component (DAPC) of P. vivax isolates from the north coast of Papua New Guinea. DAPC was used to identify clustering amongst isolates from the four catchment areas for a SNP barcodes and b microsatellite haplotypes. On the top of the figure scatterplots of DAPC (Bottom) are shown. Clusters are defined by ellipses and indicate the variance within the clusters whereas dots indicate the positions of individual parasite genotypes within the cluster. Eigenvalues represent the amount of genetic variation captured by the discriminant factors plotted as the x- and y-axis. On the bottom, individual density plots are shown for the first discriminant function. The data was analysed using DAPC function in “Adegenet” R package [69]
Fig. 5
Fig. 5
Association between geographic and genetic distance between P. vivax populations of Papua New Guinea. Genetic differentiation between population pairs was measuring using FST for a SNP barcodes and b microsatellites and measured in association with geographic distance based on geographic co-ordinates of villages. A Mantel test was used to measure the association using R “Vegan” package [67]
Fig. 6
Fig. 6
Phylogenetic relationships among individual P. vivax isolates from the north coast of Papua New Guinea. Neighbour joining trees are shown for a SNP barcodes and b microsatellite haplotypes. Branches are coloured according to the four catchment areas. Labels indicate a unique sample ID and village of origin. Distance was measured using the genetic distance matrix for 1-PS calculated by “Ape” R package, ‘dist. gene’ command

Similar articles

Cited by

References

    1. WHO. World malaria report 2019. Geneva: World Health Organization; 2019.
    1. Karyana M, Burdarm L, Yeung S, Kenangalem E, Wariker N, Maristela R, et al. Malaria morbidity in Papua Indonesia, an area with multidrug resistant Plasmodium vivax and Plasmodium falciparum. Malar J. 2008;7:148. doi: 10.1186/1475-2875-7-148. - DOI - PMC - PubMed
    1. Quispe AM, Pozo E, Guerrero E, Durand S, Baldeviano GC, Edgel KA, et al. Plasmodium vivax hospitalizations in a monoendemic malaria region: severe vivax malaria? Am J Trop Med Hyg. 2014;91:11–17. doi: 10.4269/ajtmh.12-0610. - DOI - PMC - PubMed
    1. Tjitra E, Anstey NM, Sugiarto P, Warikar N, Kenangalem E, Karyana M, et al. Multidrug-resistant Plasmodium vivax associated with severe and fatal malaria: a prospective study in Papua Indonesia. PLoS Med. 2008;5:e128. doi: 10.1371/journal.pmed.0050128. - DOI - PMC - PubMed
    1. Price RN, Seidlein L, Valecha N, Nosten F, Baird JK, White NJ. Global extent of chloroquine-resistant Plasmodium vivax: a systematic review and meta-analysis. Lancet Infect Dis. 2014;14:182–191. doi: 10.1016/S1473-3099(14)70855-2. - DOI - PMC - PubMed

MeSH terms

LinkOut - more resources