

Leveraging locus-specific epigenetic heterogeneity to improve the performance of blood-based DNA methylation biomarkers
- PMID: 33081832
- PMCID: PMC7574234
- DOI: 10.1186/s13148-020-00939-w
Leveraging locus-specific epigenetic heterogeneity to improve the performance of blood-based DNA methylation biomarkers
Abstract
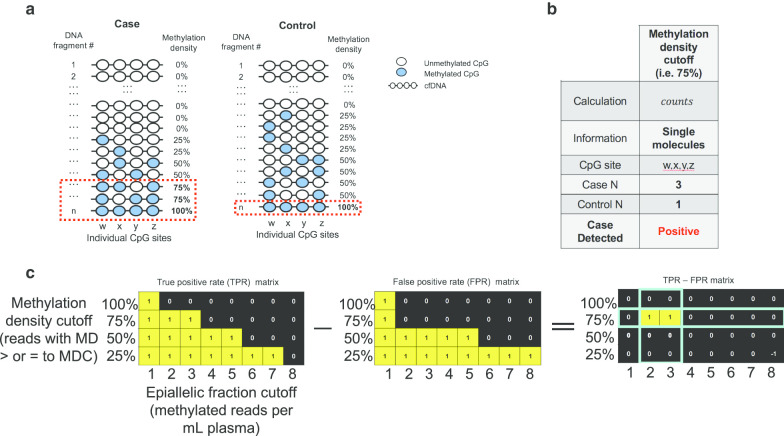
Background: Variation in intercellular methylation patterns can complicate the use of methylation biomarkers for clinical diagnostic applications such as blood-based cancer testing. Here, we describe development and validation of a methylation density binary classification method called EpiClass (available for download at https://github.com/Elnitskilab/EpiClass ) that can be used to predict and optimize the performance of methylation biomarkers, particularly in challenging, heterogeneous samples such as liquid biopsies. This approach is based upon leveraging statistical differences in single-molecule sample methylation density distributions to identify ideal thresholds for sample classification.
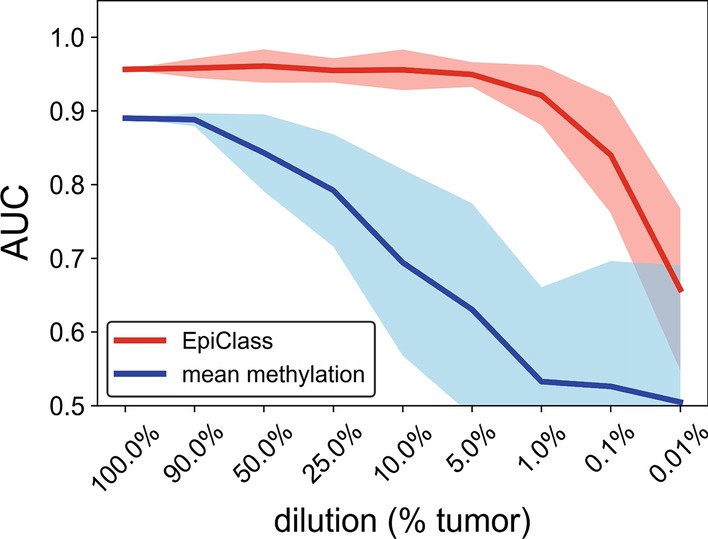
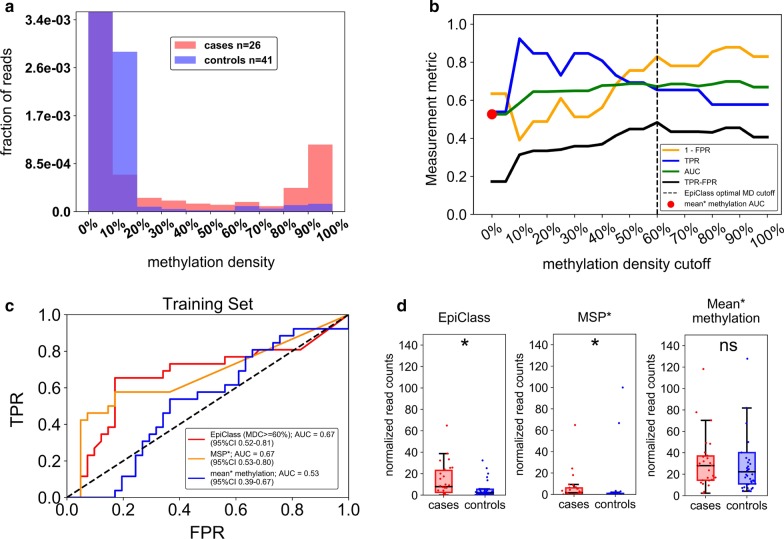
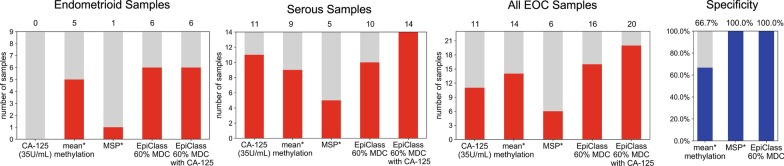
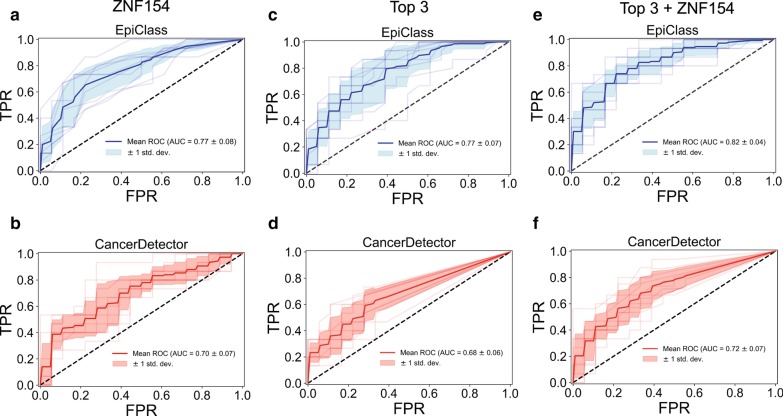
Results: We developed and tested the classifier using reduced representation bisulfite sequencing (RRBS) data derived from ovarian carcinoma tissue DNA and controls. We used these data to perform in silico simulations using methylation density profiles from individual epiallelic copies of ZNF154, a genomic locus known to be recurrently methylated in numerous cancer types. From these profiles, we predicted the performance of the classifier in liquid biopsies for the detection of epithelial ovarian carcinomas (EOC). In silico analysis indicated that EpiClass could be leveraged to better identify cancer-positive liquid biopsy samples by implementing precise thresholds with respect to methylation density profiles derived from circulating cell-free DNA (cfDNA) analysis. These predictions were confirmed experimentally using DREAMing to perform digital methylation density analysis on a cohort of low volume (1-ml) plasma samples obtained from 26 EOC-positive and 41 cancer-free women. EpiClass performance was then validated in an independent cohort of 24 plasma specimens, derived from a longitudinal study of 8 EOC-positive women, and 12 plasma specimens derived from 12 healthy women, respectively, attaining a sensitivity/specificity of 91.7%/100.0%. Direct comparison of CA-125 measurements with EpiClass demonstrated that EpiClass was able to better identify EOC-positive women than standard CA-125 assessment. Finally, we used independent whole genome bisulfite sequencing (WGBS) datasets to demonstrate that EpiClass can also identify other cancer types as well or better than alternative methylation-based classifiers.
Conclusions: Our results indicate that assessment of intramolecular methylation density distributions calculated from cfDNA facilitates the use of methylation biomarkers for diagnostic applications. Furthermore, we demonstrated that EpiClass analysis of ZNF154 methylation was able to outperform CA-125 in the detection of etiologically diverse ovarian carcinomas, indicating broad utility of ZNF154 for use as a biomarker of ovarian cancer.
Keywords: Cancer diagnostics; Cell-free DNA; DNA methylation; Intermolecular variation; Ovarian cancer.
Conflict of interest statement
The authors declare that they have no competing interests.
Figures

Similar articles
-
Transformer-based AI technology improves early ovarian cancer diagnosis using cfDNA methylation markers.Cell Rep Med. 2024 Aug 20;5(8):101666. doi: 10.1016/j.xcrm.2024.101666. Epub 2024 Aug 1. Cell Rep Med. 2024. PMID: 39094578 Free PMC article.
-
Detection of aberrant methylation of HOXA9 and HIC1 through multiplex MethyLight assay in serum DNA for the early detection of epithelial ovarian cancer.Int J Cancer. 2020 Sep 15;147(6):1740-1752. doi: 10.1002/ijc.32984. Epub 2020 Mar 31. Int J Cancer. 2020. PMID: 32191343
-
Assessing ZNF154 methylation in patient plasma as a multicancer marker in liquid biopsies from colon, liver, ovarian and pancreatic cancer patients.Sci Rep. 2021 Jan 8;11(1):221. doi: 10.1038/s41598-020-80345-7. Sci Rep. 2021. PMID: 33420235 Free PMC article.
-
Liquid biopsies: DNA methylation analyses in circulating cell-free DNA.J Genet Genomics. 2018 Apr 20;45(4):185-192. doi: 10.1016/j.jgg.2018.02.007. Epub 2018 Mar 8. J Genet Genomics. 2018. PMID: 29706556 Review.
-
Diagnostic significance assessment of the circulating cell-free DNA in ovarian cancer: An updated meta-analysis.Gene. 2019 Sep 25;714:143993. doi: 10.1016/j.gene.2019.143993. Epub 2019 Jul 19. Gene. 2019. PMID: 31330238 Review.
Cited by
-
Cell type deconvolution of methylated cell-free DNA at the resolution of individual reads.NAR Genom Bioinform. 2023 Jun 2;5(2):lqad048. doi: 10.1093/nargab/lqad048. eCollection 2023 Jun. NAR Genom Bioinform. 2023. PMID: 37274121 Free PMC article.
-
Evaluating Stacked Methylation Markers for Blood-Based Multicancer Detection.Cancers (Basel). 2023 Oct 1;15(19):4826. doi: 10.3390/cancers15194826. Cancers (Basel). 2023. PMID: 37835520 Free PMC article.
-
Monitoring breast cancer progression through circulating methylated GCM2 and TMEM240 detection.Clin Epigenetics. 2025 Jul 21;17(1):128. doi: 10.1186/s13148-025-01939-4. Clin Epigenetics. 2025. PMID: 40691650 Free PMC article.
-
Ovarian Cancer Diagnosis and Prognosis Based on Cell-Free DNA Methylation.Cancer Control. 2024 Jan-Dec;31:10732748241255548. doi: 10.1177/10732748241255548. Cancer Control. 2024. PMID: 38764160 Free PMC article. Review.
-
Multiplex digital profiling of DNA methylation heterogeneity for sensitive and cost-effective cancer detection in low-volume liquid biopsies.Sci Adv. 2024 Nov 22;10(47):eadp1704. doi: 10.1126/sciadv.adp1704. Epub 2024 Nov 22. Sci Adv. 2024. PMID: 39576863 Free PMC article.
References
-
- Sanchez-Vega F, Gotea V, Margolin G, Elnitski L. Pan-cancer stratification of solid human epithelial tumors and cancer cell lines reveals commonalities and tissue-specific features of the CpG island methylator phenotype. Epigenet Chromat. 2015;8:14. doi: 10.1186/s13072-015-0007-7. - DOI - PMC - PubMed
-
- Sanchez-Vega F, Gotea V, Petrykowska HM, Margolin G, Krivak TC, DeLoia JA, et al. Recurrent patterns of DNA methylation in the ZNF154, CASP8, and VHL promoters across a wide spectrum of human solid epithelial tumors and cancer cell lines. Epigenetics. 2013;8:1355–1372. doi: 10.4161/epi.26701. - DOI - PMC - PubMed
Publication types
MeSH terms
Substances
Grants and funding
LinkOut - more resources
Full Text Sources
Research Materials
Miscellaneous
