. 2020 Oct 20;3(12):e202000827.
doi: 10.26508/lsa.202000827. Print 2020 Dec.

Incipient sympatric speciation in wild barley caused by geological-edaphic divergence

Affiliations

Incipient sympatric speciation in wild barley caused by geological-edaphic divergence

Kexin Li et al. Life Sci Alliance. .

Abstract

Sympatric speciation (SS) has been contentious since the idea was suggested by Darwin. Here, we show in wild barley SS due to geologic and edaphic divergence in "Evolution Plateau," Upper Galilee, Israel. Our whole genome resequencing data showed SS separating between the progenitor old Senonian chalk and abutting derivative young Pleistocene basalt wild barley populations. The basalt wild barley species unfolds larger effective population size, lower recombination rates, and larger genetic diversity. Both species populations show similar descending trend ∼200,000 yr ago associated with the last glacial maximum. Coalescent demography analysis indicates that SS was local, primary, in situ, and not due to a secondary contact from ex situ allopatric population. Adaptive divergent putatively selected genes were identified in both populations. Remarkably, disease resistant genes were selected in the wet basalt population, and genes related to flowering time, leading to temporal reproductive isolation, were selected in the chalk population. The evidence substantiates adaptive ecological SS in wild barley, highlighting the genome landscape during SS with gene flow, due to geologic-edaphic divergence.


Conflict of interest statement

The authors declare that they have no conflict of interest.

Figures

Figure 1.
Figure 1.. Ecological and genetic differentiation of wild barley, Hordeum spontaneum, populations from chalk and abutting basalt soils from Evolution Plateau, eastern Upper Galilee, Israel.
(A) Geological map of eastern Upper Galilee (Levitte, 2001). Red denotes the Pleistocene volcanic basalt abutting with the Senonian chalk denoted by yellow. (B) The green spiking wild barley before maturation appears at the lower right. Vegetation differentiation of chalk, covered by thick perennial bushlets of S. spinosum, and separated sharply from the abutting basalt soil, are revealed by brown mounds of subterranean blind mole rats. Perennial plants include Dactylis glomeratta, and Acanthus syriaca, plus annuals including several species of Trifolium (see details in Fig S5 [Hadid et al, 2013]). Plants were identified by Ori Fragman-Sapir. (C) Neighbor-joining tree of wild barley from Basalt (13 individuals, marked in red) and abutting Chalk (11 individuals, marked in blue). (D) Principal component analysis of the two soil wild barley populations, basalt population was marked by red triangles, whereas the chalk population was marked by blue triangles. (E) Population genetic structure of wild barley from chalk and basalt soil populations, and genetic cluster (k) was set from two to seven, respectively. Color stands for different ancestry constitute.
Figure S1.
Figure S1.
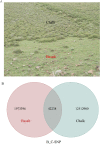
Sample sites and SNPs of the two populations. (A, B) Habitat of study site and (B) shared and unique SNPs to chalk and basalt wild barley populations.
Figure S2.
Figure S2.. Neighbor-joining tree based on the SNPs from coding and noncoding genomic regions.
Numbers indicate the genotypes studied in each soil population.
Figure S3.
Figure S3.. SNP and In/Del density of both chalk and basalt populations across each chromosome.
The circle from outer to inner side is chromosome, SNP density of basalt, chalk population, indel density of basalt and chalk population.
Figure 2.
Figure 2.. Wild barley populations diversity and differentiation.
(A) Distribution of Tajima’s D from both chalk (in blue) and abutting basalt (in red) wild barley populations. (B) Linkage disequilibria of chalk (in blue) and abutting basalt (in red) wild barley populations. (C). Nucleotide diversity (θπ) of chalk and abutting basalt populations. (B, C) denotes π of basalt population in red and (C) is chalk population in blue. (D) Genomic differentiation, measured by FST, across each chromosome, y-axis denotes FST and Chr1∼7H and ChrUn on x-axis denotes seven chromosomes and the unknown areas.
Figure 3.
Figure 3.. Population demography of wild barley populations.
(A) Fluctuation of effective population size of wild barley from chalk and its derivative abutting basalt soil population inferred from SMC++ model. Individuals from basalt population were marked in red and those from chalk were marked in blue, x-axis denotes time, and y-axis denotes effective population size. The two populations show the same declining trend from about 200,000 yr ago, till about 4,000 yr ago. (B) Population differentiation of copy number variation from chalk and abutting basalt wild barley populations separated by the first and second principal component. (C) Principal component analysis of copy number variation of chalk and basalt wild barley populations, totally separate into two clusters by PC2 and PC3.
Figure 4.
Figure 4.. Coalescence analysis of population demography in wild barley from chalk and derivative basalt.
(A) Four tested probable divergence models. Model 1: speciation without gene flow; Model 2: speciation with recent gene flow following secondary contact; Model 3: speciation with initial gene flow and Model 4: speciation with two distinct periods of higher gene flow at the beginning and lower gene flow recently. (B) Parameter estimates for the best fit model of decreasing migration between the chalk and derivative basalt dwelling populations. Notably, the two incipient sympatric species showed phenotypic differences as was shown above. Ne stands for effective population size, and divergence time was marked on the left side by an arrow.
Figure S4.
Figure S4.. Selective sweep signals on genome regions in chalk and basalt populations.
Distribution of log2basaltchalk) and FST of 100-kb windows with 10-kbp steps. Selected regions were marked in red, where log2basaltchalk) > 0.59, and FST > 0.25.
Figure S5.
Figure S5.. The length of copy number variation (CNV) and distribution between the two wild barley populations.
(A) Length of CNV of chalk and basalt wild barley populations, the length in basalt population is longer than that in chalk population. (B) Population-specific and shared CNV of chalk and abutting basalt populations. (B) Short for basalt duplication denotes duplication from basalt population and (C) short for chalk denotes deletion standing for deletion from chalk population.
Figure S6.
Figure S6.. Distribution of copy number variation. (A, B) CNVs from different genomic regions of basalt population and (B) CNVs of wild barley from the abutting chalk population.
Figure S7.
Figure S7.. Population differentiation of copy number variation (CNV) from chalk and abutting basalt wild barley populations.
(A) Principal component analysis, PCA, of CNV of chalk and basalt wild barley populations. (B) Hierarchical tree of the CNVs of chalk and basalt wild barley populations.
Figure S8.
Figure S8.. Four evolution canyons in Israel.
Figure S9.
Figure S9.. Evolution Canyon (EC) model and model organisms.
(A) Schematic diagram of EC. (B) Seven stations were on the two slopes of EC. (C) Air view of EC. (D) Airview of Evolution Canyon model. (E) Five model organisms from ECI showing sympatric speciation.

References

    1. Abyzov A, Urban AE, Snyder M, Gerstein M (2011) CNVnator: An approach to discover, genotype, and characterize typical and atypical CNVs from family and population genome sequencing. Genome Res 21: 974–984. 10.1101/gr.114876.110 - DOI - PMC - PubMed
    1. Axelsson E, Ratnakumar A, Arendt ML, Maqbool K, Webster MT, Perloski M, Liberg O, Arnemo JM, Hedhammar A, Lindbladtoh K (2013) The genomic signature of dog domestication reveals adaptation to a starch-rich diet. Nature 495: 360 10.1038/nature11837 - DOI - PubMed
    1. Bolnick DI, Fitzpatrick BM (2007) Sympatric speciation: Models and empirical evidence. Annu Rev Ecol Evol Syst 38: 459–487. 10.1146/annurev.ecolsys.38.091206.095804 - DOI
    1. Brown A, Nevo E, Zohary D, Dagan O (1978) Genetic variation in natural populations of wild barley (Hordeum spontaneum). Genetica 49: 97–108. 10.1007/bf00120555 - DOI
    1. Bu Q, Zhu L, Dennis MD, Yu L, Lu SX, Person MD, Tobin EM, Browning KS, Huq E (2011) Phosphorylation by CK2 enhances the rapid light-induced degradation of phytochrome interacting factor 1 in Arabidopsis. J Biol Chem 286: 12066–12074. 10.1074/jbc.m110.186882 - DOI - PMC - PubMed

LinkOut - more resources