Case Reports
. 2020 Nov 10;117(45):28336-28343.
doi: 10.1073/pnas.2018030117. Epub 2020 Oct 20.

Transcriptional and proteomic insights into the host response in fatal COVID-19 cases

Affiliations
Case Reports

Transcriptional and proteomic insights into the host response in fatal COVID-19 cases

Meng Wu et al. Proc Natl Acad Sci U S A. .

Abstract

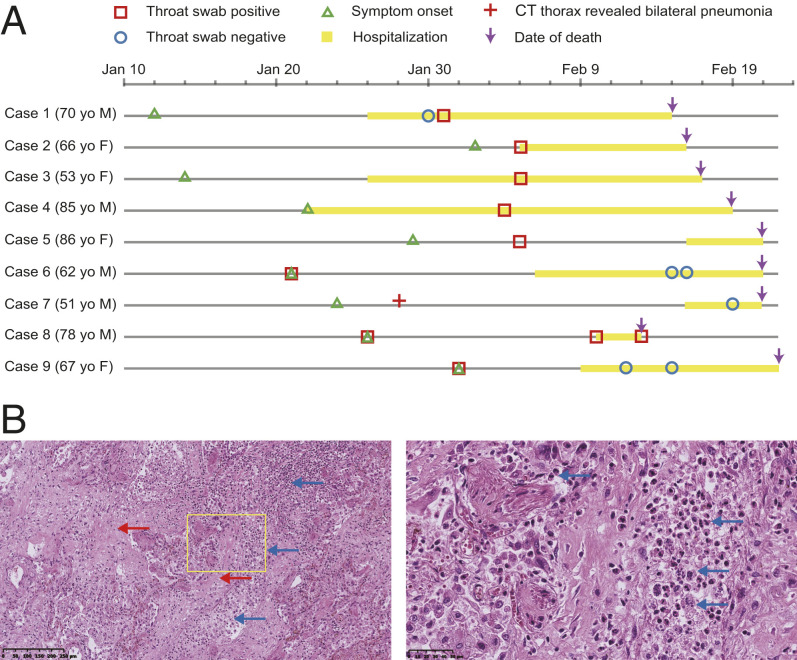
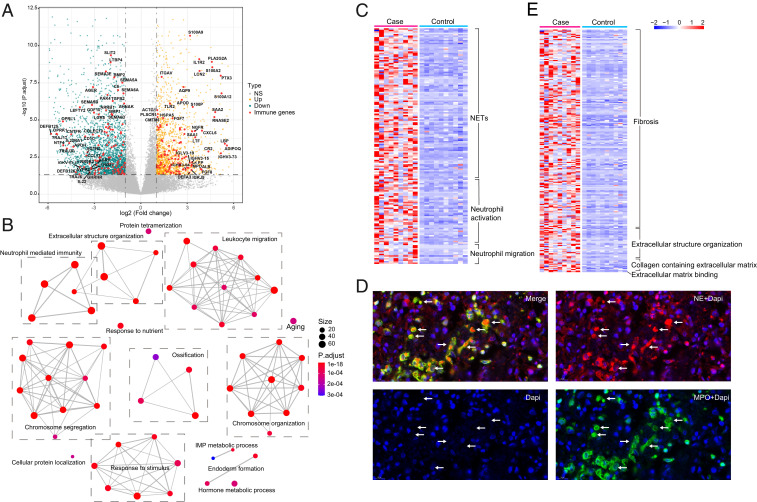
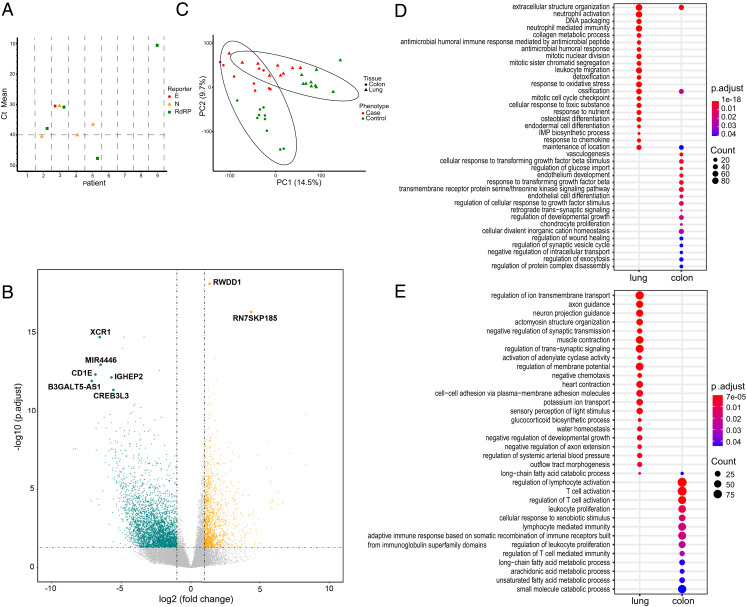
Coronavirus disease 2019 (COVID-19), the global pandemic caused by SARS-CoV-2, has resulted thus far in greater than 933,000 deaths worldwide; yet disease pathogenesis remains unclear. Clinical and immunological features of patients with COVID-19 have highlighted a potential role for changes in immune activity in regulating disease severity. However, little is known about the responses in human lung tissue, the primary site of infection. Here we show that pathways related to neutrophil activation and pulmonary fibrosis are among the major up-regulated transcriptional signatures in lung tissue obtained from patients who died of COVID-19 in Wuhan, China. Strikingly, the viral burden was low in all samples, which suggests that the patient deaths may be related to the host response rather than an active fulminant infection. Examination of the colonic transcriptome of these patients suggested that SARS-CoV-2 impacted host responses even at a site with no obvious pathogenesis. Further proteomics analysis validated our transcriptome findings and identified several key proteins, such as the SARS-CoV-2 entry-associated protease cathepsins B and L and the inflammatory response modulator S100A8/A9, that are highly expressed in fatal cases, revealing potential drug targets for COVID-19.

Keywords: COVID-19; NETosis; SARS-CoV-2; fibrosis; neutrophil.


Conflict of interest statement

The authors declare no competing interest.

Figures

Fig. 1.
Fig. 1.
An overview of the patient cohort from Wuhan, China. (A) Schematic highlighting a timeline of illness onset, SARS-CoV-2 RNA detection, hospitalization, and death for the cases. Patients are aligned by the calendar dates indicated at the Top of the schematic. The age and sex of each patient are also listed. (B) Representative hematoxylin and eosin-stained lung tissue section. Areas of fibrosis (red arrows) and infiltration by neutrophils and macrophages (blue arrows) are highlighted. The image on the Right represents a magnified view of the area highlighted by the yellow box.
Fig. 2.
Fig. 2.
Transcriptional profiling reveals enrichment of neutrophil and lung fibrosis gene pathways. (A) Volcano plot (P value vs. fold change) comparing gene expression in cases vs. controls. Up- (orange) and down-regulated genes (cyan) are highlighted, and immune-related genes that are differentially expressed are named. The horizontal dashed line represents an adjusted P value of 0.05 (Wald test in DESeq2, multiple test correction by Benjamini–Hochberg [BH]), and the vertical dashed lines represent log2FC of −1 and 1. (B) GO network analysis of the top 60 enriched GO terms in the up-regulated genes (Fisher’s exact test using enrichGO function in R package clusterProfiler, multiple test correction by BH). (C) Heatmap of the up-regulated DEGs (Wald test in DESeq2, multiple test correction by BH) involved in the GO network module neutrophil-mediated immunity. (D) Immunofluorescence microscopy of lung section stained with DAPI (blue) and antibodies against myeloperoxidase (green) and neutrophil elastase (red). Areas of NETosis are highlighted with arrows. (E) Heatmap of the up-regulated DEGs (Wald test, multiple test correction by BH) involved in the GO network module extracellular structure organization.
Fig. 3.
Fig. 3.
Transcriptional profiling reveals altered gene expression in the colon of COVID-19 deceased patients. (A) SARS-CoV-2 RT-PCR results from the RNA input for transcriptional profiling. The three genes assayed include the nucleocapsid (N), envelope (E), and RNA-dependent RNA polymerase (RdRp) genes. The dotted line indicates the threshold for detecting a gene as present. (B) Volcano plot (P value vs. fold change) comparing gene expression in cases vs. controls. Up- (orange) and down-regulated genes (cyan) are highlighted, and genes differentially expressed with |logFC| > 5 and −log10 padj > 10 (down-regulated genes) or >15 (up-regulated genes) are named. (Wald test in DESeq2, multiple test correction by BH). (C) Principal component analysis of normalized read counts for the entire transcriptome. Ellipses indicate 95% confidence interval of group membership. Percentages along the axes indicate the degree of variance explained by that principal component. (D and E) Dotplot visualization of the top 20 enriched GO terms of up-regulated (D) and down-regulated (E) DEGs in the lung and colon of COVID-19 deceased patients. The color of the dots represents the P value adjusted by Benjamini–Hochberg correction for each enriched GO term identified by Fisher’s exact test using enrichGO function in R package clusterProfiler, and the size of the dot represents the number of genes enriched in the total gene set.
Fig. 4.
Fig. 4.
Key genes in SARS-CoV-2 pathogenesis are differentially expressed in mRNA and protein levels in fatal cases. (A) Gene expression levels of ACE2, TMPRSS2, and cathepsins B and L. * adjusted P < 0.05; ** adjusted P < 0.01; *** adjusted P < 0.001. Wald test in DESeq2, multiple test correction by BH. (B and C) Volcano plot (P value vs. fold change) comparing gene expression in cases vs. controls at mRNA level (B) and protein level (C). DEGs that were identified as important in host–SARS-CoV-2 interactions are highlighted based on the study in which they were identified and as described in the text. The horizontal dashed line represents an adjusted P value of 0.05, and the vertical dashed lines represent log2 FC of −1 and 1. Wald test in DESeq2, multiple test correction by BH. (D) Protein levels of cathepsins B and L. *** adjusted P < 0.001 Student’s t test. (E) Gene expression levels of mRNA and protein of S100A8, S100A9, S100A11, S100A12, and S100P. * adjusted P < 0.05; ** adjusted P < 0.01; *** adjusted P < 0.001; ns, not significant. Gene expression of mRNA was analyzed by Wald test in DESeq2. Protein levels were analyzed by Student’s t test.

Comment in

References

    1. Zhu N. et al.; China Novel Coronavirus Investigating and Research Team , A novel coronavirus from patients with pneumonia in China, 2019. N. Engl. J. Med. 382, 727–733 (2020). - PMC - PubMed
    1. Blanco-Melo D., et al. , Imbalanced host response to SARS-CoV-2 drives development of COVID-19. Cell 181, 1036–1045.e9 (2020). - PMC - PubMed
    1. Sun J., et al. , Generation of a broadly useful model for COVID-19 pathogenesis, vaccination, and treatment. Cells 182, 734–743.e5 (2020). - PMC - PubMed
    1. Wilk A. J., et al. , A single-cell atlas of the peripheral immune response in patients with severe COVID-19. Nat. Med. 26, 1070–1076 (2020). - PMC - PubMed
    1. Butler D. J., et al. , Shotgun transcriptome and isothermal profiling of SARS-CoV-2 infection reveals unique host responses, viral diversification, and drug interactions bioRxiv:2020.04.20.048066 (1 May 2020). - PMC - PubMed

Publication types