. 2020 Nov 10;117(45):27934-27939.
doi: 10.1073/pnas.2014279117. Epub 2020 Oct 20.

Initial economic damage from the COVID-19 pandemic in the United States is more widespread across ages and geographies than initial mortality impacts

Affiliations

Initial economic damage from the COVID-19 pandemic in the United States is more widespread across ages and geographies than initial mortality impacts

Maria Polyakova et al. Proc Natl Acad Sci U S A. .

Abstract

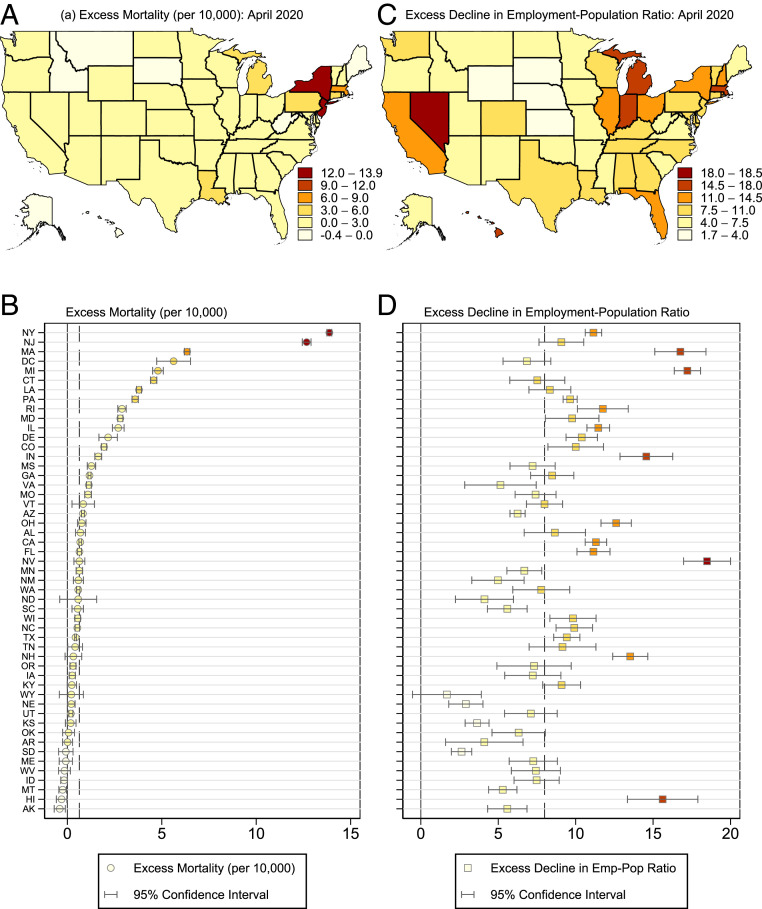
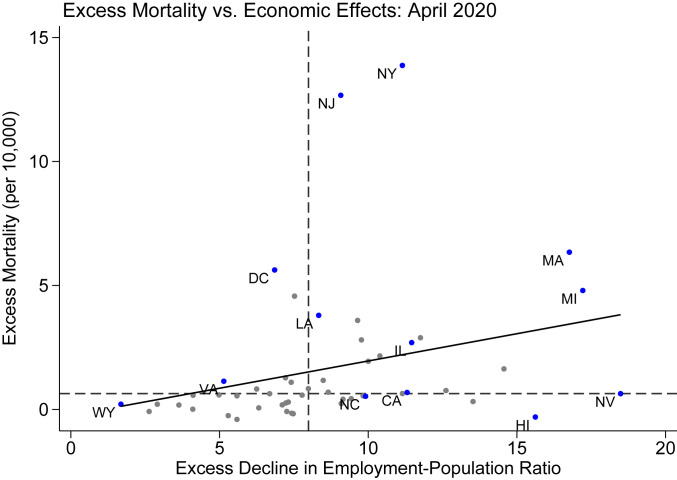
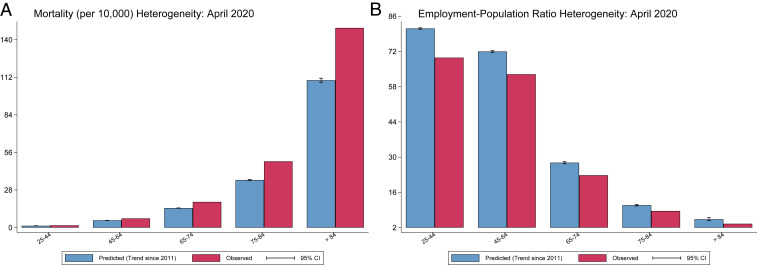
The economic and mortality impacts of the COVID-19 pandemic have been widely discussed, but there is limited evidence on their relationship across demographic and geographic groups. We use publicly available monthly data from January 2011 through April 2020 on all-cause death counts from the Centers for Disease Control and Prevention and employment from the Current Population Survey to estimate excess all-cause mortality and employment displacement in April 2020 in the United States. We report results nationally and separately by state and by age group. Nationally, excess all-cause mortality was 2.4 per 10,000 individuals (about 30% higher than reported COVID deaths in April) and employment displacement was 9.9 per 100 individuals. Across age groups 25 y and older, excess mortality was negatively correlated with economic damage; excess mortality was largest among the oldest (individuals 85 y and over: 39.0 per 10,000), while employment displacement was largest among the youngest (individuals 25 to 44 y: 11.6 per 100 individuals). Across states, employment displacement was positively correlated with excess mortality (correlation = 0.29). However, mortality was highly concentrated geographically, with the top two states (New York and New Jersey) each experiencing over 10 excess deaths per 10,000 and accounting for about half of national excess mortality. By contrast, employment displacement was more geographically spread, with the states with the largest point estimates (Nevada and Michigan) each experiencing over 16 percentage points employment displacement but accounting for only 7% of the national displacement. These results suggest that policy responses may differentially affect generations and geographies.

Keywords: COVID-19; economic damages; excess all-cause mortality.


Conflict of interest statement

The authors declare no competing interest.

Figures

Fig. 1.
Fig. 1.
Time series of mortality and economic outcomes. These figures show time series for the monthly mortality rate per 10,000 (A and B) and employment–population ratio (C and D). A and C show the time series of the indicated variable in April of each year. B and D compare predicted outcomes to the point estimates for observed outcomes for each variable in 2020; predictions for each variable are calculated using a linear time trend with month fixed effects during the preperiod 2011 to 2019. Mortality data use CDC weighted death count. Mortality data include individuals of any age while economic data include individuals 16 y and older. Heteroskedasticity-robust SEs for calculating confidence intervals within each month are computed with clustering by year.
Fig. 2.
Fig. 2.
Geographic heterogeneity in outcomes by state: April 2020. These figures show deviations from expected (A and C) mortality and (B and D) employment–population ratios within each state in April 2020. For dot plots in C and D, states are ordered in descending order of their excess mortality. Dotted lines show the median of each outcome across states in April 2020. CPS data include all individuals 16 y and older and CDC data include all individuals of any age. Mortality data use CDC weighted death count estimates. Predicted values are calculated using a linear time trend with month fixed effects with preperiod 2011 to 2019. Annual population counts to calculate mortality come from the Census Bureau in each state from 2011 to 2019. Heteroskedasticity-robust SEs to construct 95% confidence intervals are computed with clustering by year.
Fig. 3.
Fig. 3.
Excess mortality and economic damage comparison by state. This figure compares excess mortality and the economic impacts of COVID-19 in April 2020; each point is one state. Economic measures are calculated using the IPUMS CPS microdata and mortality measures are calculated using aggregate CDC data. Excess amounts are calculated by comparing observed values in April 2020 to predicted values. Predicted values are calculated using a linear time trend with month fixed effects; the preperiod is 2011 to 2019. The solid line shows the line of best fit from an unweighted regression. Dashed lines show the median value of excess mortality and the excess decline in employment–population ratio.
Fig. 4.
Fig. 4.
Predicted vs. observed outcomes by age group. These figures compare predicted and observed (A) mortality per 10,000 and (B) employment–population ratio, both in April 2020, for the age groups for which the CDC publishes recent weekly death counts, using point estimates for observed outcomes. The employment–population ratio is calculated using the IPUMS CPS microdata and mortality measures are calculated using aggregate CDC data by age group. Predicted values for each outcome are calculated using a linear time trend with month fixed effects; the preperiod is from 2011 to 2019. Heteroskedasticity-robust SEs to construct 95% confidence intervals are computed with clustering by year.

References

    1. CDC , Weekly updates by select demographic and geographic characteristics. https://www.cdc.gov/nchs/nvss/vsrr/covid_weekly/index.htm. Accessed 3 August 2020.
    1. CDC COVID-19 Response Team , Geographic differences in COVID-19 cases, deaths, and incidence–United States, February 12-April 7, 2020. MMWR Morb. Mortal. Wkly. Rep. 69, 465–471 (2020). - PMC - PubMed
    1. Woolf S. H., Chapman D. A., Sabo R. T., Weinberger D. M., Hill L., Excess deaths from COVID-19 and other causes, March-April 2020. JAMA 324, 510–513 (2020). - PMC - PubMed
    1. Weinberger D. M., et al. , Estimation of excess deaths associated with the COVID-19 pandemic in the United States, March to May 2020. JAMA Intern Med, e203391 (2020). - PMC - PubMed
    1. Katz J., Lu D., Sanger-Katz M., Tracking the real coronavirus death toll in the United States. NY Times, 23 September 2020. https://www.nytimes.com/interactive/2020/05/05/us/coronavirus-death-toll.... Accessed 3 August 2020.

Publication types