

Immune Response and Microbiota Profiles during Coinfection with Plasmodium vivax and Soil-Transmitted Helminths
- PMID: 33082257
- PMCID: PMC7587435
- DOI: 10.1128/mBio.01705-20
Immune Response and Microbiota Profiles during Coinfection with Plasmodium vivax and Soil-Transmitted Helminths
Abstract
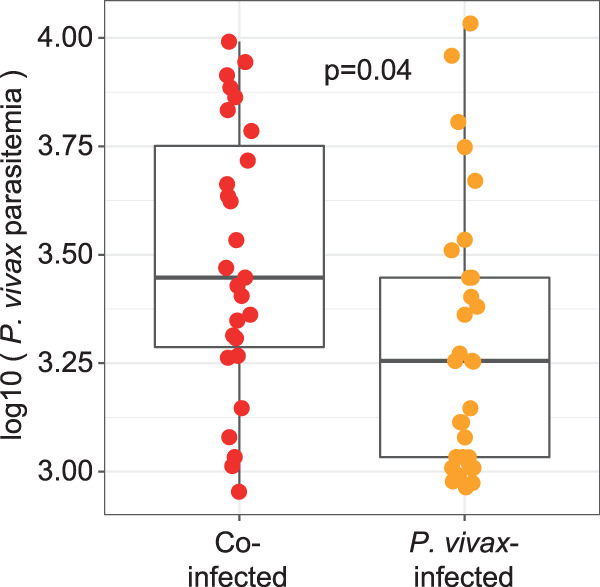
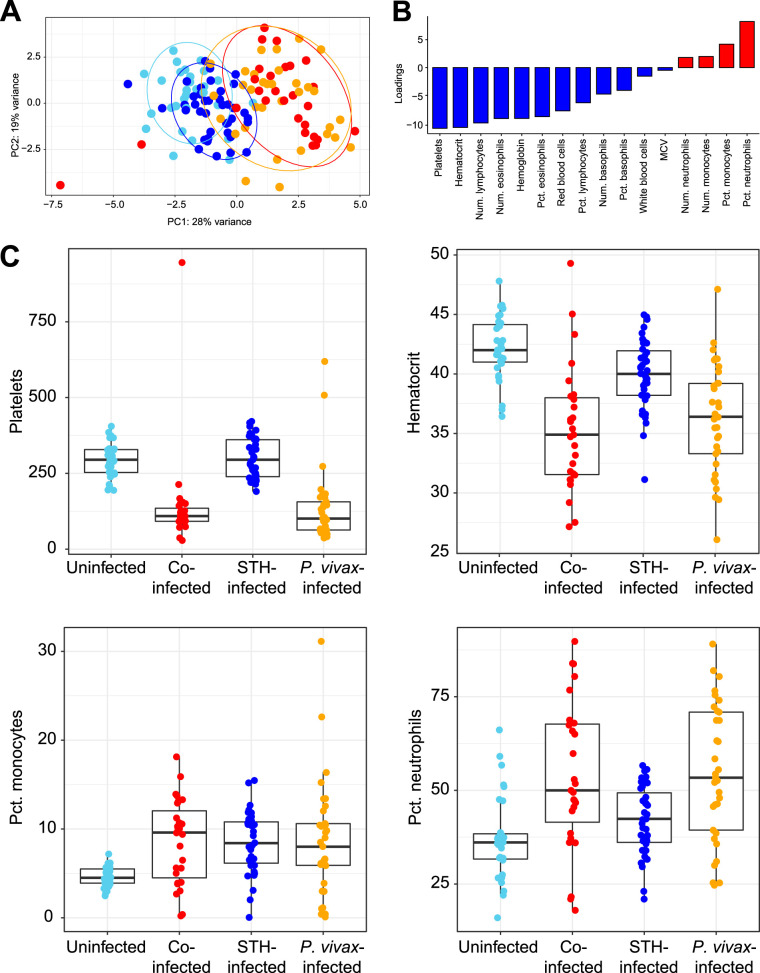
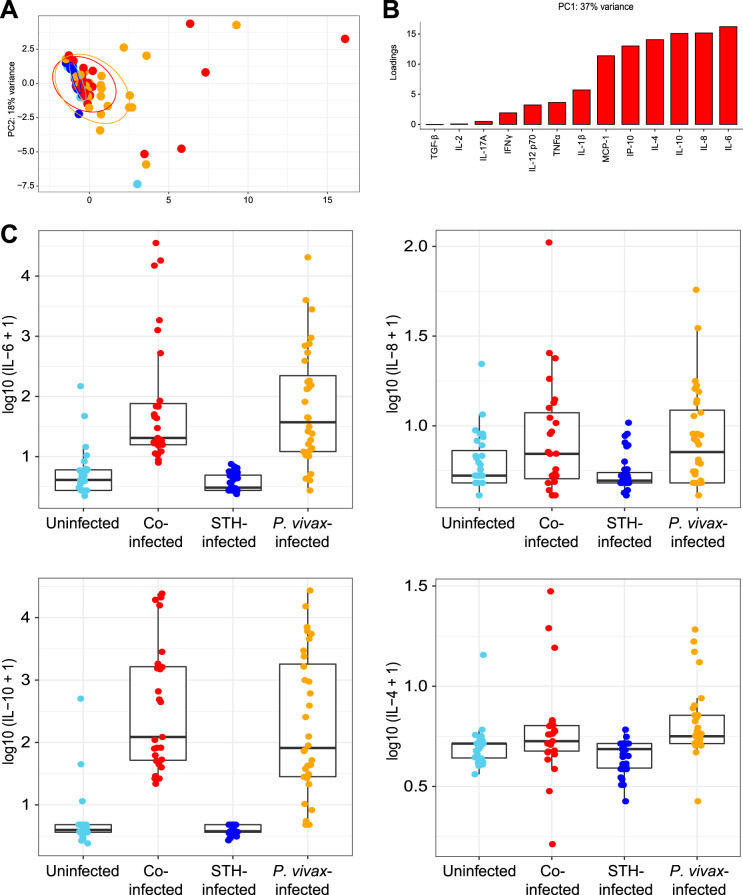
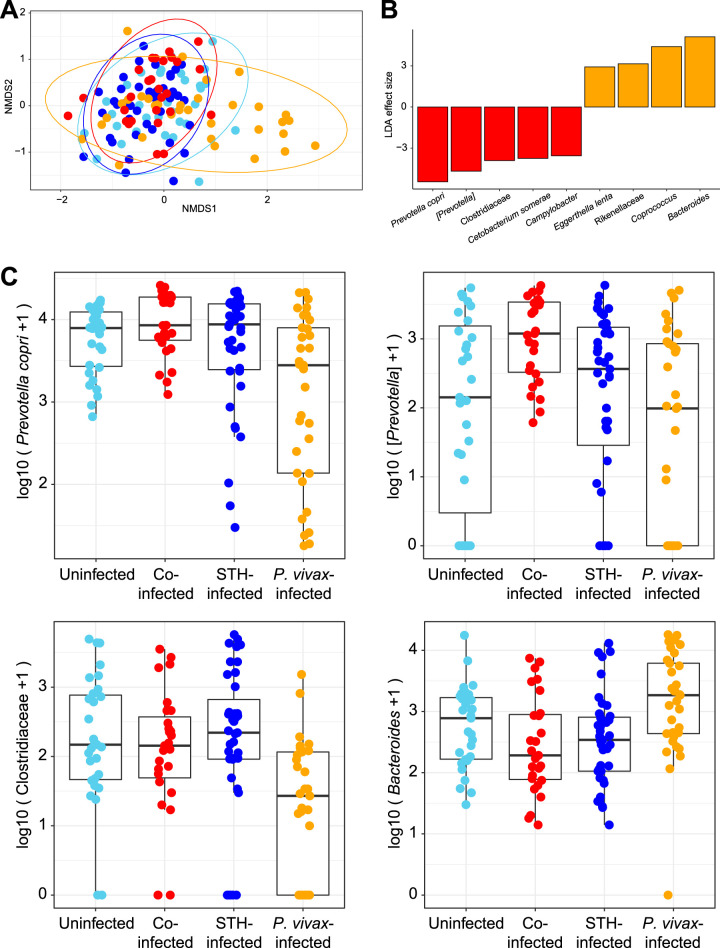
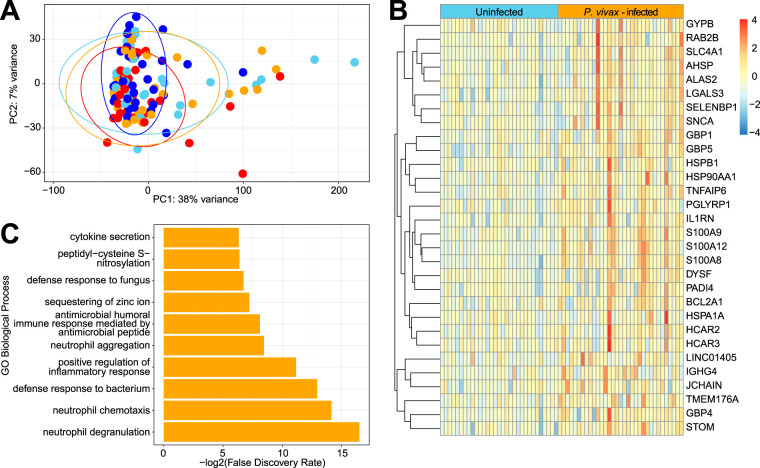
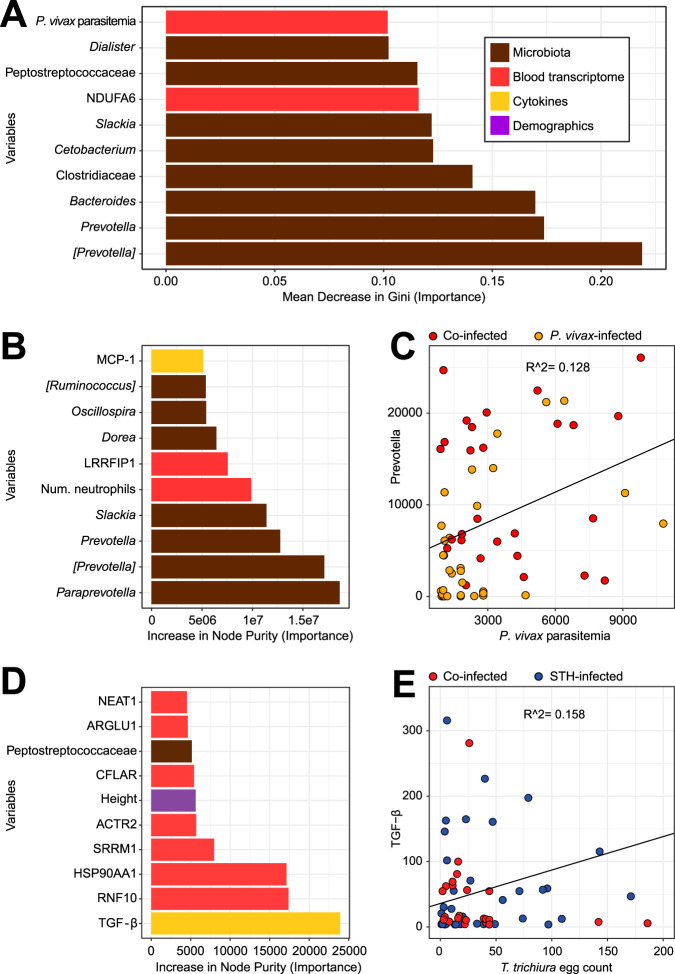
The role of the gut microbiota during coinfection with soil-transmitted helminths (STH) and Plasmodium spp. is poorly understood. We examined peripheral blood and fecal samples from 130 individuals who were either infected with Plasmodium vivax only, coinfected with P. vivax and STH, infected with STH alone, or not infected with either P. vivax or STH. In addition to a complete blood count (CBC) with differential, transcriptional profiling of peripheral blood samples was performed by transcriptome sequencing (RNA-Seq), fecal microbial communities were determined by 16S rRNA gene sequencing, and circulating cytokine levels were measured by bead-based immunoassays. Differences in blood cell counts, including an increased percentage of neutrophils, associated with a transcriptional signature of neutrophil activation, were driven primarily by P. vivax infection. P. vivax infection was also associated with increased levels of interleukin 6 (IL-6), IL-8, and IL-10; these cytokine levels were not affected by STH coinfection. Surprisingly, P. vivax infection was more strongly associated with differences in the microbiota than STH infection. Children infected with only P. vivax exhibited elevated Bacteroides and reduced Prevotella and Clostridiaceae levels, but these differences were not observed in individuals coinfected with STH. We also observed that P. vivax parasitemia was higher in the STH-infected population. When we used machine learning to identify the most important predictors of the P. vivax parasite burden (among P. vivax-infected individuals), bacterial taxa were the strongest predictors of parasitemia. In contrast, circulating transforming growth factor β (TGF-β) was the strongest predictor of the Trichuris trichiura egg burden. This study provides unexpected evidence that the gut microbiota may have a stronger link with P. vivax than with STH infection.IMPORTANCEPlasmodium (malaria) and helminth parasite coinfections are frequent, and both infections can be affected by the host gut microbiota. However, the relationship between coinfection and the gut microbiota is unclear. By performing comprehensive analyses on blood/stool samples from 130 individuals in Colombia, we found that the gut microbiota may have a stronger relationship with the number of P. vivax (malaria) parasites than with the number of helminth parasites infecting a host. Microbiota analysis identified more predictors of the P. vivax parasite burden, whereas analysis of blood samples identified predictors of the helminth parasite burden. These results were unexpected, because we expected each parasite to be associated with greater differences in its biological niche (blood for P. vivax and the intestine for helminths). Instead, we find that bacterial taxa were the strongest predictors of P. vivax parasitemia levels, while circulating TGF-β levels were the strongest predictor of helminth parasite burdens.
Keywords: Colombia; Plasmodium vivax; STH; Trichuris trichiura; malaria; microbiota; soil-transmitted helminths.
Figures
Similar articles
-
Plasmodium falciparum and Helminth Coinfections Increase IgE and Parasite-Specific IgG Responses.Microbiol Spectr. 2021 Dec 22;9(3):e0110921. doi: 10.1128/Spectrum.01109-21. Epub 2021 Dec 8. Microbiol Spectr. 2021. PMID: 34878303 Free PMC article.
-
Evidence of Submicroscopic Malaria Parasitemia, Soil-Transmitted Helminths, and Their Coinfections Among Forest-Fringed Orang Asli Communities in Peninsular Malaysia.Am J Trop Med Hyg. 2025 Apr 8;112(6):1391-1399. doi: 10.4269/ajtmh.24-0718. Print 2025 Jun 4. Am J Trop Med Hyg. 2025. PMID: 40199271 Free PMC article.
-
Differential human gut microbiome assemblages during soil-transmitted helminth infections in Indonesia and Liberia.Microbiome. 2018 Feb 28;6(1):33. doi: 10.1186/s40168-018-0416-5. Microbiome. 2018. PMID: 29486796 Free PMC article. Clinical Trial.
-
Helminth-Induced Human Gastrointestinal Dysbiosis: a Systematic Review and Meta-Analysis Reveals Insights into Altered Taxon Diversity and Microbial Gradient Collapse.mBio. 2021 Dec 21;12(6):e0289021. doi: 10.1128/mBio.02890-21. Epub 2021 Dec 21. mBio. 2021. PMID: 34933444 Free PMC article.
-
Malaria and helminth co-infections in children living in endemic countries: A systematic review with meta-analysis.PLoS Negl Trop Dis. 2021 Feb 18;15(2):e0009138. doi: 10.1371/journal.pntd.0009138. eCollection 2021 Feb. PLoS Negl Trop Dis. 2021. PMID: 33600494 Free PMC article.
Cited by
-
Mechanistic insights into the interaction between the host gut microbiome and malaria.PLoS Pathog. 2023 Oct 12;19(10):e1011665. doi: 10.1371/journal.ppat.1011665. eCollection 2023 Oct. PLoS Pathog. 2023. PMID: 37824458 Free PMC article. Review.
-
Host Transcriptional Meta-signatures Reveal Diagnostic Biomarkers for Plasmodium falciparum Malaria.J Infect Dis. 2024 Aug 16;230(2):e474-e485. doi: 10.1093/infdis/jiae041. J Infect Dis. 2024. PMID: 38271704 Free PMC article.
-
Lentinan -triggered butyrate-producing bacteria drive the expulsion of the intestinal helminth Trichinella spiralis in mice.Front Immunol. 2022 Jul 28;13:926765. doi: 10.3389/fimmu.2022.926765. eCollection 2022. Front Immunol. 2022. PMID: 35967395 Free PMC article.
-
Gut Bacteroides act in a microbial consortium to cause susceptibility to severe malaria.Nat Commun. 2023 Oct 13;14(1):6465. doi: 10.1038/s41467-023-42235-0. Nat Commun. 2023. PMID: 37833304 Free PMC article.
-
Effective Laboratory Diagnosis of Parasitic Infections of the Gastrointestinal Tract: Where, When, How, and What Should We Look For?Diagnostics (Basel). 2024 Sep 27;14(19):2148. doi: 10.3390/diagnostics14192148. Diagnostics (Basel). 2024. PMID: 39410552 Free PMC article. Review.
References
Publication types
MeSH terms
Substances
Grants and funding
LinkOut - more resources
Full Text Sources
Molecular Biology Databases
Miscellaneous
