. 2020 Oct 20;13(654):eaaw3122.
doi: 10.1126/scisignal.aaw3122.

Interclass GPCR heteromerization affects localization and trafficking

Affiliations

Interclass GPCR heteromerization affects localization and trafficking

Rudy Toneatti et al. Sci Signal. .

Abstract

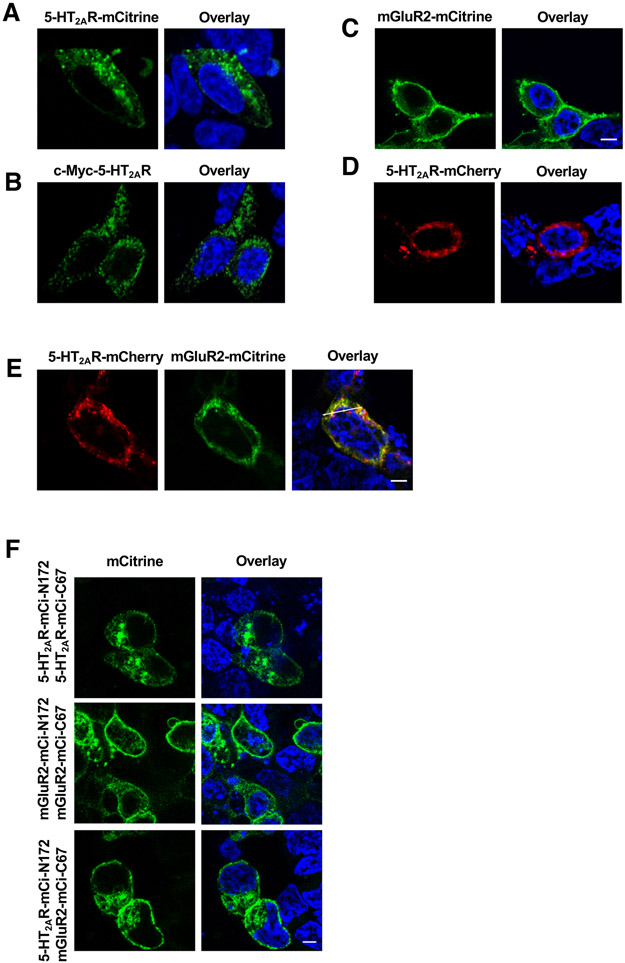
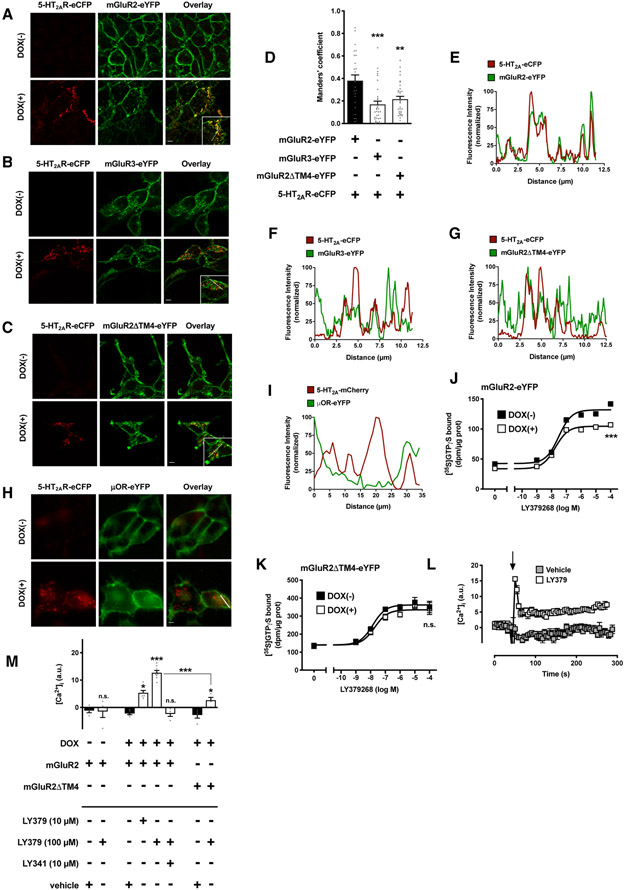
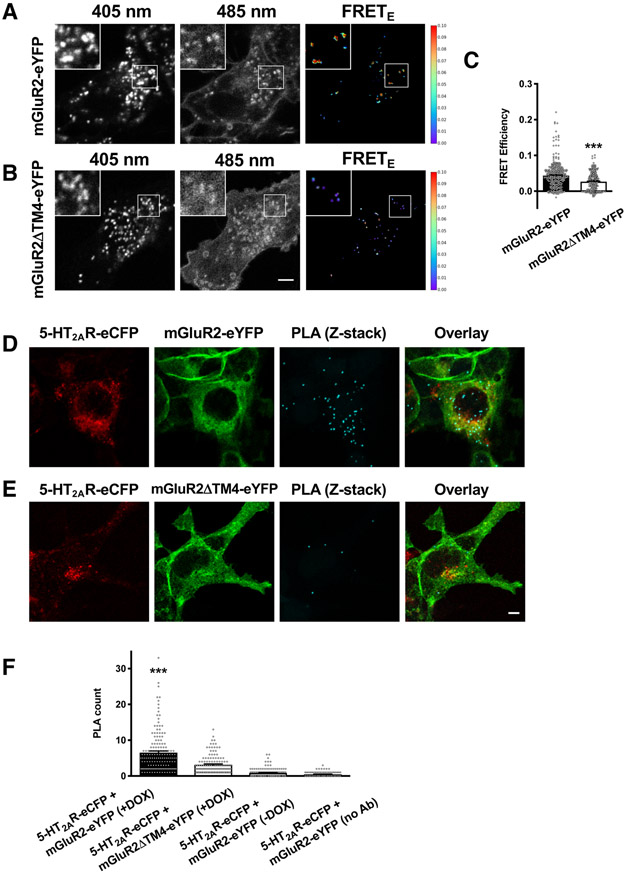
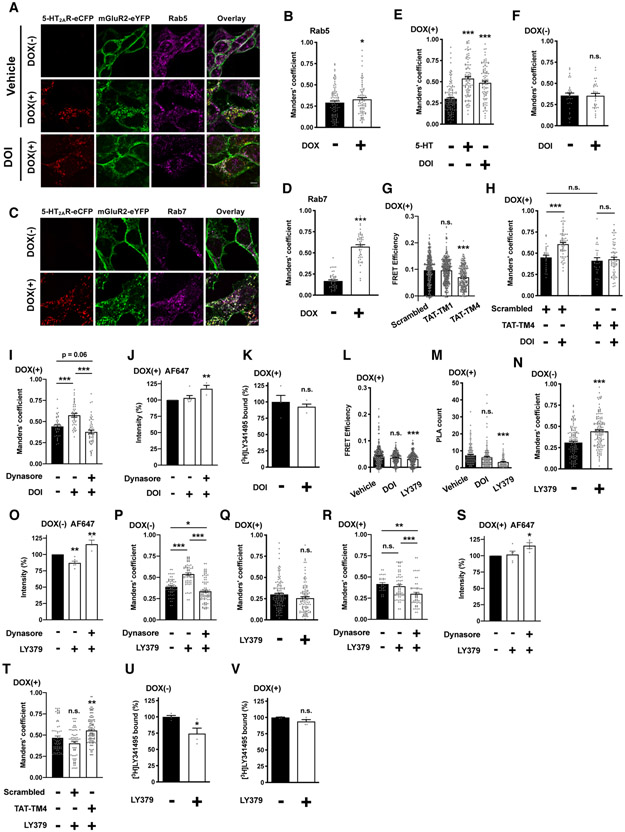
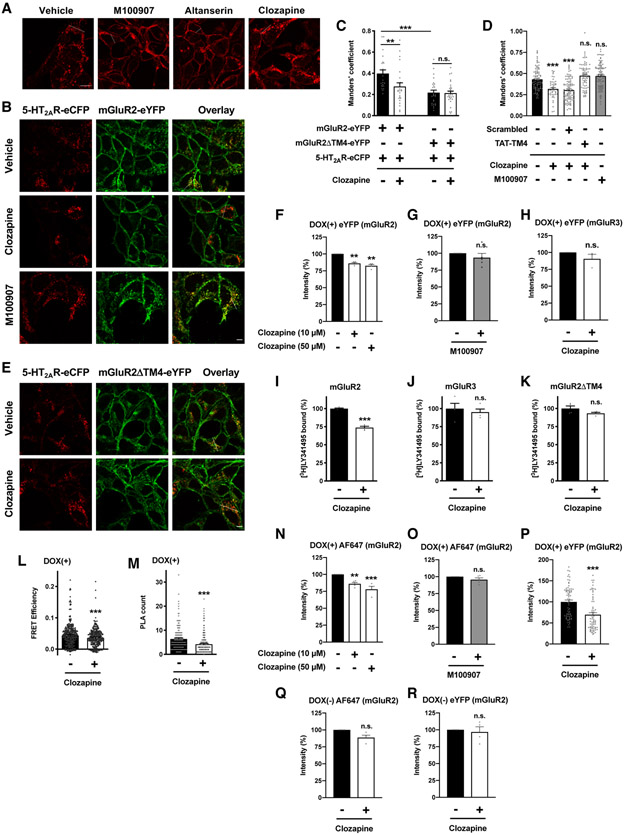
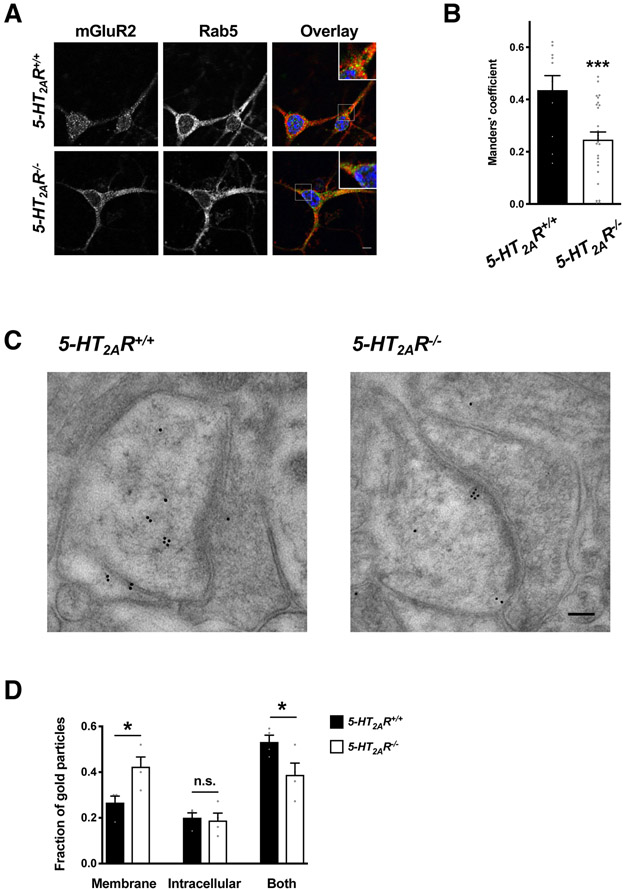
Membrane trafficking processes regulate G protein-coupled receptor (GPCR) activity. Although class A GPCRs are capable of activating G proteins in a monomeric form, they can also potentially assemble into functional GPCR heteromers. Here, we showed that the class A serotonin 5-HT2A receptors (5-HT2ARs) affected the localization and trafficking of class C metabotropic glutamate receptor 2 (mGluR2) through a mechanism that required their assembly as heteromers in mammalian cells. In the absence of agonists, 5-HT2AR was primarily localized within intracellular compartments, and coexpression of 5-HT2AR with mGluR2 increased the intracellular distribution of the otherwise plasma membrane-localized mGluR2. Agonists for either 5-HT2AR or mGluR2 differentially affected trafficking through Rab5-positive endosomes in cells expressing each component of the 5-HT2AR-mGluR2 heterocomplex alone, or together. In addition, overnight pharmacological 5-HT2AR blockade with clozapine, but not with M100907, decreased mGluR2 density through a mechanism that involved heteromerization between 5-HT2AR and mGluR2. Using TAT-tagged peptides and chimeric constructs that are unable to form the interclass 5-HT2AR-mGluR2 complex, we demonstrated that heteromerization was necessary for the 5-HT2AR-dependent effects on mGluR2 subcellular distribution. The expression of 5-HT2AR also augmented intracellular localization of mGluR2 in mouse frontal cortex pyramidal neurons. Together, our data suggest that GPCR heteromerization may itself represent a mechanism of receptor trafficking and sorting.


Figures

Fig. 1.
Fig. 1.. 5-HT2AR affects localization of mGluR2.
(A and B) Representative confocal micrographs of HEK293 cells transfected to express 5-HT2AR-mCitrine (A) or c-Myc-5-HT2AR (B). Nonpermeabilized cells were imaged to detect mCitrine (A), whereas permeabilized cells were stained with anti-c-Myc and secondary antibody, and imaged to detect anti-c-Myc (B). (C to E) HEK293 cells were transfected to express mGluR2-mCitrine alone (C), 5-HT2AR-mCherry alone (D), or 5-HT2AR-mCherry and mGluR2-mCitrine (E; for the corresponding line scan, see fig. S1A). (F) BiFC signal in HEK293 cells transfected to coexpress 5-HT2AR-mCi-N172 and 5-HT2AR-mCi-C67, 5-HT2AR-mCi-N172 and mGluR2-mCi-C67, or 5-HT2AR-mCi-N172 and mGluR2-mCi-C67. Nuclei were stained in blue with Hoechst. Scale bars, 5 μm.
Fig. 2.
Fig. 2.. Effect of 5-HT2AR on localization of mGluR2 requires heteromerization.
(A to I) Flp-In T-REx HEK293 cells stably expressing mGluR2-eYFP (A, D and E), mGluR3-eYFP (B, D and F), mGluR2ΔTM4-eYFP (C, D and G), or μOR-eYFP (H and I) and harboring 5-HT2AR-eCFP at the inducible locus were left untreated [DOX(−)] or treated with doxycycline [DOX(+)]. Representative confocal micrographs (A to C and H) and corresponding line scans (E to I). (D) Manders’ coefficient colocalization analysis of eYFP- and eCFP-tagged constructs (n = 25 – 33 cell regions of interest in three independent experiments). (J a vvnd K) Effect of the mGluR2/3 agonist LY379268 on [35S]GTPγS binding in membrane preparations of Flp-In T-REx HEK293 cells stably expressing mGluR2-eYFP (J) or mGluR2ΔTM4-eYFP (K) and harboring 5-HT2AR-eCFP at the inducible locus. Cells were left untreated [DOX(−)] or treated with doxycycline [DOX(+)] (representative results of three independent experiments performed in duplicate). (L and M) Flp-In T-REx HEK293 cells stably expressing mGluR2-eYFP or mGluR2ΔTM4-eYFP and harboring 5-HT2AR-eCFP at the inducible locus were left untreated [DOX(−)] or treated with doxycycline [DOX(+)], loaded with Fura-2 and monitored for intracellular Ca2+ concentration ([Ca2+]i) after sequential administration of LY341495 and/or LY379268, or vehicle. Representative time course of Ca2+ release. The arrowhead indicates the time when drugs were added (L). Analysis of the fold increase in intracellular calcium concentration (M; n = 4 – 8 independent experiments). Data are mean ± SEM (D and J to M). Statistical analysis was performed using the one-way (D) or two-way (M) ANOVA with Bonferroni’s post hoc test, or the F test (J and K). *P < 0.05, **P < 0.01, ***P < 0.001, n.s., not significant. Scale bars, 5 μm.
Fig. 3.
Fig. 3.. Intracellular localization of the 5-HT2AR-mGluR2 complex.
(A to C) SensorFRET analysis of Flp-In T-REx HEK293 cells stably expressing mGluR2-eYFP (A and C) or mGluR2ΔTM4-eYFP (B and C), harboring 5-HT2AR-eCFP at the inducible locus, and treated with doxycycline. Representative live-cell confocal images at 405 nm and 458 nm excitation frequencies (A and B), and quantification (C) of FRET efficiencies (n = 249 – 364 regions of interest in three independent experiments). (D to F) Flp-In T-REx HEK293 cells stably expressing mGluR2-eYFP (D and F) or mGluR2ΔTM4-eYFP (E and F) and harboring c-Myc-5-HT2AR-eCFP at the inducible locus were treated with doxycycline, permeabilized and stained with anti-rabbit antibody selective for c-Myc and anti-mouse antibody selective for mGluR2, followed by incubation with species-specific PLA probes. Representative confocal micrographs of eCFP- or eYFP-tagged constructs and PLA signal (cyan dots, Z-stack projection) (D and E). Quantification of PLA dots (F). Note that PLA signal was decreased in DOX(−) cells, or when primary antibodies were not added (n = 57 – 94 cell regions of interest demarcated according to eYFP signal within previously defined eCFP-positive cells in three independent experiments). Data are median with 95% confidence interval (C) or mean ± SEM (F). Statistical analysis was performed using Mann-Whitney U test (C) or one-way ANOVA with Bonferroni’s post hoc test (F). ***P < 0.001. Scale bars, 5 μm.
Fig. 4.
Fig. 4.. Agonist activation of either 5-HT2AR or mGluR2 differentially affects mGluR2 trafficking and downregulation.
(A to F, N and Q) Flp-In T-REx HEK293 cells stably expressing mGluR2-eYFP and harboring c-Myc-5-HT2AR-eCFP at the inducible locus were left untreated [DOX(−)] or treated with doxycycline [DOX(+)], and exposed for 60 min to serotonin (5-HT, 1 μM), DOI (1 μM) or LY379268 (10 μM), or vehicle. Cells were then permeabilized and stained with anti-Rab5 or anti-Rab7 and secondary antibody, and imaged by confocal microscopy to detect eCFP, eYFP, anti-Rab5, or anti-Rab7. Representative confocal micrographs (A and C; for the corresponding line scan, see figs. S1B to S1F), and Manders’ coefficient colocalization analysis of anti-Rab5 (B, E, F, N and Q; n = 33 – 134 cell regions of interest in three independent experiments) or anti-Rab7 (D; n = 48 – 49 cell regions of interest in three independent experiments) and eYFP-tagged construct. (G) Cells were incubated (60 min; 10 μM) with TAT-fused peptides corresponding to TM1 (TAT-TM1) or TM4 (TAT-TM4) of mGluR2, or scrambled control peptide and then processed for sensorFRET (n = 248 – 393 regions of interest in three independent experiments). (H and T) Manders’ coefficient colocalization analysis of anti-Rab5 and eYFP-tagged construct. Cells were exposed for 60 min to DOI (1 μM, H), LY379268 (10 μM, T), or vehicle. TAT-tagged peptides (10 μM) were added 5 min before drug or vehicle administration (n = 27 – 103 cell regions of interest in three independent experiments). (I, P and R) Manders’ coefficient colocalization analysis of anti-Rab5 and eYFP-tagged construct. Cells were exposed for 60 min to DOI (1 μM, I), LY379268 (10 μM, P and R), or vehicle. Dynasore (80 μM) was added 5 min before drug or vehicle administration (n = 28 – 88 cell regions of interest in three independent experiments). (J, O and S) Cell surface localization of mGluR2-eYFP assessed by flow cytometry assays with an Alexa Fluor 647 (AF647)-tagged antibody. Cells were exposed for 60 min to DOI (1 μM, J), LY379268 (10 μM, O and S), or vehicle. Dynasore (80 μM) was added 5 min before drug or vehicle administration (n = 3 – 6 independent experiments with 8508 – 10048 cells per experimental condition). (K, U and V) Density of mGluR2 shown as [3H]LY341495 binding in membrane preparations of DOX(+) (K and V) or DOX(−) (U) cells exposed for 60 min to DOI (1 μM, K), LY379268 (10 μM, U and V), or vehicle. Data are shown as percentage of specific binding in DOI- or LY379268-treated cells as compared to vehicle (n = 4 independent groups of membrane preparations). (L and M) Cells were exposed for 60 min to DOI (1 μM), LY379268 (10 μM), or vehicle. Quantification of FRET efficiencies (L, n = 281 – 536 regions of interest in three independent experiments). Quantification of PLA dots (M, n = 82 – 148 cell regions of interest demarcated according to eYFP signal within previously defined eCFP-positive cells in three independent experiments). Data are mean ± SEM (B, D to F, H to K, M to V) or median with 95% confidence interval (G and L). Statistical analysis was performed using Student’s t-test (B, D, F, K, N, Q, U, V), one-way ANOVA with Bonferroni’s post hoc test (E, I, J, M, O, P, and R to T), two-way ANOVA with Bonferroni’s post hoc test (H), or one-way non-parametric ANOVA (Kruskal-Wallis) with Dunn’s post hoc test (G, L). *P < 0.05, **P < 0.01, ***P < 0.001, n.s., not significant. Scale bars, 5 μm.
Fig. 5.
Fig. 5.. Clozapine treatment affects mGluR2 trafficking and downregulation through 5-HT2AR-mGluR2.
(A) Representative confocal micrographs of Flp-In T-REx HEK293 cells harboring 5-HT2AR-eCFP at the inducible locus were treated with doxycycline, and then exposed overnight to M100907 (10 μM), altanserin (10 μM) or clozapine (10 μM), or vehicle. (B to R) Flp-In T-REx HEK293 cells stably expressing mGluR2-eYFP (B, C, D, F, G, I, and L to R), mGluR2ΔTM4-eYFP (C, E), or mGluR3-eYFP (H, J) and harboring 5-HT2AR-eCFP at the inducible locus were treated with doxycycline and then exposed overnight to clozapine (10 μM or 50 μM) or M100907 (10 μM), or vehicle. Representative confocal micrographs (A, B, E; for the corresponding line scan, see figs. S1K to S1O). (C) Manders’ coefficient colocalization analysis of eYFP- and eCFP-tagged constructs (n = 30 – 74 cell regions of interest in three independent experiments). (D) Manders’ coefficient colocalization analysis of eYFP- and eCFP-tagged constructs in cells stably expressing mGluR2-eYFP and harboring 5-HT2AR-eCFP at the inducible locus. Cells were treated with doxycycline, and then exposed overnight to clozapine (10 μM) or M100907 (10 μM), or vehicle. TAT-tagged peptides were added both 5 minutes before clozapine or vehicle administration and 65 minutes before cell fixation (n = 44 – 98 cell regions of interest in three independent experiments). (F to H, N, O, Q, R) Cell surface localization of mGluR2-eYFP with an Alexa Fluor 647 (AF647)-tagged antibody (N, O, Q) and mGluR2-eYFP (F, G, R) or mGluR3-eYFP (H) density with eYFP were assessed by flow cytometry assays (n = 3 – 5 independent experiments with 8148 – 10418 cells per experimental condition). (I to K) Density of mGluR2 (I), mGluR3 (J) or mGluR2ΔTM4 (K) shown as [3H]LY341495 binding in membrane preparations of cells exposed overnight to clozapine (10 μM), or vehicle (n = 4 independent groups of membrane preparations). (L) Quantification of FRET efficiencies (n = 315 – 364 regions of interest in three independent experiments). (M) Quantification of PLA dots (n = 160 – 253 cell regions of interest demarcated according to eYFP signal within previously defined eCFP-positive cells in three independent experiments). (P) Intracellular eYFP signal in cells stably expressing mGluR2-eYFP and harboring 5-HT2AR-eCFP at the inducible locus. Cells were treated with doxycycline, and then exposed overnight to clozapine (10 μM), or vehicle (n = 73 – 68 cell regions of interest demarcated based on eCFP signal within intracellular vesicles in three independent experiments). Data are mean ± SEM (C, D, F to K, and M to R) or median with 95% confidence interval (L). Statistical analysis was performed using Student’s t-test (G to K, M, and O to R), one-way ANOVA with Bonferroni’s post hoc test (D, F and N), two-way ANOVA with Bonferroni’s post hoc test (C), or Mann-Whitney U test (L). **P < 0.01, ***P < 0.001, n.s., not significant. Scale bars, 5 μm.
Fig. 6.
Fig. 6.. Localization of mGluR2 is dysregulated in the frontal cortex of 5-HT2AR−/− mice.
(A and B) Colocalization analysis of anti-mGluR2 and anti-Rab5 immunoreactivity in cortical primary cultures of 5-HT2AR+/+ and 5-HT2AR−/− mice. Representative confocal micrographs (A). Manders’ coefficient colocalization analysis (B; n = 30 – 74 cell regions of interest in two independent experiments). Nuclei were stained in blue with Hoechst. (C and D) Immunogold labeling for anti-mGluR2 immunoreactivity in the frontal cortex of 5-HT2AR+/+ and 5-HT2AR−/− mice (n = 4 mice per genotype and 25 – 35 synapses per mouse). Representative photomicrographs showing excitatory synapses in mouse frontal cortex (C). Quantification of relative distribution of gold particles within postsynaptic spines (C). Data are mean ± SEM (B and D). Statistical analysis was performed using Student’s t-test (B), or two-way ANOVA with Bonferroni’s post hoc test (D). *P < 0.05, ***P < 0.001, n.s., not significant. Scale bars, 5 μm (A) and 100 nm (C).

Similar articles

Cited by

References

    1. Weis WI, Kobilka BK, The Molecular Basis of G Protein-Coupled Receptor Activation. Annu Rev Biochem 87, 897–919 (2018). - PMC - PubMed
    1. Hilger D, Masureel M, Kobilka BK, Structure and dynamics of GPCR signaling complexes. Nat Struct Mol Biol 25, 4–12 (2018). - PMC - PubMed
    1. Erlandson SC, McMahon C, Kruse AC, Structural Basis for G Protein-Coupled Receptor Signaling. Annu Rev Biophys (2018). - PubMed
    1. Ferre S, Casado V, Devi LA, Filizola M, Jockers R, Lohse MJ, Milligan G, Pin JP, Guitart X, G protein-coupled receptor oligomerization revisited: functional and pharmacological perspectives. Pharmacol Rev 66, 413–434 (2014). - PMC - PubMed
    1. Milligan G, The role of dimerisation in the cellular trafficking of G-protein-coupled receptors. Curr Opin Pharmacol (2009). - PubMed

Publication types

MeSH terms