. 2020 Oct 20;10(1):17832.
doi: 10.1038/s41598-020-74595-8.

Expamers: a new technology to control T cell activation

Affiliations

Expamers: a new technology to control T cell activation

Mateusz P Poltorak et al. Sci Rep. .

Abstract

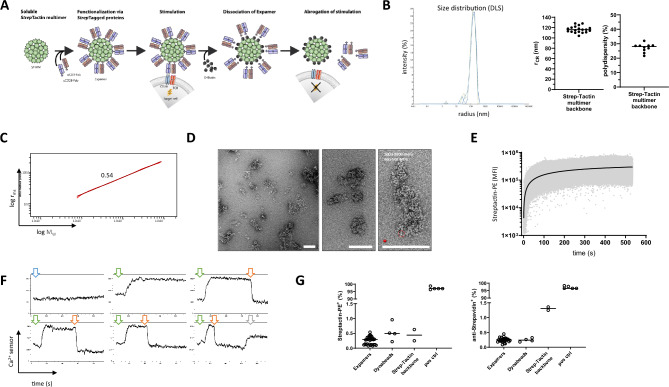
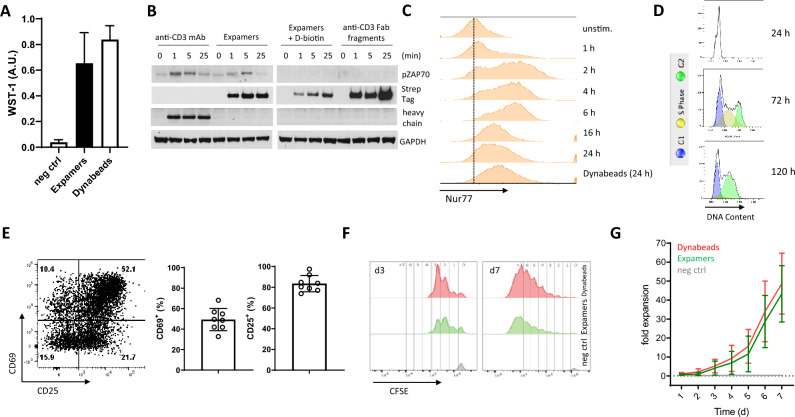
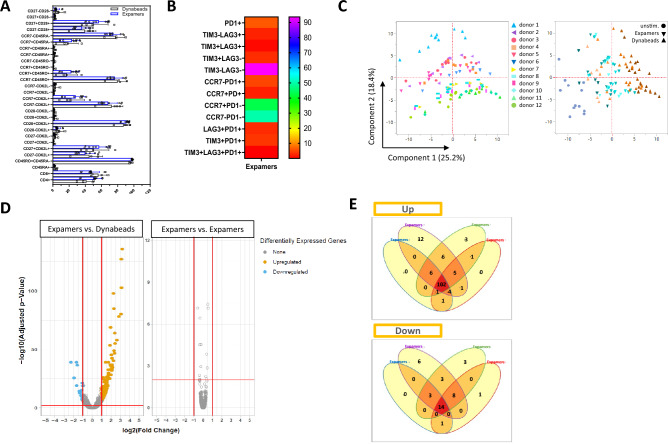
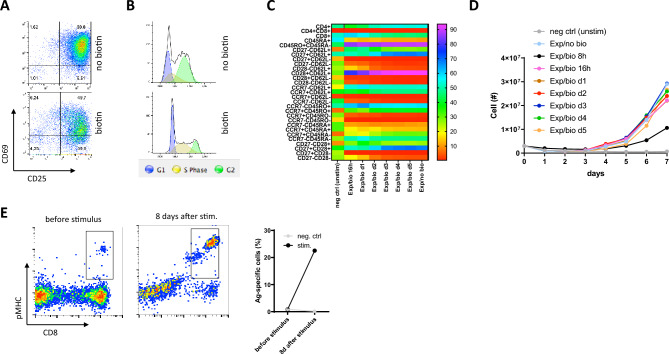
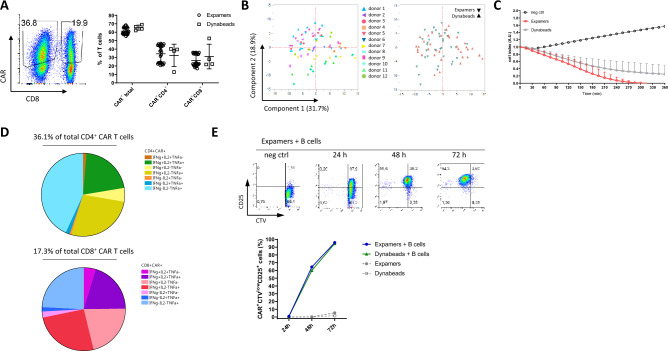
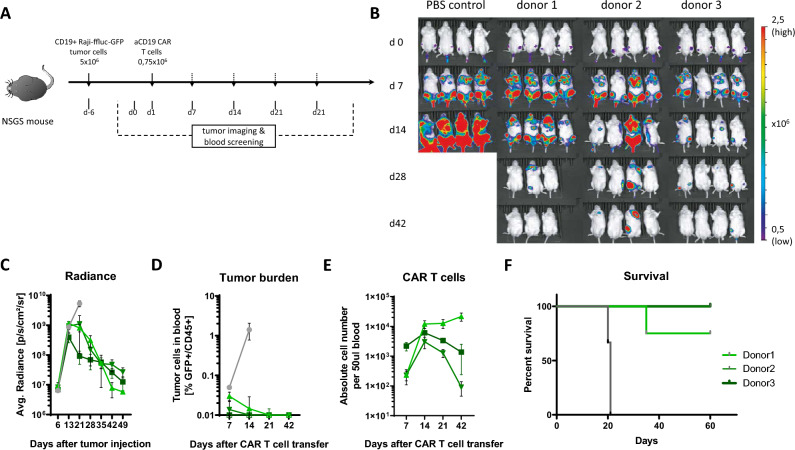
T cell activation is a cornerstone in manufacturing of T cell-based therapies, and precise control over T cell activation is important in the development of the next generation T-cell based therapeutics. This need cannot be fulfilled by currently available methods for T cell stimulation, in particular not in a time dependent manner. Here, we describe a modular activation reagent called Expamers, which addresses these limitations. Expamers are versatile stimuli that are intended for research and clinical use. They are readily soluble and can be rapidly bound and removed from the cell surface, allowing nearly instantaneous initiation and termination of activation signal, respectively. Hence, Expamers enable precise regulation of T cell stimulation duration and provide promise of control over T cell profiles in future products. Expamers can be easily adopted to different T cell production formats and have the potential to increase efficacy of T cell immunotherapeutics.


Conflict of interest statement

M.P.P., P.G., C.T., M.W., V.C., B.B., S.D., T.S., D.H.B., M.E., S.P.F., C.S., and L.G. are currently employed by Juno Therapeutics GmbH A Bristol-Myers Squibb Company and own stock of Bristol-Myers Squibb. D.K. and S.R. are currently employed by Juno Therapeutics Inc. A Bristol-Myers Squibb Company and own stock of Bristol-Myers Squibb. L.G., T.S., P.G., M.P.P., and C.S. are listed as inventors on previously filed related patent applications.

Figures

Figure 1
Figure 1
Biophysical properties of Expamers. (A) Schematic visualization of Expamers mode of action. Expamers spontaneously assemble form single components (anti-CD3 and anti-CD28 Fab fragments as well as Strep-Tactin multimer backbone). Assembled Expamers interact with target T cells by binding to and cross-linking TCR and CD28 surface receptors. Subsequently, Expamers dissociate upon addition of D-biotin. Dissociation results in removing of Expamers from the T cell surface and termination of the activation signal. (B) Histogram overlay of radius measurements of three different Strep-Tactin multimer backbone lots (green, yellow, blue). Graphs depict average hydrodynamic radii from cumulative fits of 19 individual Strep-Tactin multimer backbones as well as polydispersity measurements for different manufacturing lots. (C) The confirmation plot plotting the variation of the molar mass (an average molar mass of 1.29 × 108 Da corresponds to an average amount of approx. 2400 Strep-Tactin tetramers) against the variation of the radius of gyration (92 nm in average). The slope of 0.54 indicates the conformation of a random coil. (D) Electron microscopy images of negatively stained Strep-Tactin multimer show a pleomorphic backbone with mesh sizes ranging from 30 to 300 nm depending on the crosslinking conditions. Individual Strep-Tactins can be observed on the surface of negatively stained multimer (zoom-in). A streptavidin (PDynabeads: 6J6J, red) filtered to 20 Å is inserted for reference. The scale-bars are 100 nm. (E) Graph displays the change of signal intensity over time of CD3+ cells (pre-gated on live, single cells) interacting with fluorescently labelled Strep-Tactin (Strep-Tactin-PE) pre-assembled with anti-CD3 and anti-CD28 Fab fragments. Within seconds all cells became Strep-Tactin-PE-positive underlying the speed of Expamers activation potential. Graph is a representative of three independent measurements. (F) Representative histograms of calcium flux measurements of five independent experiments as shown. Time point of Expamer addition is indicated by green arrows. Time point of D-biotin addition is indicated by red arrows. Ionomycin addition is indicated by a grey arrow and addition of Fab fragments only is indicated by a blue arrow. (G) Graphs display residual content of Expamer components; either Fab fragments detected using Strep-Tactin-PE (left panel) or Strep-Tactin multimer backbone detected using an anti-streptavidin antibody (right panel) 8 days after activation. ‘Expamers’ column represents T cells cultured in the presence of Expamers for 8 days. Dynabeads and Strep-Tactin multimer backbone only were used as a negative controls and Expamer-stained T cells (without dissociation) as a positive control (pos ctrl). Graphs show cumulative data from four independent experiments. Lines represent mean ± SD.
Figure 2
Figure 2
Expamers are a potent T cell activation reagent. (A) Graph shows changes in WST-1 reagent depicted as arbitrary units 48 h after activation with either Expamers or Dynabeads from four independent experiments. Bars represent mean ± SD. Difference between the two stimulation conditions was not significant (two-tailed paired Student’s t test). (B) Human primary T cells were incubated at 37 °C with OKT3 monoclonal anti-CD3 antibody (positive control), anti-CD3 Fab-loaded Expamers in the presence or absence of D-biotin or anti-CD3 Fab fragments only (negative control) for the indicated timepoints. Cells were lysed and cytoplasmic extracts were analyzed for ZAP70 kinase phosphorylation using SDS-PAGE and Western Blot. GAPDH was used as loading control and anti-Strep-Tag as well as anti-heavy chain secondary antibodies were used for reagent detection. One representative blot of three independent experiments is shown. Full-length blots/gels are presented in Supplementary Fig. S8. (C) Histograms from one representative experiment from four independent measurements shows changes in fluorescence intensity of tdTomato-Nur77 reporter in a Jurkat T cell-line over time upon activation with Expamers. For Dynabeads control, 24 h time point is shown. (D) Histograms from one of two independent experiments represent changes in DNA content over time upon Expamers activation. (E) CD69 and CD25 surface marker upregulation was detected 24 h after stimulation with Expamers using flow cytometry. T cells were pre-gated on live, single CD3-positive cells. One representative dot plot is shown. Graph summarize data from 8 independent measurements. Bars represent mean ± SD. (F) Histograms present cell cycle entry and proliferation that were assessed by measuring CFSE dilution of CFSE-labeled T cells by flow cytometry at day 3 and day 7 time point. Numbers on top of the histograms refer to the number of cell division within each generation. (G) T cell proliferation is represented by fold expansion graph that is a cumulative data from at least four experiments. Negative control is represented by unstimulated cells. Lines represent mean ± SD. Difference between two stimulation conditions was not significant (two-tailed paired Student’s t test).
Figure 3
Figure 3
Expamers generate distinct but consistent T cell phenotypic and genetic profiles. (A,B) T cell phenotypic profiling was conducted by measuring surface expression of indicated surface markers by flow cytometry. Bar graph and Heat map present cumulative data from four donors. Error bars in (A) represent mean ± SD. (C) Analysis by PCA indicated that the Expamers titration did result in titration-dependent surface markers expression profiles for selected donors with the Dynabeads treatments distinctly different. Low Expamers and Dynabeads conditions resulted in more comparable T cell profiles. Greater difference was observed between donors (Component 2) than among conditions (Component 1). PCA analysis was based of T cell surface marker expression of 12 donors detected by flow cytometry (left panel, each donor indicated by different color and symbol shape). T cells were left unstimulated (grey shapes on right panel) or were stimulated for 24 h before data collection using either varying concentrations of Expamers (900%, 300%, 100%, 30%, 10% of standard concentration per 1 × 106 T cells; blue gradient on right panel, darker color equals to higher Expamer dose) or different bead-to-cell ratios (3:1, 1:1, 1:3, 1:9, 1:18; orange-to-brown gradient on right panel, darker color equals higher Dynabeads content). (D) Depicted are volcano plots of the -log10 adjusted P value vs. log2 fold change with differentially expressed genes highlighted in color for one out of four representative Expamers condition. Differentially expressed genes were selected by imposing a log2FC cutoff of 1 and Benjamini–Hochberg adjusted FDR cutoff of 0.1. Similar results were achieved for other three Expamers formulations (not shown). (E) The Venn diagram was generated to show that the different individual Expamers conditions (as in D) yielded similar differentially expressed genes compared to Dynabeads stimulation independent of titration conditions for both upregulated (top) and downregulated (bottom) genes. Differentially expressed genes were selected by imposing a log2FC cutoff of 1 and Benjamini–Hochberg adjusted FDR cutoff of 0.1.
Figure 4
Figure 4
Expamers enable control over stimulation duration. (A,B) T cells were stimulated with Expamers. 48 h post-activation D-biotin was added or not to the T cell culture and T cell activation state (A) as well as cell cycle phase (B) was assessed by flow cytometry 24 h later. (C,D) T cells were stimulated as in (A) or left unstimulated. Subsequently, D-biotin was added to the culture at indicated time points. Surface marker expression (C) and proliferation (D) was measured by flow cytometry and cell counting, respectively. (E) Population of HLA-A*0201+ CMV seropositive donor was analyzed before and after 8 days antigen-specific stimulation using either pMHC- and CD28 Fab-loaded multimer backbone or Expamers (polyclonal stimulus—negative control). Events were pre-gated on single, living T cells.
Figure 5
Figure 5
Expamers are suited for CAR T cell generation. (A) T cells stimulated either with Expamers or with Dynabeads were cultured for 7 days. On the last day, expression of CAR was assessed by flow cytometry. One representative dot plot is shown pre-gated on single, living CD3+ cells. Graph displays cumulative data from four different donors with multiple technical replicates each. Lines represent mean ± SD. Difference between two stimulation conditions was not significant (two-tailed paired Student’s t test). (B) PCA analysis of CAR T cells was performed on the same sample set indicated in Fig. 3C but after 7 days of culture. Left panel shows donor distribution (different color and shape for each donor), whereas right panel displays two activation reagents (blue—Expamers, orange—Dynabeads). (C) CAR T cells generated like in (B) were frozen and stored in liquid nitrogen for given time. Afterward, CAR T cells were thawed and rested for 24 h before adding to CD19-HEK target cells in a 5:1 E:T ratio. Graph depicts changes in impedance indicated as arbitrary units over time that is a read out for cytotoxic abilities of CAR T cells from three different donors. CD19-HEK cells co-cultured with T cells expressing an irrelevant CAR were used as negative control. Lines represent mean ± SD. (D) Pie charts show on-target cytokine production by CD4+ or CD8+ CAR T cells from (C) based of flow cytometry measurement of intracellular staining 24 h after co-culturing with target cells. Cells were pre-gated on live, single, CD3+CAR+ cells. Charts display mean values of cytokine secretion of CAR T cells manufactured from three healthy donors. (E) After removal from cryo-storage, CAR T cells were stained with CTV-dye and either left unstimulated or re-stimulated with CD19-expressing B cells from healthy donor. After 24, 48, and 72 h cells were analyzed for dilution of CTV dye (proliferation) and surface expression of CD25. Representative dot plots are shown. Cells were pre-gated on live, single, CD3+CAR+ cells. Graph depicts CAR T cell activation defined as frequency to CAR+CTVlowCD25+.
Figure 6
Figure 6
In vivo function of Expamer-stimulated anti-CD19 CAR T cells. (A) CD19+ Raji/ffluc/GFP tumor cells were engrafted for 7 days in NSGS mice, subsequently 0.75 × 106 CAR T cells (bulk) were infused on day 1. (B) Tumor was imaged using IVIS bioluminescence at indicated time points. (C) Average radiance was quantified using Living image. (D and E) Absolute cell count of CAR T cells in blood was calculated using cell count and frequencies gathered from flow-cytometry analysis. Frequency of tumor cells in blood (CD45+/GFP+) was measured via flow-cytometry illustrated over time. Cells were pre-gated on living lymphocytes. (F) Survival analysis of each group is shown. PBS control is shown in grey. Statistical analysis: log-rank Mantel–Cox test; ***P ≤ 0.0007, n = 4 mice per group, total of 12 mice. Means ± SEM are plotted.

References

    1. Huppa JB, Davis MM. T-cell-antigen recognition and the immunological synapse. Nat. Rev. Immunol. 2003;3:973–983. - PubMed
    1. Garlie NK, LeFever AV, Siebenlist RE, Levine BL, June CH, Lum LG. T cells coactivated with immobilized anti-CD3 and anti-CD28 as potential immunotherapy for cancer. J. Immunother. 1999;22:336. - PubMed
    1. Trickett A, Kwan YL. T cell stimulation and expansion using anti-CD3/CD28 beads. J. Immunol. Methods. 2003;275:251. - PubMed
    1. Carpentier B, Pierobon P, Hivroz C, Henry N. T-cell artificial focal triggering tools: Linking surface interactions with cell response. PLoS One. 2009;4:4784. doi: 10.1371/journal.pone.0004784. - DOI - PMC - PubMed
    1. Riddell SR, Greenberg PD. The use of anti-CD3 and anti-CD28 monoclonal antibodies to clone and expand human antigen-specific T cells. J. Immunol. Methods. 1990;128:189–201. - PubMed

Substances