. 2020 Oct 20;10(1):17733.
doi: 10.1038/s41598-020-74841-z.

Toxic oligomers of the amyloidogenic HypF-N protein form pores in mitochondrial membranes

Affiliations

Toxic oligomers of the amyloidogenic HypF-N protein form pores in mitochondrial membranes

Maria Ylenia Farrugia et al. Sci Rep. .

Abstract

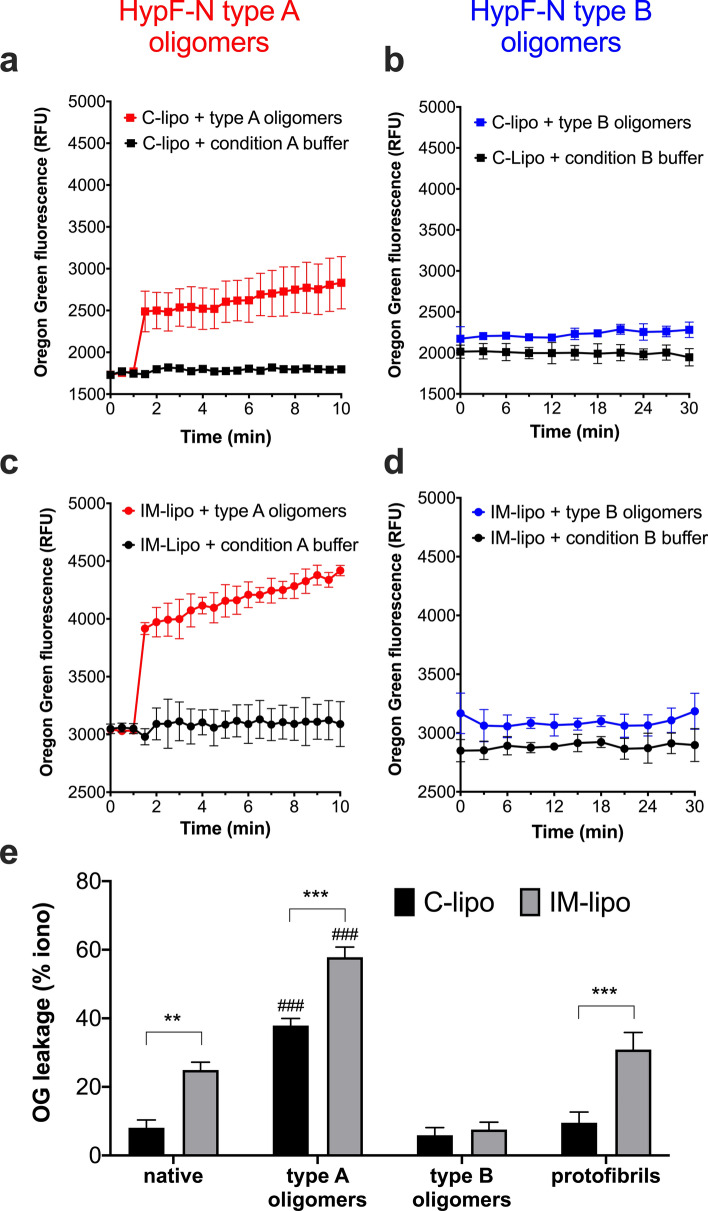
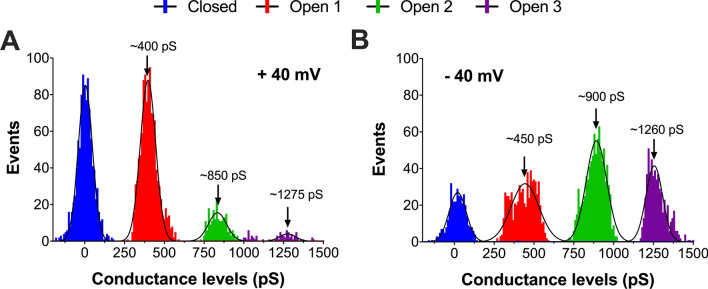
Studies on the amyloidogenic N-terminal domain of the E. coli HypF protein (HypF-N) have contributed significantly to a detailed understanding of the pathogenic mechanisms in neurodegenerative diseases characterised by the formation of misfolded oligomers, by proteins such as amyloid-β, α-synuclein and tau. Given that both cell membranes and mitochondria are increasingly recognised as key targets of oligomer toxicity, we investigated the damaging effects of aggregates of HypF-N on mitochondrial membranes. Essentially, we found that HypF-N oligomers characterised by high surface hydrophobicity (type A) were able to trigger a robust permeabilisation of mito-mimetic liposomes possessing cardiolipin-rich membranes and dysfunction of isolated mitochondria, as demonstrated by a combination of mitochondrial shrinking, lowering of mitochondrial membrane potential and cytochrome c release. Furthermore, using single-channel electrophysiology recordings we obtained evidence that the type A aggregates induced currents reflecting formation of ion-conducting pores in mito-mimetic planar phospholipid bilayers, with multi-level conductances ranging in the hundreds of pS at negative membrane voltages. Conversely, HypF-N oligomers with low surface hydrophobicity (type B) could not permeabilise or porate mitochondrial membranes. These results suggest an inherent toxicity of membrane-active aggregates of amyloid-forming proteins to mitochondria, and that targeting of oligomer-mitochondrial membrane interactions might therefore afford protection against such damage.


Conflict of interest statement

The authors declare no competing interests.

Figures

Figure 1
Figure 1
Permeabilisation kinetics and leakage of LUVs having mito-mimetic (IM-type) and neuronal-like (C-type) membranes induced by HypF-N protein in different aggregation states. (a–d) Time dependence of fluorescence of OG entrapped in C-type (C-Lipo) or IM-type (IM-Lipo) lipid vesicles following addition of 2 μM HypF-N oligomers (type A or type B) at a peptide-to-lipid molar ratio of 1:25. Control liposomes without peptide were incubated in liposome buffer containing equivalent concentrations of condition A or condition B aggregation buffer. Error bars represent the s.e.m. of 3 replicate experiments. (e) Comparison of OG dye leakage from C-lipo and IM-lipo by different HypF-N species. Leakage by monomeric (native), oligomeric (type A or type B oligo) and protofibrillar HypF-N are shown as a percentage of that induced by the Ca2+ ionophore ionomycin (iono). Data are presented as means ± s.e.m. (n = 3–7); ** p < 0.01, *** p < 0.001, between marked pairs; ### p < 0.001, between type A and type B oligomers (two-way ANOVA with Bonferroni’s correction).
Figure 2
Figure 2
Leakage of FITC-dextran polymer (40 kDa and 250 kDA) from liposomes by HypF-N type A oligomers. Maximum leakage of FITC-40 and FITC-250 dextran molecules from 50 μM IM-type liposomes was determined after the addition of 2 μM type A HypF-N oligomeric aggregates, and is shown as a percentage of that induced by the detergent M-PER. Also shown is the background leakage from the liposomes incubated with an equivalent concentration of condition A aggregation buffer alone, to control for the effect of buffer. Data are presented as means ± s.e.m. (n = 5); *** p < 0.0001 (two-way ANOVA with Bonferroni’s correction).
Figure 3
Figure 3
Effects of HypF-N species on organelle volume, cytochrome c release and Δψm of isolated mitochondria. (a) Changes in the absorbance at 540 nm (A540 nm) in a suspension of freshly isolated mitochondria in MB after 60 min incubation, alone (Ctrl) or with the swelling-inducing agents 50 μM alamethicin and 250 μM CaCl2 (Ca2+), and with 10 μM HypF-N in monomeric (native) and oligomeric (type A, type B) states. Condition A buffer alone (used to generate the type A oligomers) was also included as a control. Significant swelling of mitochondria is triggered by alamethicin and Ca2+, as expected, whilst type A oligomers cause organelle shrinkage. (b) Representative kinetic traces (n = 3–5) showing the absorbance measurements (A540 nm), relative to the value at time 0 min, every 5 min for mitochondria incubated alone (Ctrl) or with 250 μM CaCl2 (Ca2+ ions), condition A buffer, and 10 µM HypF-N type A oligomers. The shrinkage effect of the type A aggregates is immediate and maintained over 60 min. (c) Effect of HypF-N species on the cyto c release (CCR) from isolated mitochondria incubated in MB for 60 min, given as a percentage of 1% (v/v) Triton X-100 (TX-100). Amount of cyto c released into buffer was determined using Quantikine immunoassay (~ 35 ng/ml with TX-100). A significant CCR was evoked by type A, but not type B or native HypF-N, at the same concentrations (12 μM). (d) Measurement of Δψm by JC-1 dye, from isolated mitochondria following 30-min exposure to equimolar concentrations (2 μM) of HypF-N (native, type A and type B oligomers). Δψm is given as a percentage of untreated mitochondria control (100%), after baseline correction obtained by dissipating Δψm using FCCP. A reduction in the Δψm is observed in the case of type A oligomers. In all panels data are presented as means ± s.e.m. (n = 3–6, with duplicate or triplicate measurements); * p < 0.05, ** p < 0.01, *** p < 0.001, with respect to Ctrl or native HypF-N, or between marked pairs (one-way ANOVA with Bonferroni’s correction).
Figure 4
Figure 4
Electrophysiological characterisation of type A HypF-N pores in IM-type planar lipid bilayer. (a) Success rate of pore formation for each HypF-N species type, as a percentage of the total number of electrophysiology trials (n = 10 for 5 μM native HypF-N, and n = 15, 12 and 10 for 0.8 μM, 1.6 μM and 5 μM HypF-N type A oligomers, respectively). (b) Control trace devoid of channel activity, when native HypF-N or condition A aggregation buffer were added to the cis-chamber. (c–f) Representative current traces after addition of 5 µM oligomeric type A HypF-N. Typical current recordings are shown for type-I (c,d) and type-II (e,f) pores, at square wave-voltage pulses of − 40 mV and + 40 mV. The induced currents are indicative of the formation of HypF-N nanopores in the BLM. Electrical recordings were all carried out on IM-type planar BLM (45 PC/25 PE/10 PI/5 PS/15 CL) under symmetrical buffer conditions (250/250 mM KCl, 10 mM MOPS/Tris, pH 7.2), using PatchMaster standard protocols.
Figure 5
Figure 5
Current–voltage (I–V) relationships for a single HypF-N pore. Current–voltage ramp was performed under symmetric (250/250 mM KCl) and asymmetric (250/20 mM KCl) buffer conditions (10 mM MOPS/Tris, pH 7.2, 22 °C) whilst a type A HypF-N pore was inserted in the IM-type bilayer membrane. The intercept on the V axis equivalent to the reversal potential (Erev) is given at + 15 mV, implying a selectivity for cations. The I–V data set is fitted to a second order polynomial (quadratic) equation using a least squares fit (n = 2 independent experiments).
Figure 6
Figure 6
Histograms of conductance levels by HypF-N type A oligomers recorded in IM-type bilayers. (A) Histogram analysis of all the closed and multi-level open conductance states at + 40 mV (n = 3349) and − 40 mV (n = 3349) applied holding potential from a single-channel recording of a detected pore incorporated in IM-type planar BLM. Conductance histograms are fitted to a Gaussian distribution (solid black lines) with assigned peaks indicated by arrows. Peak conductance levels differ from each other by ~ 400–450 pS, indicating quantisation of conductivity with a smallest step of ~ 400–450 pS. Electrical recordings were carried out in 10 mM MOPS/Tris and 250/250 mM KCl, pH 7.2 at 22 °C.
Figure 7
Figure 7
Dwell-times for HypF-N type A oligomers at defined conductance states Open 1 to 3. Scatter plot of dwell-times recorded at conductance states Open 1, 2 and 3, at + 40 mV (left panel) and − 40 mV (right panel). The mean dwell-time (in ms) and its s.e.m. is also shown for each Open level. At a negative membrane potential, the open probability of Open 2 and Open 3 states is markedly increased.

Similar articles

Cited by

References

    1. Chiti F, Dobson CM. Protein misfolding, amyloid formation, and human disease: A summary of progress over the last decade. Annu. Rev. Biochem. 2017;86:27–68. doi: 10.1146/annurev-biochem-061516-045115. - DOI - PubMed
    1. Soto C, Estrada LD. Protein misfolding and neurodegeneration. Arch. Neurol. 2008;65:184–189. doi: 10.1001/archneurol.2007.56. - DOI - PubMed
    1. Kayed R, Lasagna-Reeves CA. Molecular mechanisms of amyloid oligomers toxicity. J. Alzheimers Dis. 2013;33(Suppl 1):S67–78. doi: 10.3233/JAD-2012-129001. - DOI - PubMed
    1. Gadad BS, Britton GB, Rao KS. Targeting oligomers in neurodegenerative disorders: Lessons from alpha-synuclein, tau, and amyloid-beta peptide. J. Alzheimers Dis. 2011;24(Suppl 2):223–232. doi: 10.3233/JAD-2011-110182. - DOI - PubMed
    1. Bemporad F, Chiti F. Protein misfolded oligomers: Experimental approaches, mechanism of formation, and structure-toxicity relationships. Chem. Biol. 2012;19:315–327. doi: 10.1016/j.chembiol.2012.02.003. - DOI - PubMed

Publication types

MeSH terms