

Low expression of Talin1 is associated with advanced pathological features in colorectal cancer patients
- PMID: 33082414
- PMCID: PMC7576823
- DOI: 10.1038/s41598-020-74810-6
Low expression of Talin1 is associated with advanced pathological features in colorectal cancer patients
Abstract
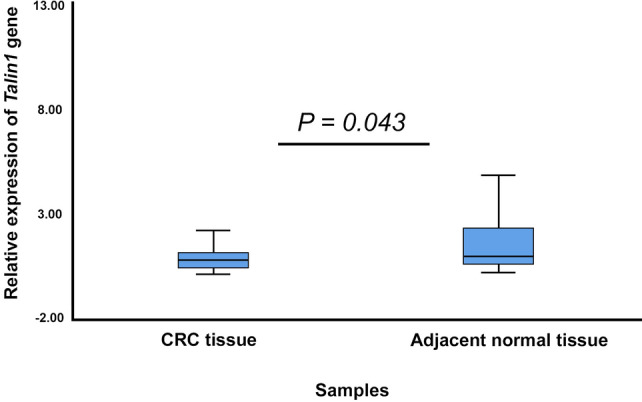
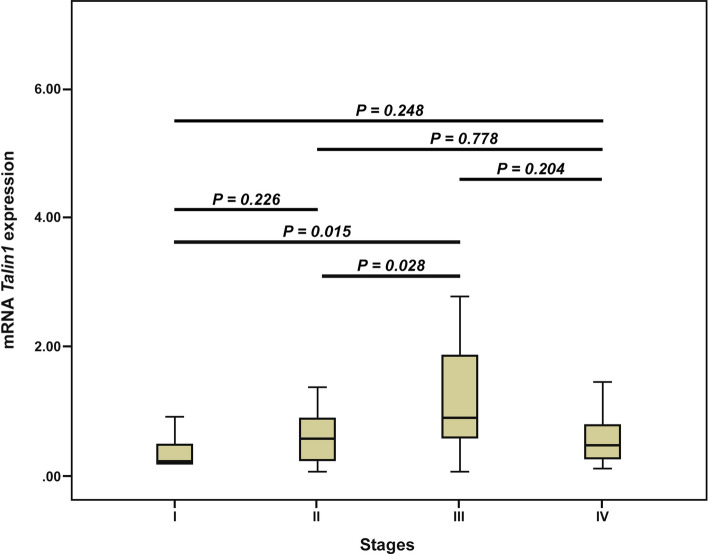
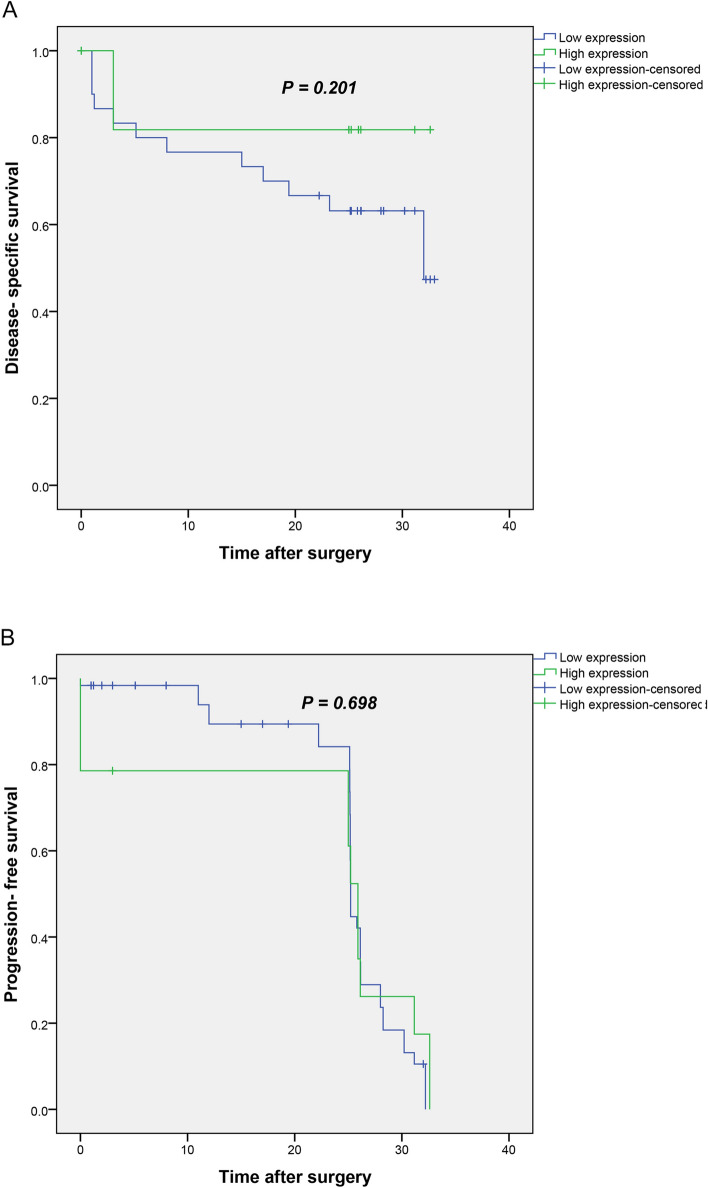
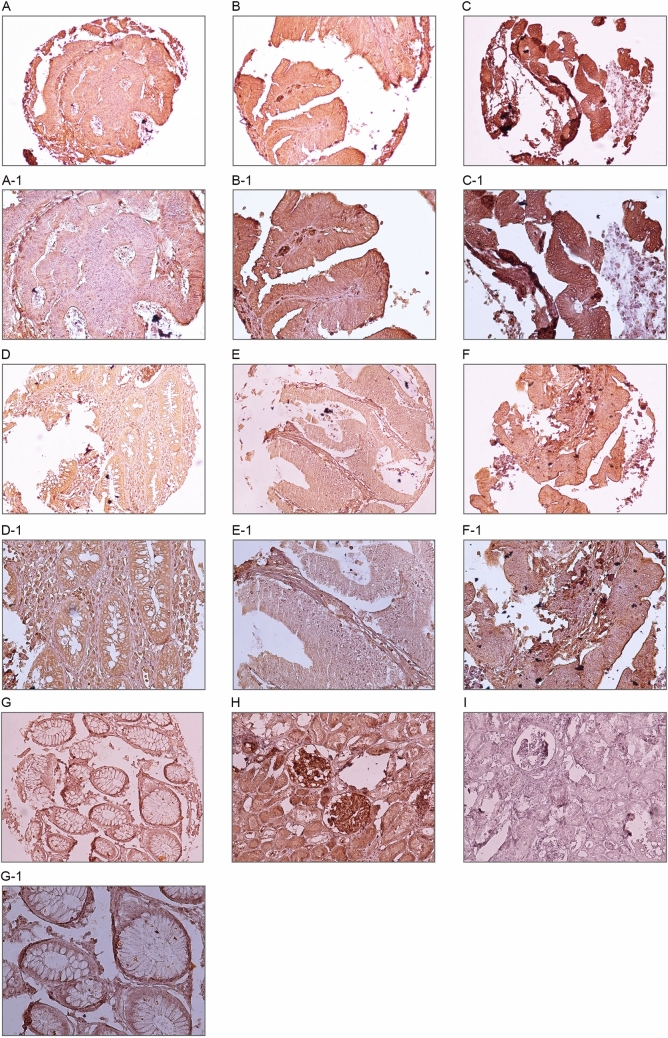
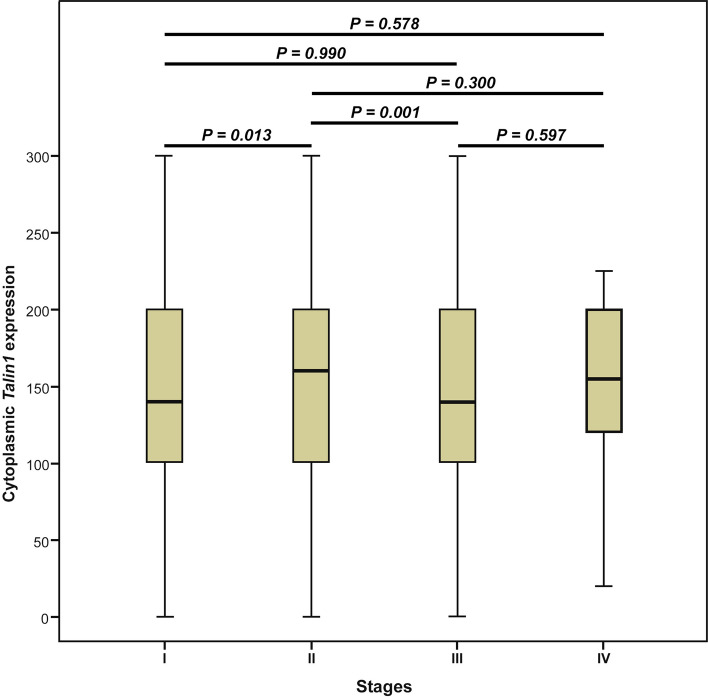
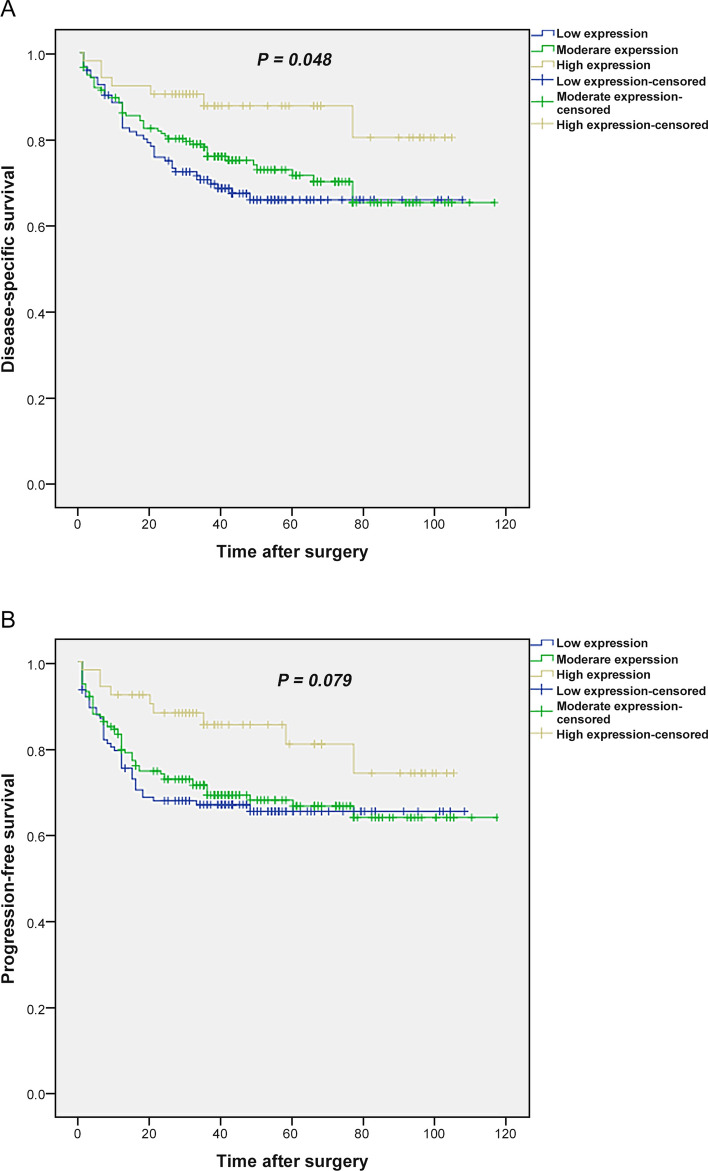
To explore the proper prognostic markers for the likelihood of metastasis in CRC patients. Seventy-seven fresh CRC samples were collected to evaluate the mRNA level of the selected marker using Real-time PCR. Moreover, 648 formalin-fixed paraffin-embedded CRC tissues were gathered to evaluate protein expression by immunohistochemistry (IHC) on tissue microarrays. The results of Real-Time PCR showed that low expression of Talin1 was significantly associated with advanced TNM stage (p = 0.034) as well as gender (p = 0.029) in mRNA levels. Similarly, IHC results indicated that a low level of cytoplasmic expression of Talin1 was significantly associated with advanced TNM stage (p = 0.028) as well as gender (p = 0.009) in CRC patients. Moreover, decreased expression of cytoplasmic Talin1 protein was found to be a significant predictor of worse disease-specific survival (DSS) (p = 0.011) in the univariate analysis. In addition, a significant difference was achieved (p = 0.039) in 5-year survival rates of DSS: 65% for low, 72% for moderate, and 88% for high Talin1 protein expression. Observations showed that lower expression of Talin1 at both the gene and protein level may drive the disparity of CRC patients' outcomes via worse DSS and provide new insights into the development of progression indicators because of its correlation with increased tumor aggressiveness.
Conflict of interest statement
The authors declare no competing interests.
Figures
Similar articles
-
Talin1, a valuable marker for diagnosis and prognostic assessment of human hepatocelluar carcinomas.Asian Pac J Cancer Prev. 2011;12(12):3265-9. Asian Pac J Cancer Prev. 2011. PMID: 22471464
-
Expressions of TWIST1 and CD105 markers in colorectal cancer patients and their association with metastatic potential and prognosis.Diagn Pathol. 2021 Mar 22;16(1):26. doi: 10.1186/s13000-021-01088-1. Diagn Pathol. 2021. PMID: 33752711 Free PMC article.
-
[Expression of microRNA-152 in colorectal cancer and its relationship with prognosis].Zhonghua Zhong Liu Za Zhi. 2016 Oct 23;38(10):763-766. doi: 10.3760/cma.j.issn.0253-3766.2016.10.010. Zhonghua Zhong Liu Za Zhi. 2016. PMID: 27784461 Chinese.
-
The prognostic significance of p63 cytoplasmic expression in colorectal cancer. An immunohistochemical study.Saudi Med J. 2019 May;40(5):432-439. doi: 10.15537/smj.2019.5.24162. Saudi Med J. 2019. PMID: 31056618 Free PMC article.
-
Decreased expression of semaphorin 3D is associated with genesis and development in colorectal cancer.World J Surg Oncol. 2017 Mar 20;15(1):67. doi: 10.1186/s12957-017-1128-1. World J Surg Oncol. 2017. PMID: 28320475 Free PMC article.
Cited by
-
Upregulated Talin1 synergistically boosts β-estradiol-induced proliferation and pro-angiogenesis of eutopic and ectopic endometrial stromal cells in adenomyosis.Reprod Biol Endocrinol. 2021 May 14;19(1):70. doi: 10.1186/s12958-021-00756-7. Reprod Biol Endocrinol. 2021. PMID: 33990206 Free PMC article.
-
Proteomic Signature of Extracellular Vesicles Associated with Colorectal Cancer.Molecules. 2023 May 22;28(10):4227. doi: 10.3390/molecules28104227. Molecules. 2023. PMID: 37241967 Free PMC article.
-
Talin1 Ser425 phosphorylation promotes colorectal cancer progression and metastasis.Transl Cancer Res. 2025 Feb 28;14(2):796-807. doi: 10.21037/tcr-24-1283. Epub 2025 Feb 26. Transl Cancer Res. 2025. PMID: 40104703 Free PMC article.
-
The Association Between Higher Expression of Talin-1 and the Reduced Survival Rate in Ovarian Serous Carcinoma Patients.Iran J Pathol. 2023 Summer;18(3):312-326. doi: 10.30699/IJP.2023.554227.2901. Epub 2023 Jul 16. Iran J Pathol. 2023. PMID: 37942198 Free PMC article.
-
High expression of Talin-1 is associated with tumor progression and recurrence in melanoma skin cancer patients.BMC Cancer. 2023 Apr 3;23(1):302. doi: 10.1186/s12885-023-10771-z. BMC Cancer. 2023. PMID: 37013489 Free PMC article.
References
MeSH terms
Substances
LinkOut - more resources
Full Text Sources
Medical
Miscellaneous
