. 2020 Oct 20;10(1):17807.
doi: 10.1038/s41598-020-74664-y.

The transcription factor Sox10 is an essential determinant of branching morphogenesis and involution in the mouse mammary gland

Affiliations

The transcription factor Sox10 is an essential determinant of branching morphogenesis and involution in the mouse mammary gland

Svenja Mertelmeyer et al. Sci Rep. .

Abstract

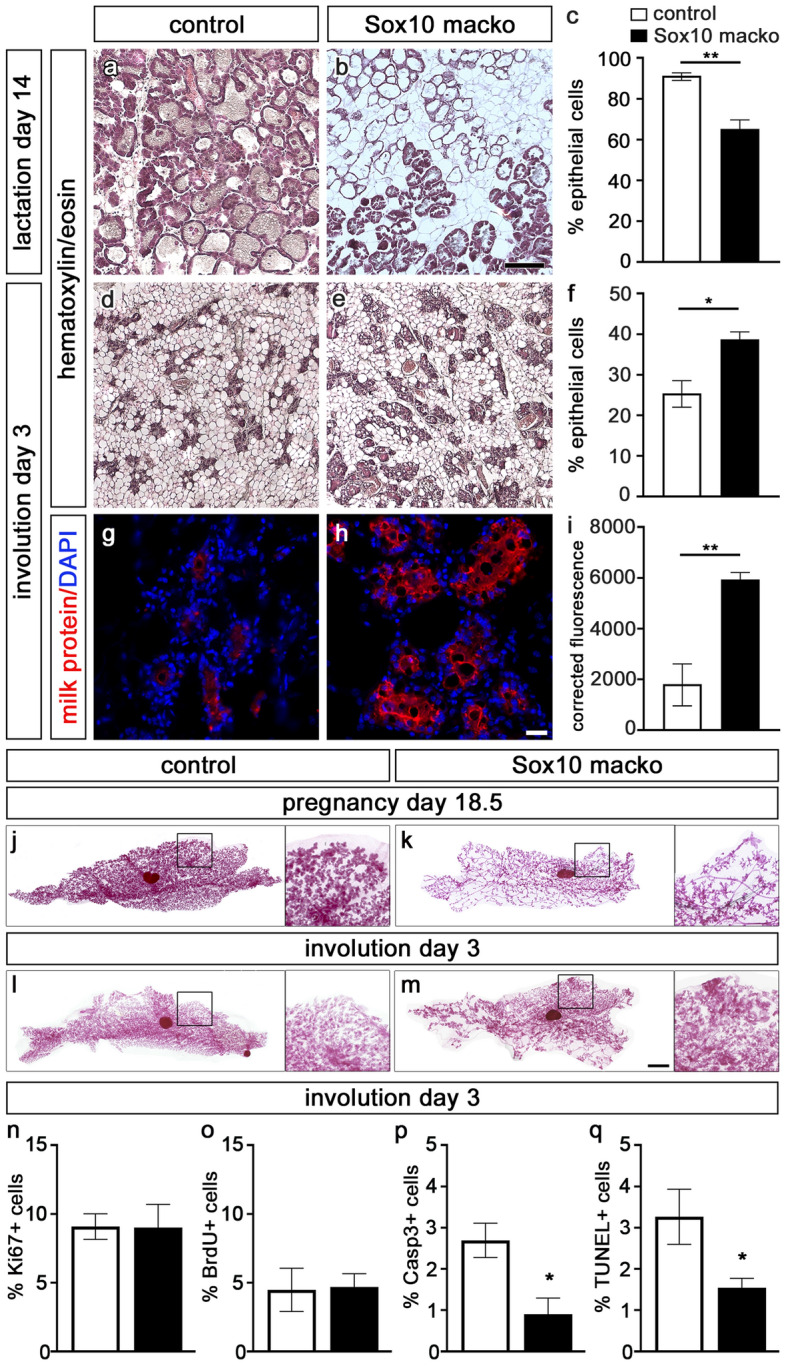
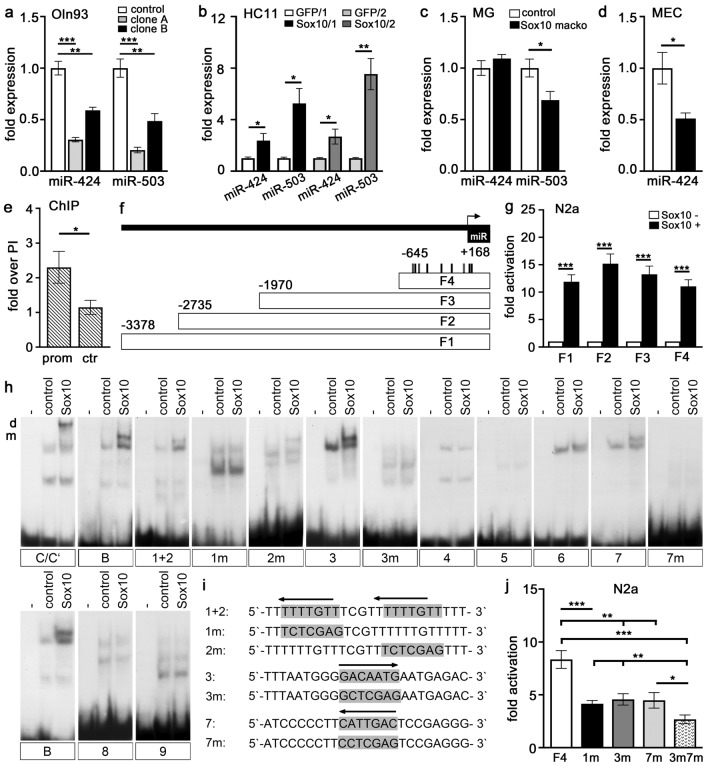
The high mobility group-domain containing transcription factor Sox10 is an essential regulator of developmental processes and homeostasis in the neural crest, several neural crest-derived lineages and myelinating glia. Recent studies have also implicated Sox10 as an important factor in mammary stem and precursor cells. Here we employ a series of mouse mutants with constitutive and conditional Sox10 deficiencies to show that Sox10 has multiple functions in the developing mammary gland. While there is no indication for a requirement of Sox10 in the specification of the mammary placode or descending mammary bud, it is essential for both the prenatal hormone-independent as well as the pubertal hormone-dependent branching of the mammary epithelium and for proper alveologenesis during pregnancy. It furthermore acts in a dosage-dependent manner. Sox10 also plays a role during the involution process at the end of the lactation period. Whereas its effect on epithelial branching and alveologenesis are likely causally related to its function in mammary stem and precursor cells, this is not the case for its function during involution where Sox10 seems to work at least in part through regulation of the miR-424(322)/503 cluster.


Conflict of interest statement

The authors declare no competing interests.

Figures

Figure 1
Figure 1
Prenatal mammary gland development in mice with embryonal Sox10 deletion. (ag) X-gal staining was performed at E14.5 (a,b), E16.5 (c,d) and E18.5 (eg) on ventral dermis including mammary gland anlagen to detect β-galactosidase activity in Sox10+/lacZ (a,c,f), Sox10lacZ/lacZ (b,d,g) and control Sox10::Cre Rosa26stopflox-lacZ (e) mouse embryos. Staining is in the mammary gland anlagen (asterisks) and peripheral nerves (arrowheads). Magnifications in right upper corner (ad) or on right (eg) correspond to boxed areas in main panels. (hv) Confocal sections of mammary gland ducts at E18.5 (hq) and P56 (rv) in Sox10lacZ/lacZ (hl) and Sox10+/+ (mv) mice. Immunohistochemistry was performed using antibodies directed against keratin 14 (h,m,r), keratin 8 (i,n,s), β-galactosidase (βGal, j) and Sox10 (o,t). Single (hj,mo,rt) or merged (k,l,p,q,u,v) stainings are shown. Scale bars: 50 µm (b,d), 2 mm (g), 10 µm (l,q,v).
Figure 2
Figure 2
Postnatal mammary gland development in mice with embryonal Sox10 deletion. (al) Carmine-alum and X-gal stainings were performed at P21 (ac), P28 (df), P42 (gi) and P56 (jl) on Sox10+/+ (wt in a,d,g,j) and Sox10+/lacZ (b,c,e,f,h,i,k,l) mice. Inlays in right upper corner show magnifications of boxed areas in main panels. (m,n) The number of terminal end buds (TEB in m) and ductal tips (n) was quantified in mammary glands of Sox10+/+ (grey hatched bars) and Sox10+/lacZ (black hatched bars) mice at P21, P28, P42 and P56 (n = 4–7). Presentations are as absolute cell numbers ± SEM. Statistical significance between age-matched Sox10+/+ and Sox10+/lacZ was determined by Student`s t-test (***, P ≤ 0.001). Scale bar: 2 mm (a).
Figure 3
Figure 3
Mammary gland development in mice with early postnatal Sox10 deletion. (a) Mammary glands (schematically shown in the upper left panel including lymph node, LN) of MMTV::Cre(A) Rosa26stopfloxYFP mice had undergone efficient Cre-dependent recombination at P21 as evident from YFP signals in whole mounts (upper right panel, corresponding to boxed area) and epithelial duct cross-sections (left lower panel) as well as quantification of YFP-positive cells ± SEM in the mammary epithelium (n = 3). DAPI was used to counterstain nuclei. (b) Ductal morphology in female control and MMTV::Cre(A) Sox10fl/fl mice was analyzed by hematoxylin/eosin staining at P56. (ch) Carmine-alum staining was used to visualize the mammary epithelium in female MMTV::Cre(A) Sox10fl/fl mice at P42 (c,d) and P56 (e,f) or after 1 day of lactation (g,h). Panels on the left show the whole gland; panels on the right are magnifications of the area containing the mammary gland epithelium. Scale bars: 1 mm (a, upper panel), 100 µm (a, lower panel; b), 2 mm (c), 200 µm (d).
Figure 4
Figure 4
Mammary gland development in Sox10 macko mice with late adolescent Sox10 deletion. (a) Mammary glands (schematically shown on the upper left including lymph node, LN) of MMTV::Cre(F) Rosa26stopfloxYFP mice underwent Cre-dependent recombination between P35 and P38 as evident from YFP signals (upper right panels, corresponding to boxed area). By P56, efficient Cre-dependent recombination had occurred as evident from YFP immunohistochemistry of epithelial duct cross-sections (left lower panel) as well as quantification of YFP-positive cells ± SEM in the mammary epithelium (n = 3). DAPI was used to counterstain nuclei. (b,c) Co-immunohistochemistry was performed on mammary ducts of control and Sox10 macko mice at 8 weeks of age using antibodies against Sox10 (red) and K14 (green). (d,e) Morphology of mammary ducts was compared in control and Sox10 macko mice at 8 weeks by hematoxylin/eosin staining. (fk) Carmine-alum staining was performed at P28 (f,g), P42 (h,i) and P56 (j,k) on mammary glands of control (f,h,j) and Sox10 macko (g,i,k) mice. Scale bars: 2 mm (a, upper panel; g), 100 µm (a, lower panel), 50 µm (c,e). (l,m) The number of terminal end buds (TEB in l) and ductal tips (m) was quantified in mammary gland sections of control (white bars) and Sox10 macko (black bars) mice at P28, P42 and P56 (n = 4–7). Presentations are as absolute TEB and ductal tip numbers ± SEM. No statistical significance was observed between age-matched control and Sox10 macko mice by Student’s t-test.
Figure 5
Figure 5
Proliferation and apoptosis in mammary glands of adult virgin, pregnant and early lactating Sox10/tdTomato macko mice. (ah) Quantification of the percentage of tdTomato-positive mammary epithelial cells ± SEM in P56-old virgin (ad) or 7.5 day pregnant adult (eh) control (white bars) and Sox10/tdTomato macko (black bars) mice that are labelled by antibodies directed against Ki67 (a,e), BrdU (b,f), cleaved caspase 3 (c,g) or by TUNEL (d,h) (n = 5–10). (in) Hematoxylin/eosin staining (i,j,l,m) was performed on mammary gland sections to quantify the percentage ± SEM of epithelial cells in the gland (k,n) of 18.5 day pregnant (ik) and 2 day lactating (ln) adult control (white bars) and Sox10 macko (black bars) mice (n = 3–4). Scale bar: 500 µm (j). (or) Quantification of the percentage of mammary epithelial cells ± SEM in 2 day lactating control (white bars) and Sox10/tdTomato macko (black bars) mice that are labelled by antibodies directed against Ki67 (o), BrdU (p), cleaved caspase 3 (q) or by TUNEL (r) (n = 4–7). Statistical significance of differences between matched control and Sox10 macko was determined by Student`s t-test (*, P ≤ 0.05).
Figure 6
Figure 6
Analysis of mammary gland function in lactating Sox10 macko mice. (a,b) Oil Red O staining was performed in combination with hematoxylin/eosin staining on mammary gland sections of 14 day lactating adult control (a) and Sox10 macko (b) mice. Magnifications at bottom correspond to boxed areas in main panels. (c) Triglyceride content of milk from lactating adult control (white bars) and Sox10 macko (black bars) mice was determined as g/dl ± SEM (n = 3–4). (d) Protein content of milk from lactating adult control (white bars) and Sox10 macko (black bars) mice was measured in mg/ml ± SEM (n = 3–4). (e) Composition of milk proteins in lactating adult control and Sox10 macko mice was analyzed by SDS polyacrylamide gelelectrophoresis and Coomassie blue staining. Sizes of molecular weight markers are indicated on the right in kilodaltons (kDa). CN, casein, Lf, lactoferrin; SA, serum albumin; WAP, whey acid protein. (f) The amount of milk retrievable from lactating adult control (white bars) and Sox10 macko (black bars) mice is presented in mg per milking event (4 animals per genotype, 3 milking events per animal). (g,h) The body weight of pups from MMTV::Cre(F) mothers (white bars, g), Sox10fl/fl mothers (grey bars, g), Sox10 macko (black bars, g), Sox10+/+ (grey hatched bars, h) and Sox10+/lacZ (black hatched bars, h) mothers was determined at P8 and P14 and is presented in g ± SEM per pup (4–9 size-matched litters per genotype with 4–8 pups per litter.) Scale bar, 100 µm. Statistical significance of differences among genotypes was determined by Student`s t-test (c,d,f,h) or One-way ANOVA with Bonferroni’s multiple comparisons test (g) (*, P ≤ 0.05; **, P ≤ 0.01; ***, P ≤ 0.001).
Figure 7
Figure 7
Analysis of involution of the mammary gland in Sox10 macko mice. (af) Hematoxylin/eosin staining of mammary gland sections was performed to compare the histology in adult control (a,d) and Sox10 macko (b,e) mice at 14 days of lactation (ac) and 3 days of involution (df) and to quantify the percentage ± SEM of epithelial cells in the gland (c,f) (n = 3–5). (gi) Immunohistochemistry with antibodies (red) directed against mouse milk proteins (g,h) was used to quantify the milk protein signal on mammary gland sections of adult control (white bars) and Sox10 macko (black bars) mice at 3 days of involution as corrected fluorescence ± SEM. (i). Nuclei were counterstained with DAPI. (n = 3–4). (jm) Carmine-alum stainings were performed at day 18.5 of pregnancy (j,k) and day 3 of involution (l,m) on control (j,l) and Sox10 macko (k,m) mice. Magnifications on right correspond to boxed areas in main panels. Scale bars: 500 µm (b), 50 µm (h), 1 mm (m). (nq) Quantification of the percentage of mammary epithelial cells ± SEM at day 3 of involution in control (white bars) and Sox10/tdTomato macko (black bars) mice that are labelled by antibodies directed against Ki67 (n), BrdU (o), cleaved caspase 3 (p) or by TUNEL (q) (n = 5–8). Statistical significance of differences between control and Sox10 macko was determined by Student’s t-test (*, P ≤ 0.05; **, P ≤ 0.01).
Figure 8
Figure 8
The miR-424(322)/503 cluster is a direct downstream target of Sox10. (ad) Relative expression levels ± SEM of miR-424 and miR-503 were determined in control (white bars) and Sox10-deficient (grey and black bars) Oln93 cells (a), control (white and light grey bars) and Sox10-overexpressing (dark grey and black bars) HC11 cells (b), involuting control (white bars) and Sox10 macko (black bars) mammary glands (MG, c) and FACS-purified mammary epithelial cells (MEC, d) from control (white bars) and Sox10/tdTomato macko (black bars) mice (n = 3–4). (e) Chromatin immunoprecipitation on involuting mammary glands with antibodies against Sox10. Fold enrichment ± SEM of the miR-424(322)/503 promoter (prom) and a genomic control region in the immunoprecipitates was determined relative to preimmune serum (PI; n = 3). (f) Scheme of the miR-424(322)/503 promoter (F1, positions − 3378 to + 168) and its subfragments F2–F4. Positions of potential Sox10 binding sites in F4 and transcriptional start site (arrow) are indicated. (g) Fold activations ± SEM were determined for luciferase reporter plasmids carrying miR-424(322)/503 promoter fragments in transiently transfected N2a in the presence or absence of Sox10 (n ≥ 6). (h) For EMSA experiments, oligonucleotides containing potential Sox10 binding sites 1–9 (each on a separate gel; for localization, see (f) were incubated without cell extract (−), or in the presence of extracts from HEK293 cells transfected with empty (control) or Sox10 expression vector. Binding sites C/C′ and B from the Mpz gene served as control for dimeric and monomeric binding. Sox10 binding to sites 1, 2, 3 and 7 was further analyzed by introducing mutations. (i) Sequences of Sox10 binding sites 1, 2, 3, 7 and their mutant versions 1m, 2m, 3m and 7m. (j) Fold activations ± SEM were determined for luciferase reporter plasmids carrying the F4 core promoter fragment in wildtype version (F4) or after mutation of sites 1, 3 and 7 (1m, 3m, 7m, 3m7m) in transiently transfected N2a in the presence or absence of Sox10 (n ≥ 8). Statistical significance was determined by Student’s t-test (ae,g) or One-way ANOVA with Bonferroni’s multiple comparisons test (j) (*, P ≤ 0.05; **, P ≤ 0.01; ***, P ≤ 0.001).

Similar articles

Cited by

References

    1. Wegner M. From head to toes: the multiple facets of Sox proteins. Nucleic Acids Res. 1999;27:1409–1420. doi: 10.1093/nar/27.6.1409. - DOI - PMC - PubMed
    1. Kelsh RN. Sorting out Sox10 functions in neural crest development. BioEssays. 2006;28:788–798. doi: 10.1002/bies.20445. - DOI - PubMed
    1. Weider M, Wegner M. SoxE factors: transcriptional regulators of neural differentiation and nervous system development. Semin. Cell Dev. Biol. 2017;63:35–42. doi: 10.1016/j.semcdb.2016.08.013. - DOI - PubMed
    1. Britsch S, et al. The transcription factor Sox10 is a key regulator of peripheral glial development. Genes Dev. 2001;15:66–78. doi: 10.1101/gad.186601. - DOI - PMC - PubMed
    1. Cheung M, et al. The transcriptional control of trunk neural crest induction, survival, and delamination. Dev. Cell. 2005;8:179–192. doi: 10.1016/j.devcel.2004.12.010. - DOI - PubMed

Publication types

LinkOut - more resources