. 2020 Oct 6:2020:2109325.
doi: 10.1155/2020/2109325. eCollection 2020.

Disease-Specific Autoantibodies Induce Trained Immunity in RA Synovial Tissues and Its Gene Signature Correlates with the Response to Clinical Therapy

Affiliations

Disease-Specific Autoantibodies Induce Trained Immunity in RA Synovial Tissues and Its Gene Signature Correlates with the Response to Clinical Therapy

Xiaoli Dai et al. Mediators Inflamm. .

Abstract

Much evidence suggests that trained immunity is inappropriately activated in the synovial tissue in rheumatoid arthritis (RA), but the underlying mechanism remains unclear. Here, we describe how RA-specific autoantibody deposits can train human monocytes to exert the hyperactive inflammatory response, particularly via the exacerbated release of tumor necrosis factor α (TNFα). Comparative transcriptomic analysis by plate-bound human IgG (cIgG) or β-glucan indicated that metabolic shift towards glycolysis is a crucial mechanism for trained immunity. Moreover, the cIgG-trained gene signatures were enriched in synovial tissues from patients with ACPA- (anticitrullinated protein antibody-) positive arthralgia and undifferentiated arthritis, and early RA and established RA bore a great resemblance to the myeloid pathotype, suggesting a historical priming event in vivo. Additionally, the expression of the cIgG-trained signatures is higher in the female, older, and ACPA-positive populations, with a predictive role in the clinical response to infliximab. We conclude that RA-specific autoantibodies can train monocytes in the inflamed lesion as early as the asymptomatic stage, which may not merely improve understanding of disease progression but may also suggest therapeutic and/or preventive strategies for autoimmune diseases.


Conflict of interest statement

The authors declare no conflict of interest related to this work.

Figures

Figure 1
Figure 1
Schematic overview of in vitro trained immunity model by RA autoantibodies. Freshly isolated CD14+ human monocytes were cultured for 24 h in RPMI 1640 medium in Petri dishes precoated with 10 μg/ml purified ACPA IgG (cACPA/IgG), RF IgM (cRF/IgM), or IVIG (cIgG). Control cells were cultured with RPMI 1640 medium or in the presence of LPS (1 μg/ml). After priming, the monocytes were detached, washed, and subcultured in 96-well plates for resting. Then, the Mo(cACPA/IgG), Mo(cRF/IgM), Mo(cIgG), Mo(control), and Mo(LPS) were stimulated by LPS (10 ng/ml) for 24 h. Cytokines and chemokines in the supernatants from either the priming or stimulation phase were measured by ELISA.
Figure 2
Figure 2
Enhanced LPS response by ACPA IgG-primed monocytes. (a–d) ELISA quantification of TNFα, IL6, CXCL8, and CCL2 in the supernatant during monocyte priming. After priming, the Mo(cACPA/IgG), Mo(cRF/IgM), Mo(cIgG), Mo(control), and Mo(LPS) were treated with LPS (10 ng/ml); monocytes treated in RPMI 1640 medium were used as the control (RPMI). (e–h) ELISA quantification of TNFα, IL6, CXCL8, and CCL2. Each dot represents one donor (n = 6). (i) The Mo(cIgG) and Mo(control) were stimulated with LPS (10 ng/ml) for 2 h, followed by intracellular staining of TNFα. (j) Cells stained with isotype control Abs (filled histogram) were used as negative controls. The MFI of TNFα was compared. Data (mean ± SEM) are from three independent experiments. NS: no statistical significance; ∗P < 0.05, ∗∗P < 0.01, and ∗∗∗P < 0.001. The Kruskal–Wallis test was performed, followed by post hoc testing by Dunn's multiple comparison test, for comparing >2 groups. The Mann–Whitney U test was used for comparing two groups.
Figure 3
Figure 3
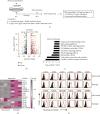
Specific gene signatures of cIgG-trained human monocytes. (a) Schematic workflow of RNA sequencing and analysis of the cIgG-trained monocytes. (b) Volcano plot of 725 DEGs from Mo(cIgG) as compared with Mo(control). (c) Bar plot of KEGG enrichment analysis of DEGs in Mo(cIgG). (d) Heatmap showing the signature cytokine, chemokine, and cellular marker genes expressed in Mo(cIgG) and Mo(control). (e) Flow cytometric analysis of Mo(cIgG) stained with isotype control Abs (filled histogram) and specific markers as indicated (red).
Figure 4
Figure 4
Comparative transcriptomic analysis between cIgG- and β-glucan-trained monocytes. (a) Venn diagram of GSEA of trained monocytes using hallmark gene sets collected in MSigDB v7.0. The five shared hallmark gene sets were glycolysis, cholesterol homeostasis, MYC-targets_V1, MYC-targets_V2, and MTORC1_signaling. (b) Relative gene expression of glycolytic enzymes (HK3, fold change (fc) = 2.1, P = 0.00453; GPI, fc = 1.2, P = 1.75E − 11; PFKP, fc = 2.1, P = 3.07E − 09; PGK1, fc = 1.2, P = 2.39E − 09; GAPDH, fc = 1.5, P = 0; ALDOA, fc = 1.4, P = 2.16E − 11; PGAM1, fc = 1.5, P = 7.34E − 09; ENO, fc = 1.5, P = 0.00442; and PKM, fc = 1.6, P = 2.86E − 10) was defined by FPKM (fragments per kilobase of exon model per million reads mapped) values from RNA sequencing (GSE102728) as compared between the Mo(cIgG) and Mo(control). Data (mean ± SEM) are from three independent experiments. P values indicate the posterior probability of differential expression (PPDE). (c) Glycolysis pathway from glucose to lactate. Fold changes in glycolytic enzymes were compared between cIgG-trained and control cells, as labeled in red.
Figure 5
Figure 5
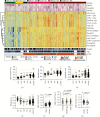
cIgG-trained signatures enriched in synovial biopsies. (a) Heatmap showing hierarchical clustering according to disease status, pathotype, cell-specific gene score, and clinical information. The synovial samples were from healthy donors (HC, n = 28) and from patients with osteoarthritis (OA, n = 22), arthralgia (AR, n = 10), undifferentiated arthritis (UA, n = 6), early RA (eRA, n = 57), and established RA (est.RA, n = 95). (b–e) Enriched scores of cIgG-trained monocytes and three pathotypes among the groups. Comparison of cIgG-trained scores in groups according to (f) sex, (g) age, and (h) ACPA status is shown. Each dot represents one donor. NS: no statistical significance; ∗P < 0.05, ∗∗P < 0.01, and ∗∗∗P < 0.001. The Kruskal–Wallis test, followed by post hoc testing by Dunn's multiple comparison test, was used for comparing >2 groups. The Mann–Whitney U test was used for comparing two groups.
Figure 6
Figure 6
Correlation of RA synovial pathotypes with immune cells. (a) The relationship between the three RA synovial pathotypes, i.e., lymphoid, fibroid, and myeloid, and immune cells, represented by nodes. The interaction profile is shown in the links (lines) between the nodes, and the strength is highlighted by the thickness of the lines and the color. Red and blue lines indicate positive and negative correlations, respectively. (b) Correlation matrix for M1, M2, cIgG-trained monocytes, neutrophils, eosinophils, basophils, and CD34+ progenitors. Pearson correlation coefficients are indicated. ∗∗∗P < 0.001.
Figure 7
Figure 7
cIgG-trained signatures correlate with clinical response to infliximab therapy. Analysis of synovial tissue transcriptome from 62 RA patients in GSE21537 before the initiation of infliximab (anti-TNFα treatment). The clinical outcome by infliximab at 16 weeks was defined by EULAR response criteria. Scores versus EULAR responses are plotted for (a) cIgG-trained scores and the synovial (b) myeloid, (c) lymphoid, and (d) fibroid pathotypes. The Kruskal–Wallis test was performed, followed by post hoc testing by Dunn's multiple comparison test.

Similar articles

Cited by

References

    1. Quintin J., Saeed S., Martens J. H. A., et al. Candida albicans infection affords protection against reinfection via functional reprogramming of monocytes. Cell Host & Microbe. 2012;12(2):223–232. doi: 10.1016/j.chom.2012.06.006. - DOI - PMC - PubMed
    1. Saeed S., Quintin J., Kerstens H. H. D., et al. Epigenetic programming of monocyte-to-macrophage differentiation and trained innate immunity. Science. 2014;345(6204):1251086–1251086. doi: 10.1126/science.1251086. - DOI - PMC - PubMed
    1. Cheng S.-C., Quintin J., Cramer R. A., et al. mTOR- and HIF-1-mediated aerobic glycolysis as metabolic basis for trained immunity. Science. 2014;345(6204):p. 1250684. doi: 10.1126/science.1250684. - DOI - PMC - PubMed
    1. Bekkering S., Blok B. A., Joosten L. A. B., Riksen N. P., van Crevel R., Netea M. G. In vitro experimental model of trained innate immunity in human primary monocytes. Clinical and Vaccine Immunology. 2016;23(12):926–933. doi: 10.1128/CVI.00349-16. - DOI - PMC - PubMed
    1. Crișan T. O., Cleophas M. C. P., Oosting M., et al. Soluble uric acid primes TLR-induced proinflammatory cytokine production by human primary cells via inhibition of IL-1Ra. Annals of the Rheumatic Diseases. 2016;75(4):755–762. doi: 10.1136/annrheumdis-2014-206564. - DOI - PubMed