Decrease in Chitinase 3-Like Protein 1 Levels Reflects Improvement in Liver Fibrosis after HCV Eradication
- PMID: 33082884
- PMCID: PMC7556050
- DOI: 10.1155/2020/8539804
Decrease in Chitinase 3-Like Protein 1 Levels Reflects Improvement in Liver Fibrosis after HCV Eradication
Abstract
Aim: The success of direct-acting antivirals (DAAs) against hepatitis C virus is a major breakthrough in hepatology. Previous studies have shown that chitinase 3-like protein 1 (CHI3L1) was a marker for staging of liver fibrosis caused by HCV. In this investigation, we used CHI3L1 as a surrogate marker to compare dynamic hepatic fibrosis variations following the elimination of HCV among cases receiving sofosbuvir (SOF)-based regimens and pegylated interferon/ribavirin (PR) treatments.
Methods: The study enrolled 105 patients, including 46 SOF-based regimens treated patients, 34 PR-experienced patients, and 25 untreated patients. Serum samples and clinical data were obtained at the baseline, the end of treatment, and at weeks 24 and 48 after treatments.
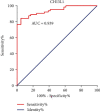
Results: First, we found that serum level of CHI3L1 correlated moderately but significantly with LSM (r = 0.615, P < 0.001) at the baseline, and diagnosed liver cirrhosis at baseline with high accuracy (AUC = 0.939) by ROC analysis. So we explored CHI3L1 as a sensitive biomarker to monitor the regression of liver fibrosis after HCV eradication. We found that the serum CHI3L1 level of CHC cases receiving SOF-based regimen treatments was markedly reduced immediately after treatment compared with that at the baseline (123.79 (118.55) vs. 118.20 (103.68), P = 0.001). For cases undergoing PR treatment, the serum CHI3L1 decreased significantly at week 24 posttreatment compared with that at the baseline (69.98 (51.44) vs 89.15 (110.59), P = 0.016). For the untreated cirrhotic patients, CHI3L1 levels increased at week 96 follow-up compared with that at the baseline (194.73 (172.46) vs. 89.50 (242.97), P = 0.048), reflecting continued worsening of liver fibrosis.
Conclusion: CHI3L1 is suggested to be the sensitive marker to monitor fibrosis variations in weeks during treatments and after achieving SVR. It has the potential to allow the identification of early treatment failure for a timely switch to alternative treatment and to allow monitoring progression of fibrosis as a risk factor for liver cirrhosis.
Copyright © 2020 Qian Kang et al.
Conflict of interest statement
There are no conflicts of interest declared by the authors for this study.
Figures


References
-
- Committee T. G. R. Guidelines for the Care and Treatment of Persons Diagnosed with Chronic Hepatitis C Virus Infection. Geneva: World Health Organization; 2018. WHO guidelines approved by the guidelines review committee. - PubMed
MeSH terms
Substances
LinkOut - more resources
Full Text Sources
Medical
Research Materials

