

The Effect of Hedysarum multijugum Maxim.- Chuanxiong rhizoma Compound on Ischemic Stroke: A Research Based on Network and Experimental Pharmacology
- PMID: 33082911
- PMCID: PMC7558800
- DOI: 10.1155/2020/6072380
The Effect of Hedysarum multijugum Maxim.- Chuanxiong rhizoma Compound on Ischemic Stroke: A Research Based on Network and Experimental Pharmacology
Abstract
Background: Hedysarum multijugum Maxim.-Chuanxiong rhizoma compound (HCC) is a common herbal formula modified from Buyang Huanwu decoction. Clinical trials have demonstrated its therapeutic potential for ischemic stroke (IS). However, the mechanism of HCC remains unclear.
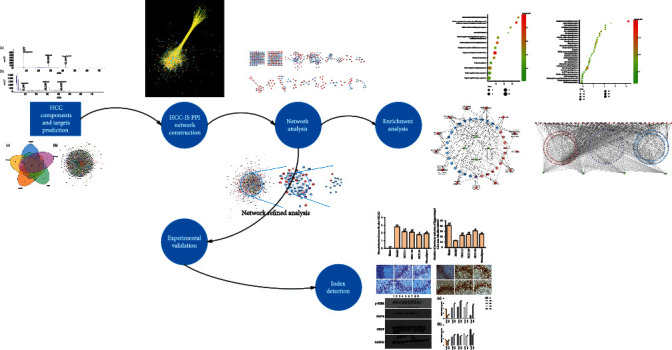
Methods: The HCC's components were collected from the TCMSP database and TCM@Taiwan database. After that, the HCC's compound targets were predicted by PharmMapper. The IS-related genes were obtained from GeneCards, and OMIM and the protein-protein interaction (PPI) data of HCC's targets and IS genes were obtained from the String database. After that, the DAVID platform was applied for Gene Ontology (GO) enrichment analysis and pathway enrichment analysis and the Cytoscape 3.7.2 was utilized to construct and analyze the networks. Finally, a series of animal experiments were carried out to validate the prediction results of network pharmacology. The expressions of GRP78, p-PERK, and CHOP proteins and mRNAs in different time periods after HCC intervention were detected by Western blot, immunohistochemistry, and RT-qPCR.
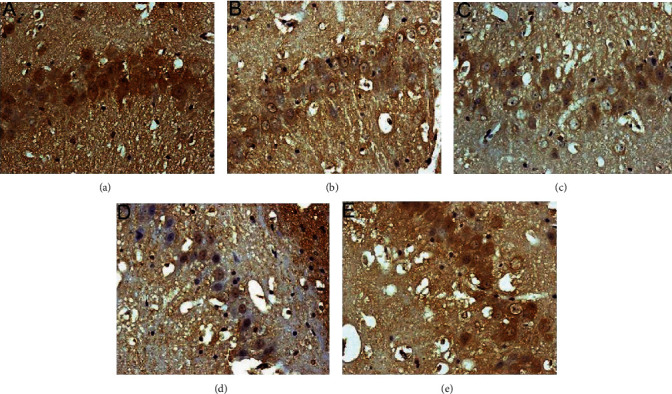
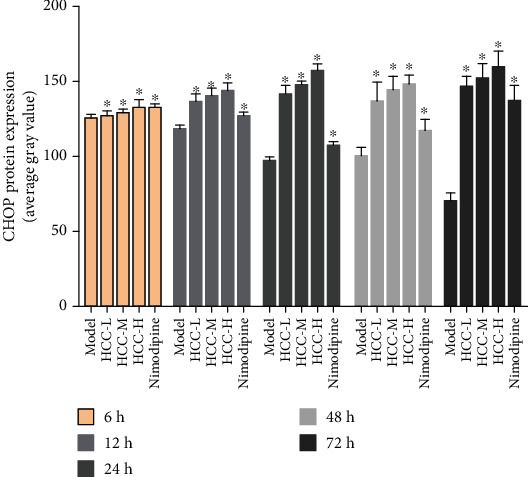
Results: A total of 440 potential targets and 388 IS genes were obtained. The results of HCC-IS PPI network analysis showed that HCC may regulate IS-related targets (such as ALB, AKT1, MMP9, IGF1, and CASP3), biological processes (such as endoplasmic reticulum stress, inflammation modules, hypoxia modules, regulation of neuronal apoptosis and proliferation, and angiogenesis), and signaling pathways (such as PI3K-Akt, FoxO, TNF, HIF-1, and Rap1 signaling). The animal experiments showed that HCC can improve the neurobehavioral scores and protect the neurons of IS rats (P < 0.05). HCC inhibited the expression of p-PERK in the PERK pathway from 12 h after surgery, significantly promoted the expression of GRP78 protein, and inhibited the expression of CHOP protein after surgery, especially at 24 h after surgery (P < 0.05). The results of RT-qPCR showed that HCC can significantly reduce the expression of CHOP mRNA in the neurons in the CA1 region of the hippocampus 72 h after MCAO (P < 0.05).
Conclusion: HCC may achieve a role in the treatment of IS by intervening in a series of targets, signaling pathways, and biological processes such as inflammation, oxidative stress, endoplasmic reticulum stress, and angiogenesis.
Copyright © 2020 Kailin Yang et al.
Conflict of interest statement
We declare no competing interests.
Figures


Similar articles
-
Exploring the Regulatory Mechanism of Hedysarum Multijugum Maxim.-Chuanxiong Rhizoma Compound on HIF-VEGF Pathway and Cerebral Ischemia-Reperfusion Injury's Biological Network Based on Systematic Pharmacology.Front Pharmacol. 2021 Jun 25;12:601846. doi: 10.3389/fphar.2021.601846. eCollection 2021. Front Pharmacol. 2021. PMID: 34248611 Free PMC article.
-
A network pharmacology approach to investigate the mechanism of Shuxuening injection in the treatment of ischemic stroke.J Ethnopharmacol. 2020 Jul 15;257:112891. doi: 10.1016/j.jep.2020.112891. Epub 2020 Apr 18. J Ethnopharmacol. 2020. PMID: 32315738
-
Elucidating the mechanisms of Buyang Huanwu Decoction in treating chronic cerebral ischemia: A combined approach using network pharmacology, molecular docking, and in vivo validation.Phytomedicine. 2024 Sep;132:155820. doi: 10.1016/j.phymed.2024.155820. Epub 2024 Jun 24. Phytomedicine. 2024. PMID: 39004032
-
Network Pharmacology-Based Strategy Reveals the Effects of Hedysarum multijugum Maxim.-Radix Salviae Compound on Oxidative Capacity and Cardiomyocyte Apoptosis in Rats with Diabetic Cardiomyopathy.Biomed Res Int. 2020 Oct 17;2020:8260703. doi: 10.1155/2020/8260703. eCollection 2020. Biomed Res Int. 2020. PMID: 33134388 Free PMC article.
-
Exploration of the mechanism of Zisheng Shenqi decoction against gout arthritis using network pharmacology.Comput Biol Chem. 2021 Feb;90:107358. doi: 10.1016/j.compbiolchem.2020.107358. Epub 2020 Aug 8. Comput Biol Chem. 2021. PMID: 33243703 Review.
Cited by
-
Deciphering Pharmacological Mechanism of Buyang Huanwu Decoction for Spinal Cord Injury by Network Pharmacology Approach.Evid Based Complement Alternat Med. 2021 Apr 22;2021:9921534. doi: 10.1155/2021/9921534. eCollection 2021. Evid Based Complement Alternat Med. 2021. PMID: 33976706 Free PMC article.
-
Jingfang granules protects against intracerebral hemorrhage by inhibiting neuroinflammation and protecting blood-brain barrier damage.Aging (Albany NY). 2024 May 28;16(10):9023-9046. doi: 10.18632/aging.205854. Epub 2024 May 28. Aging (Albany NY). 2024. PMID: 38809507 Free PMC article.
-
Evaluation of the Pharmaceutical Activities of Chuanxiong, a Key Medicinal Material in Traditional Chinese Medicine.Pharmaceuticals (Basel). 2024 Aug 31;17(9):1157. doi: 10.3390/ph17091157. Pharmaceuticals (Basel). 2024. PMID: 39338320 Free PMC article. Review.
-
Exploring the effect of Gouqi Nuzhen Liuhe decoction on the PI3K/mTOR signaling pathway for premature ovarian insufficiency based on system pharmacology.Heliyon. 2024 Jun 14;10(12):e33105. doi: 10.1016/j.heliyon.2024.e33105. eCollection 2024 Jun 30. Heliyon. 2024. PMID: 38994091 Free PMC article.
-
Wenfei Buqi Tongluo Formula Against Bleomycin-Induced Pulmonary Fibrosis by Inhibiting TGF-β/Smad3 Pathway.Front Pharmacol. 2022 Jan 21;12:762998. doi: 10.3389/fphar.2021.762998. eCollection 2021. Front Pharmacol. 2022. PMID: 35126110 Free PMC article.
References
-
- Huang C. Y. Nutrition and stroke. Asia Pacific journal of clinical nutrition. 2007;16(Supplement 1):266–274. - PubMed
MeSH terms
Substances
LinkOut - more resources
Full Text Sources
Medical
Research Materials
Miscellaneous
