. 2020 Oct 6:9:172.
doi: 10.1038/s41377-020-00404-6. eCollection 2020.

Incoherent excess noise spectrally encodes broadband light sources

Affiliations

Incoherent excess noise spectrally encodes broadband light sources

Aaron M Kho et al. Light Sci Appl. .

Abstract

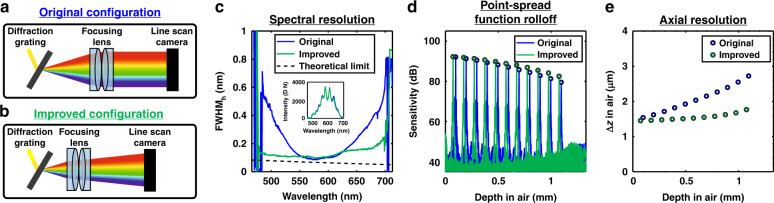
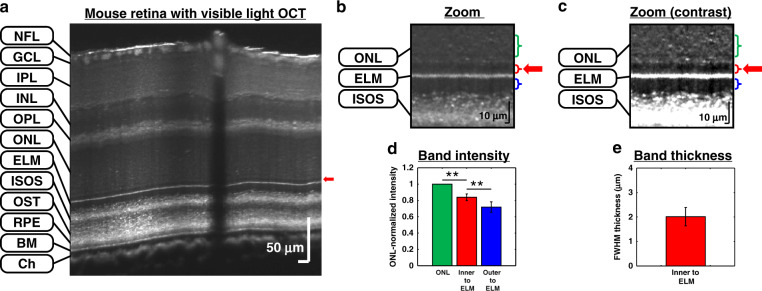
Across optics and photonics, excess intensity noise is often considered a liability. Here, we show that excess noise in broadband supercontinuum and superluminescent diode light sources encodes each spectral channel with unique intensity fluctuations, which actually serve a useful purpose. Specifically, we report that excess noise correlations can both characterize the spectral resolution of spectrometers and enable cross-calibration of their wavelengths across a broad bandwidth. Relative to previous methods that use broadband interferometry and narrow linewidth lasers to characterize and calibrate spectrometers, our approach is simple, comprehensive, and rapid enough to be deployed during spectrometer alignment. First, we employ this approach to aid alignment and reduce the depth-dependent degradation of the sensitivity and axial resolution in a spectrometer-based optical coherence tomography (OCT) system, revealing a new outer retinal band. Second, we achieve a pixel-to-pixel correspondence between two otherwise disparate spectrometers, enabling a robust comparison of their respective measurements. Thus, excess intensity noise has useful applications in optics and photonics.

Keywords: Biophotonics; Imaging and sensing; Optical spectroscopy.


Conflict of interest statement

Conflict of interestV.J.S. receives royalties from Optovue, Inc. The remaining authors declare that they have no conflict of interest.

Figures

Fig. 1
Fig. 1. Spectrometer characterization and calibration methods.
a Typical spectrometer. Collimated light is spectrally dispersed by the diffraction grating and focused onto a linear sensor. b The narrow linewidth source method requires a narrowband light source for each wavelength to be assessed (top). The measured spectrum output, Sout(λ), is the superposition integral of the true spectrum input, Sin(λ), and the spectrometer impulse response, h(λ, Δλ): Sout(λ)=Sin(Λ)h(Λ,λΛ)dΛ. If the input approximates a delta function, then the output, Sout(λ), resembles h(λ, Δλ) (bottom). c The broadband interferometry method requires an auxiliary interferometer to create an oscillating interferometric input, Sin(λ) (top). The spectrometer reduces the oscillations in the output, Sout(λ), depending on the impulse response (bottom). See Supplementary Note 6 for a complete description. d In the proposed excess noise method for characterization, an appropriate broadband light source is required (top). The output, Nout(λ), is the superposition integral of the excess noise input, Nin(λ), and h(λ, Δλ). For white noise input, the input autocorrelation matrix, Rin(λ1, λ2), is diagonal. The output autocorrelation matrix, Rout(λ1, λ2), is quasi-diagonal, with broadening depending on the local impulse response (bottom). e In the related method for cross-calibration, an appropriate broadband light source and a coupler are required (top). The excess noise outputs from spectrometers A and B, NA,out(xA) and NB,out(xB), respectively, are cross-correlated to yield RAB,out(xA, xB), where the highest correlation values occur for pixels that measure similar wavelengths (bottom)
Fig. 2
Fig. 2. Excess noise autocorrelation can characterize spectrometers.
a Excess noise autocorrelation matrix from a previously reported visible light OCT spectrometer. The zoom-ins of the autocorrelation matrix show a thinner quasi-diagonal at central wavelengths than at peripheral wavelengths in the spectrum. b The spectral resolution measured from this autocorrelation matrix with the proposed method agrees well with the conventional interferometry and narrowband laser calibration method results. c Vertical shifting of the sensor (as depicted in Fig. 1a), relative to the optimal position, mainly changes the intensity measured by the pixels (dots). Shift 1 denotes the smallest shift, while shift 3 denotes the largest shift from the optimal position. Due to the small magnitude of the shift relative to the translation stage screw pitch, the shifts were not precisely measured. d Axial shifting of the sensor (as depicted in Fig. 1a) towards the focusing lens, relative to the optimal position, mainly changes the spectral resolution. The subplot shows the summed total spectrum intensity for each shift normalized to the total spectrum intensity at the optimal position
Fig. 3
Fig. 3. Quasi-real-time characterization improves the OCT spectrometer alignment.
a Original spectrometer configuration with the diffraction grating at the back focal plane of the focusing lens. b Improved spectrometer configuration enabled by monitoring the spectral resolution during the alignment process. c The spectral resolution was noticeably more uniform across the spectrum in the improved configuration, though the measured spectrum intensities of both configurations, with an input power into the spectrometer of 1.55 μW, were indistinguishable (inset). The OCT point spread function rolloff (d) and axial resolution degradation versus depth (e) demonstrate a marked improvement
Fig. 4
Fig. 4. Visible light OCT visualizes a new outer retinal band with an improved spectrometer.
a Cross-sectional linear-scaled image of a pigmented mouse retina, acquired by a visible light OCT system with a spectrometer aligned using excess noise correlations (Figs. 2 and 3). A total of 1024 frames, acquired over 17.5 s with a 0.12 mm offset along the slow axis, were averaged. The red arrow indicates a dark band inner to the ELM. b Linear-scaled, outer retinal zoomed-in view showing the newly visualized dark band (red arrow). c Contrast-enhanced zoomed-in view on a linear scale. d The ONL-normalized intensity of the dark band inner to the ELM (red brackets in b, c) is significantly different from 1 and from that of the inner segments (blue brackets in b, c) in six mice (The ONL region for normalization is denoted by green brackets in b, c). e The thickness of this dark band, taken as the FWHM of a fitted Gaussian, was ~2 μm in six mice. Error bars represent standard deviations across subjects (**p < 0.05). Note that no error bars are shown for the ONL in d due to normalization. (NFL: nerve fiber layer; GCL: ganglion cell layer; IPL: inner plexiform layer; INL: inner nuclear layer; OPL: outer plexiform layer; ONL: outer nuclear layer; ELM: external limiting membrane; ISOS: inner segment/outer segment junction; OST: photoreceptor outer segment tips; RPE: retinal pigment epithelium; BM: Bruch’s membrane; Ch: choroid)
Fig. 5
Fig. 5. Excess noise cross-correlation can cross-calibrate spectrometers.
a Excess noise cross-correlation matrix for two spectrometers with different spectral bandwidths: an already-calibrated spectrometer A (Figs. 2 and 3) and spectrometer B (see Supplementary Note 10), which had to be calibrated de nuovo. b Pixel correspondence between the two spectrometers. For each spectrometer A pixel (row), the spectrometer B pixel that yields the largest normalized excess noise cross-correlation matrix value (a) corresponds best in wavelength. The spectrometer A pixel position of maximum correlation for each spectrometer B pixel was estimated using Gaussian fitting for subpixel accuracy. c, d The inter-spectrometer calibration was validated with a green (~532 nm) laser and a red (~635 nm) laser, respectively, with subpixel estimates of the centroids of the laser distributions. The errors calculated as the shortest distances in pixels to the validation values (cross centers in c, d) range from 10–21% of a pixel. The errors calculated by the difference in assigned wavelengths are 0.013 nm for both narrowband lasers. e Thus, using this method, given wavelength calibration of spectrometer A, spectrometer B can be accurately calibrated

Similar articles

Cited by

References

    1. Fercher AF, et al. Measurement of intraocular distances by backscattering spectral interferometry. Opt. Commun. 1995;117:43–48. doi: 10.1016/0030-4018(95)00119-S. - DOI
    1. Lu GL, Fei BW. Medical hyperspectral imaging: a review. J. Biomed. Opt. 2014;19:010901. doi: 10.1117/1.JBO.19.1.010901. - DOI - PMC - PubMed
    1. Long DA. Raman Spectroscopy. New York: McGraw-Hill; 1977.
    1. Reeves JB., III Near-versus mid-infrared diffuse reflectance spectroscopy for soil analysis emphasizing carbon and laboratory versus on-site analysis: Where are we and what needs to be done? Geoderma. 2010;158:3–14. doi: 10.1016/j.geoderma.2009.04.005. - DOI
    1. Bol’Shakov AA, et al. Laser-induced breakdown spectroscopy in industrial and security applications. Appl. Opt. 2010;49:C132–C142. doi: 10.1364/AO.49.00C132. - DOI