. 2020 Oct 1:7:167.
doi: 10.1038/s41438-020-00387-w. eCollection 2020.

Depicting the battle between nectarine and Monilinia laxa: the fruit developmental stage dictates the effectiveness of the host defenses and the pathogen's infection strategies

Affiliations

Depicting the battle between nectarine and Monilinia laxa: the fruit developmental stage dictates the effectiveness of the host defenses and the pathogen's infection strategies

Marta Balsells-Llauradó et al. Hortic Res. .

Abstract

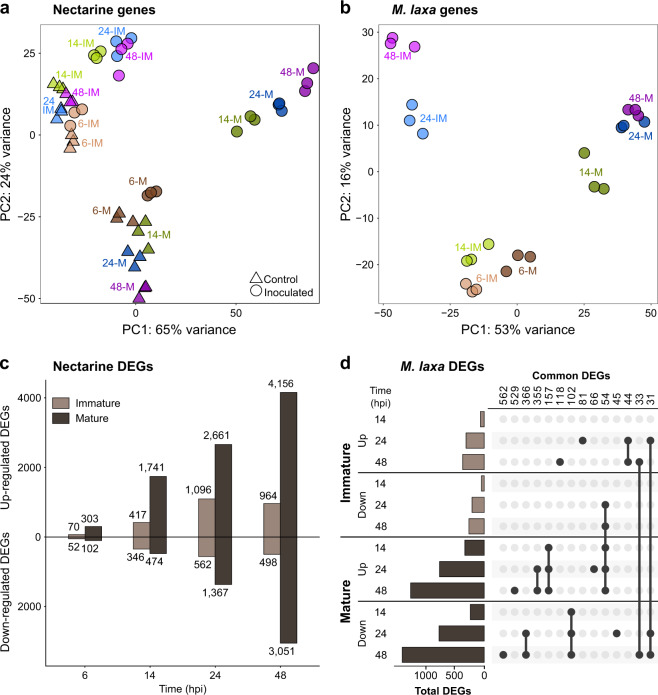
Infections by the fungus Monilinia laxa, the main cause of brown rot in Europe, result in considerable losses of stone fruit. Herein, we present a comprehensive transcriptomic approach to unravel strategies deployed by nectarine fruit and M. laxa during their interaction. We used M. laxa-inoculated immature and mature fruit, which was resistant and susceptible to brown rot, respectively, to perform a dual RNA-Seq analysis. In immature fruit, host responses, pathogen biomass, and pathogen transcriptional activity peaked at 14-24 h post inoculation (hpi), at which point M. laxa appeared to switch its transcriptional response to either quiescence or death. Mature fruit experienced an exponential increase in host and pathogen activity beginning at 6 hpi. Functional analyses in both host and pathogen highlighted differences in stage-dependent strategies. For example, in immature fruit, M. laxa unsuccessfully employed carbohydrate-active enzymes (CAZymes) for penetration, which the fruit was able to combat with tightly regulated hormone responses and an oxidative burst that challenged the pathogen's survival at later time points. In contrast, in mature fruit, M. laxa was more dependent on proteolytic effectors than CAZymes, and was able to invest in filamentous growth early during the interaction. Hormone analyses of mature fruit infected with M. laxa indicated that, while jasmonic acid activity was likely useful for defense, high ethylene activity may have promoted susceptibility through the induction of ripening processes. Lastly, we identified M. laxa genes that were highly induced in both quiescent and active infections and may serve as targets for control of brown rot.

Keywords: Biotic; Fungal genetics; Transcriptomics.


Conflict of interest statement

Conflict of interestThe authors declare that they have no conflict of interest.

Figures

Fig. 1
Fig. 1. Fungal behavior development in “Venus” nectarines.
a Brown rot spread development in immature and mature tissues at different time points after inoculation (6, 14, 24, 48, and 72 hpi). Two different viewpoints are shown (left image—entire fruit showing 6 drops; right image—perpendicular section of the fruit to discern fungus penetration if observable). b Determination of pathogen biomass by relative gene expression of the M. laxa reference gene (ACT), normalized to the expression of the nectarine reference gene (TEF2) in both stages (immature and mature) of both control (light brown) and inoculated (dark brown) tissues. The box plot represents the mean of three biological replicates with its interquartile range. Lowercase and uppercase letters indicate significance differences (P < 0.05, Student’s T test) in control and inoculated tissues, respectively. c Abundance (%) of M. laxa mapped reads in inoculated tissue out of the total amount of reads at each time point in both tissues. Each dot represents the number of mapped reads for each of the three biological replicates. The dashed line represents the average of the mapped reads in each group. Numbers represent the average of genes that were obtained at each time point in both tissues
Fig. 2
Fig. 2. Nectarine and M. laxa gene expression profiles.
a, b Patterns of gene expression represented by principal component analysis (PCA) plots of normalized count matrices for nectarine (a) and M. laxa (b), generated by DESeq2 through differential expression analysis for both control (△) and inoculated tissue (◯). Labels indicate the time point (6, 14, 24, and 48 hpi) in both immature (IM) and mature (M) stage. c Amount of nectarine differentially expressed genes (DEGs) as a result of the pairwise comparison of inoculated vs control tissue obtained in DESeq2 (P-adj value ≤0.05). The upper part shows the upregulated DEGs and the lower, the downregulated ones, of all the four time points analyzed for the immature (light brown) and the mature (dark brown). The number of DEGs in each set are shown. d Amount of M. laxa DEGs obtained through pairwise comparisons between 14, 24, and 48 hpi compared to 6 hpi in both immature (light brown) and mature (dark brown) tissue. The highest groups of DEGs number in each set are indicated. Dots and lines represent the common DEGs that were found between time points in each stage
Fig. 3
Fig. 3. KEGG enrichments of upregulated genes in nectarine.
a Metabolic pathways from the KEGG database that were found in at least half of the eight comparisons obtained in the differential expression analyses (inoculated vs control). The dot size represents the log of the inverted P-adj value obtained in the KEGG enrichment analyses along with all the time points in both stages (P-adj value ≤0.05) (Supplementary Table S3). b The magnitude of the fruit response in terms of the number of DEGs that have KEGG annotations for the selected metabolic pathways in both stages through time. Each color represents one different KEGG pathway
Fig. 4
Fig. 4. Activation of jasmonic and ethylene pathways in nectarine fruit after inoculations with M.laxa.
a, b Jasmonic acid and ethylene pathways are shown with substrates (◯) and enzymes (boxes) and include 32 and 41 DEGs for JA and ET, respectively. The scale color of the heat maps represents the intensity of the significant expression changes (Log2FC), which resulted from the pairwise comparison of inoculated vs control samples (P-adj value ≤0.05). Paralogs of each analyzed enzyme are represented in columns and grouped by their expression in immature (left boxes) and mature (right boxes) at each time point (hpi). Dashed lines indicated that some steps had been omitted. PM plasmatic membrane, NM nucleus membrane, ER endoplasmic reticulum, CL chloroplast, PR peroxisome. Enzyme abbreviations and lists of paralogs genes for each protein are provided (Supplementary Table S3). c Ethylene measurements of the nectarine–M. laxa pathosystem through time. Values represent the mean (n = 4) and the vertical bars, the standard error. Symbols (*) indicate significant differences according to Student’s T test (P ≤ 0.05). Uppercase and lowercase letters indicate significant differences (P ≤ 0.05, Tukey’s test) in control and inoculated tissues, respectively
Fig. 5
Fig. 5. Summary of functional annotations and functional enrichments of M.laxa.
a De novo functional annotations in all M. laxa transcripts obtained (9581) (Supplementary Table S4). Each category is represented by the proportion (%) of annotated transcripts across M. laxa transcriptome and the specific number of DEGs next to the bar. Pfam protein family database, GO gene ontology, PHI pathogen–host interaction, TCDB transporter classification database, SignalP presence of secretion signal peptides, CAZy carbohydrate-active enzyme, fPox fungal peroxidases. b Enrichment of functional categories across all time points in both tissues. Pairwise comparisons were performed between 14, 24, or 48 hpi compared to 6 hpi, for each maturation stage. The dot size represents their significance (log of the inverted P-adj value) obtained in Fisher tests. c The magnitude of M. laxa response in terms of number of DEGs (P-adj ≤ 0.05) that have GO terms for some relevant terms in both stages along time. Each color represents one different GO term. d Pfam enrichments of M. laxa genes that were overexpressed in 14, 24, and/or 48 hpi compared to 6 hpi, for each stage, obtained in DESeq2 (P-adj value ≤0.05) (Supplementary Table S4). The color scale of the heat maps represents the log of the inverted P-adj value. The number of DEGs in each Pfam are also shown

References

    1. Rungjindamai N, Jeffries P, Xu XM. Epidemiology and management of brown rot on stone fruit caused by Monilinia laxa. Eur. J. Plant Pathol. 2014;140:1–17. doi: 10.1007/s10658-014-0452-3. - DOI
    1. Martini, C. & Mari, M. Monilinia fructicola, Monilinia laxa (Monilinia Rot, Brown Rot). In (ed. Silvia Bautista-Baños) Postharvest Decay: Control Strategies 233–265 (Elsevier, 2014).
    1. RosBREED. RosBREED peach brown rot. https://www.rosbreed.org/node/424 (Accessed January 16, 2020).
    1. Usall J, Casals C, Sisquella M, Palou L, De Cal A. Alternative technologies to control postharvest diseases of stone fruits. Stewart Postharvest Rev. 2015;11:1–6.
    1. Byrne, D. H. Fruit Breeding. Fruit Breeding, Handbook of Plant Breeding (Springer US, 2012).