. 2020 Oct 13:8:37.
doi: 10.1038/s41413-020-00108-y. eCollection 2020.

LIM domain proteins Pinch1/2 regulate chondrogenesis and bone mass in mice

Affiliations

LIM domain proteins Pinch1/2 regulate chondrogenesis and bone mass in mice

Yiming Lei et al. Bone Res. .

Abstract

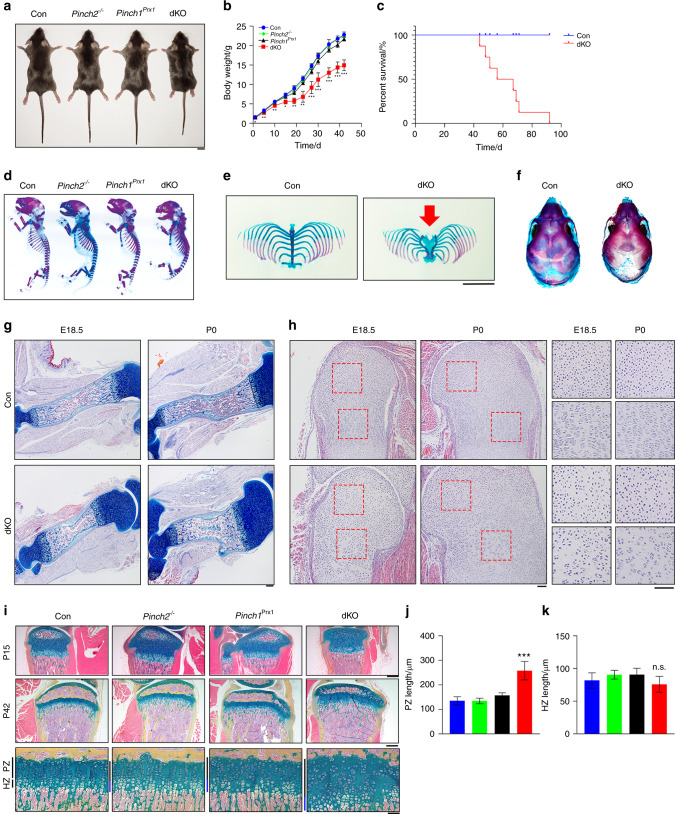
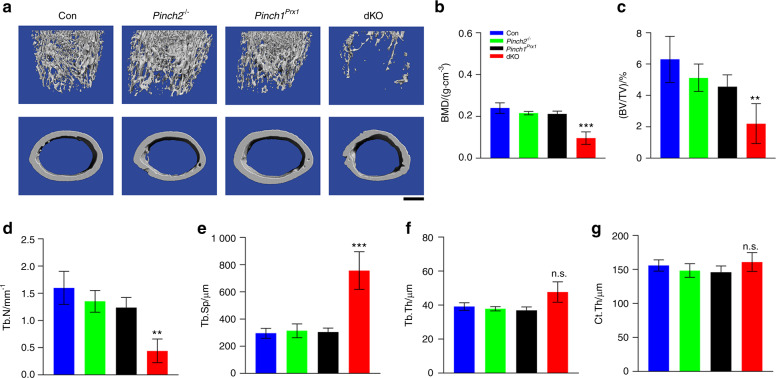
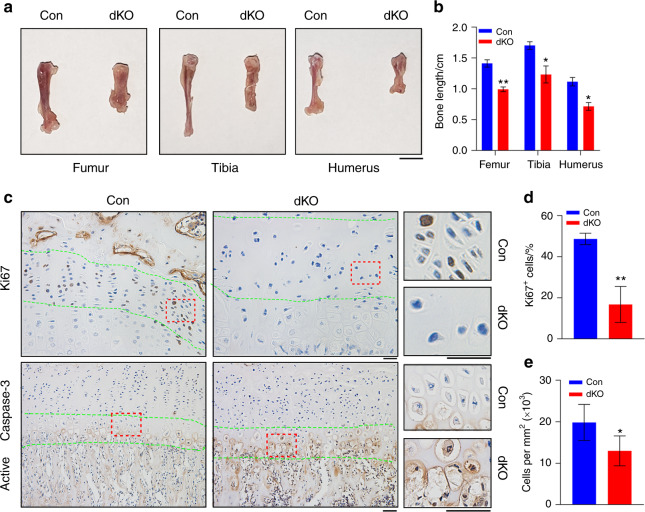
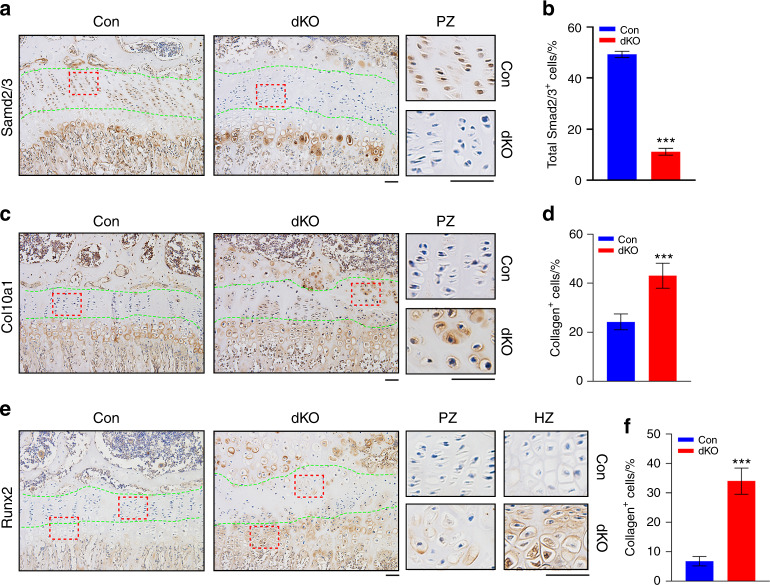
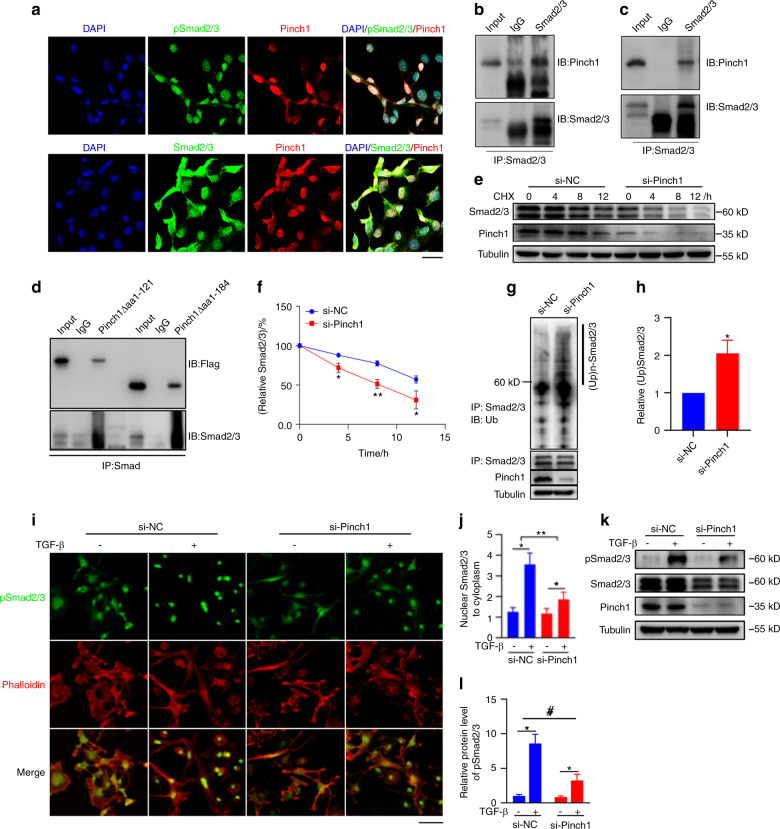
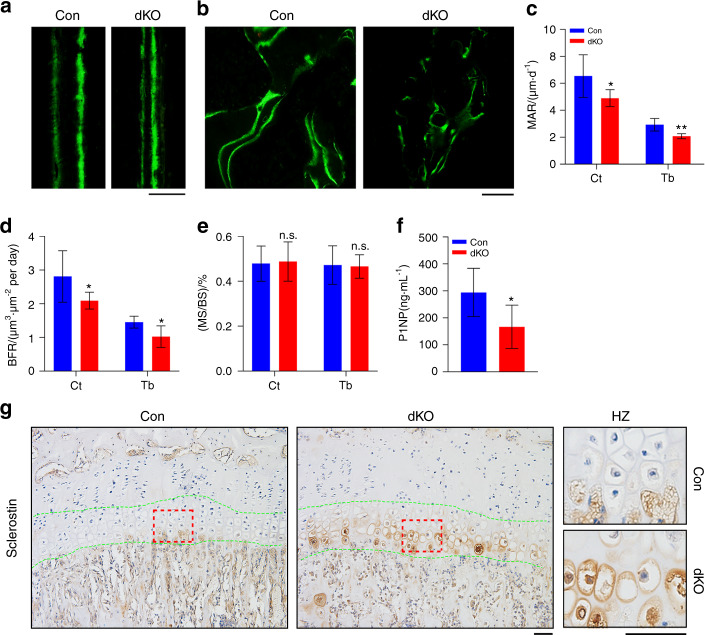
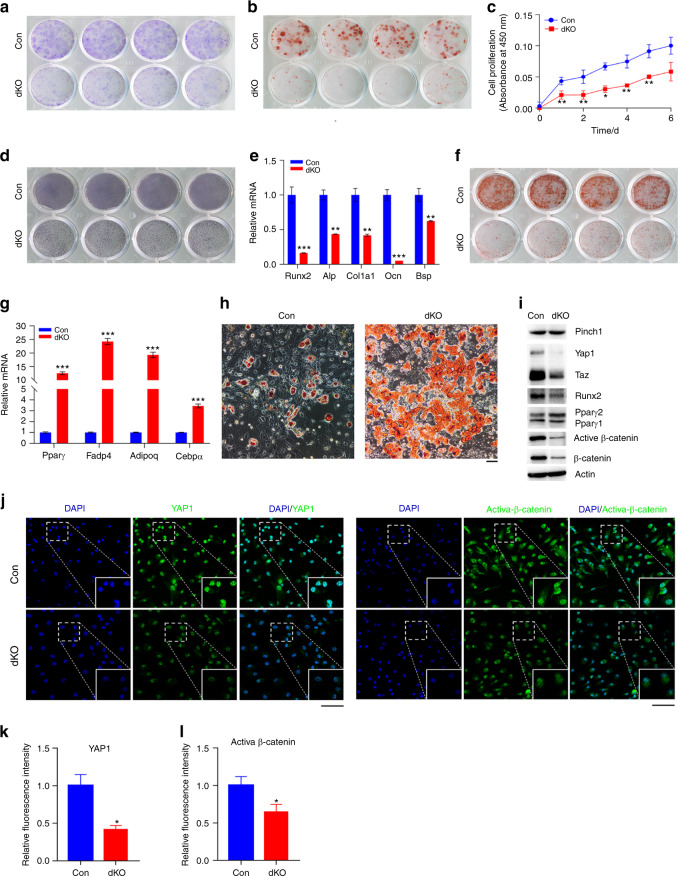
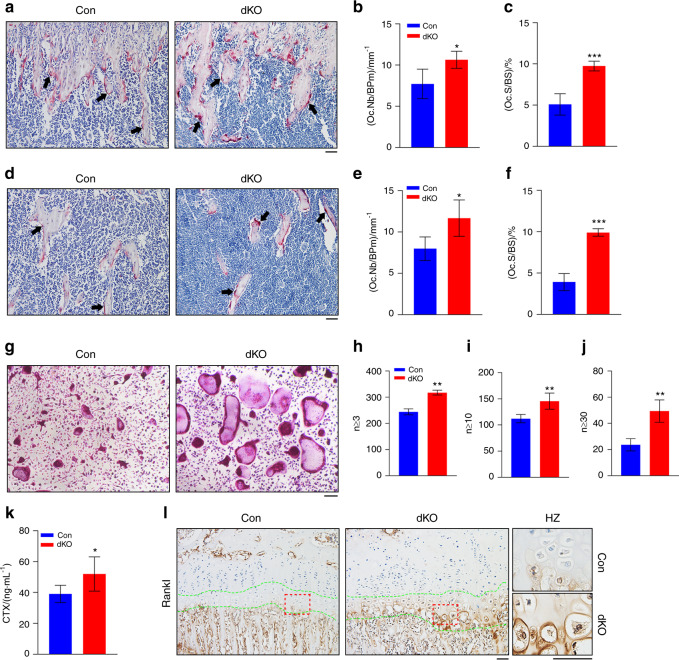
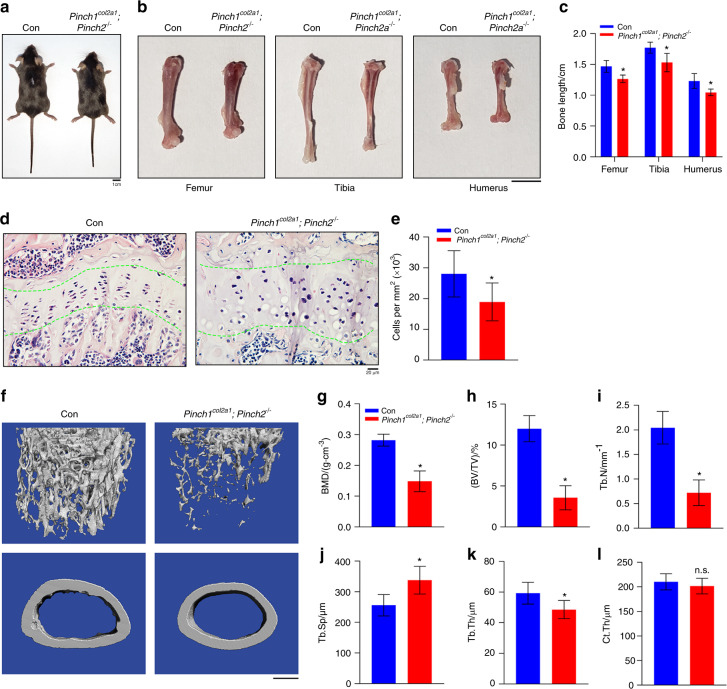
The LIM domain-containing proteins Pinch1/2 regulate integrin activation and cell-extracellular matrix interaction and adhesion. Here, we report that deleting Pinch1 in limb mesenchymal stem cells (MSCs) and Pinch2 globally (double knockout; dKO) in mice causes severe chondrodysplasia, while single mutant mice do not display marked defects. Pinch deletion decreases chondrocyte proliferation, accelerates cell differentiation and disrupts column formation. Pinch loss drastically reduces Smad2/3 protein expression in proliferative zone (PZ) chondrocytes and increases Runx2 and Col10a1 expression in both PZ and hypertrophic zone (HZ) chondrocytes. Pinch loss increases sclerostin and Rankl expression in HZ chondrocytes, reduces bone formation, and increases bone resorption, leading to low bone mass. In vitro studies revealed that Pinch1 and Smad2/3 colocalize in the nuclei of chondrocytes. Through its C-terminal region, Pinch1 interacts with Smad2/3 proteins. Pinch loss increases Smad2/3 ubiquitination and degradation in primary bone marrow stromal cells (BMSCs). Pinch loss reduces TGF-β-induced Smad2/3 phosphorylation and nuclear localization in primary BMSCs. Interestingly, compared to those from single mutant mice, BMSCs from dKO mice express dramatically lower protein levels of β-catenin and Yap1/Taz and display reduced osteogenic but increased adipogenic differentiation capacity. Finally, ablating Pinch1 in chondrocytes and Pinch2 globally causes severe osteopenia with subtle limb shortening. Collectively, our findings demonstrate critical roles for Pinch1/2 and a functional redundancy of both factors in the control of chondrogenesis and bone mass through distinct mechanisms.

Keywords: Bone; Bone quality and biomechanics.


Conflict of interest statement

Competing interestsThe authors declare no competing interests.

Figures

Fig. 1
Fig. 1
Pinch1Prx1; Pinch2−/− (dKO), but not single mutant (Pinch1Prx1 or Pinch2−/−), mice display dwarfism. a Representative pictures of 6-week-old male control (Prx1-Cre), Pinch1Prx1, Pinch2−/−, and dKO mice. Scale bar, 1 cm. b Growth curve. The results are expressed as the mean ± standard deviation (s.d.). Student’s t test, *P < 0.05; **P < 0.01; ***P < 0.001. N = 5 control, Pinch1Prx1 and Pinch2−/− mice; N = 7 dKO mice. c Survival curve. N = 7 mice per group. Alcian blue-alizarin red double staining of whole-mount skeletons (d), rib cages and sterna (e), and calvaria (f) of P0 control, Pinch2−/−, Pinch1Prx1, and dKO mice. Scale bar, 5 mm. The red arrow indicates the bifurcation of the sternum in dKO mice. g Alcian blue/hematoxylin/Orange G staining of humeral sections from E18.5 and P0 control and dKO mice. Scale bar, 200 mm. h Hematoxylin and eosin (H/E) staining of humeral sections from E18.5 and P0 control and dKO mice. Scale bar, 100 μm. ik Alcian blue-alizarin red staining of tibial sections from P17 and 6-week-old male control, Pinch2−/−, Pinch1Prx1, and dKO mice (i). Quantification of the lengths of the proliferative zone (PZ) (j) and hypertrophic zone (HZ) (k). N = 5 mice per group. Student’s t test. The results are expressed as the mean ± s.d. ***P < 0.001. Scale bar, 400 μm (top and middle) or 80 μm (bottom)
Fig. 2
Fig. 2
dKO, but not single mutant, mice display severely low bone mass. a Three-dimensional (3D) reconstruction from microcomputed tomography (μCT) scans of the distal femurs of 6-week-old male control, Pinch2−/−, Pinch1Prx1, and dKO mice. Scale bar, 500 μm. Quantitative analyses of bone mineral density (BMD) (b), bone volume/tissue volume (BV/TV) (c), trabecular number (Tb.N) (d), trabecular separation (Tb.Sp) (e), trabecular thickness (Tb.Th) (f), and cortical thickness (Ct.Th) (g). N = 5 control, Pinch1Prx1, and Pinch2−/− mice; N = 7 dKO mice. **P < 0.01; ***P < 0.001 versus control mice, Student’s t test. The results are expressed as the mean ± s.d.
Fig. 3
Fig. 3
Pinch ablation reduces PZ chondrocyte proliferation and increases HZ chondrocyte apoptosis, resulting in limb shortening. a Representative pictures of the femurs, tibiae, and humeri of 6-week-old male control and dKO mice. Scale bar, 5 mm. b Quantification of long bone lengths. Student’s t test. The results are expressed as the mean ± s.d. *P < 0.05, **P < 0.01, versus control mice. N = 8 control mice; N = 6 dKO mice. ce Immunohistochemical (IHC) staining of tibial sections from 6-week-old male control and dKO mice with an antibody against Ki67 (c, top) or active caspase-3 (c, bottom). Scale bar, 50 μm. Quantification of Ki67+ cells in the PZ (d) and cellularity in the PZ (e). Quantitative data were obtained from the areas between the two green dashed lines. N = 3 mice per group (d) or 5 mice per group (e). The data are expressed as the mean ± s.d. *P < 0.05, **P < 0.01 versus control mice, Student’s t test
Fig. 4
Fig. 4
Pinch deletion decreases Smad2/3 expression in PZ chondrocytes but increases the expression of Col10a1 and Runx2 in PZ and HZ chondrocytes. af IHC staining of tibial sections from 6-week-old male control and dKO mice with antibodies against Smad2/3 (a), Col10a1 (c), and Runx2 (e). Scale bar, 50 μm. Quantification of Smad2/3+, Col10a1+, and Runx2+ cells (b, d, f). Quantitative data were obtained from the areas between the two green dashed lines. N = 4 mice per group for Smad2/3 (b); N = 5 mice per group for Col10a1 and Runx2 (d, f). The data are expressed as the mean ± s.d. ***P < 0.001, versus controls, Student’s t test. The number of cells in the areas between the dotted lines was determined
Fig. 5
Fig. 5
Pinch loss impairs TGF-β1/Smad2/3 signaling. a Immunofluorescence (IF) staining. ATDC5 cells (2 × 104 cells/well) were seeded in confocal dishes (SPL Life Science) for 24 h, and then subjected to IF staining using the indicated antibodies. Scale bar, 20 µm. b Immunoprecipitation (IP) assay. COS-7 cells (2 × 106 cells/well) were seeded in 100-mm dishes. Twenty-four hours later, the cells were transfected with 5 μg Pinch1 expression plasmids. After 24 h, whole-cell extracts were prepared, immunoprecipitated with a Smad2/3 antibody, and subjected to western blot analysis using a Pinch1 (top) or Smad2/3 (bottom) antibody. c IP assay. Whole-cell extracts from ATDC5 chondrocyte-like cells were immunoprecipitated with a Smad2/3 antibody and then subjected to western blot analysis using a Pinch1 (top) or Smad2/3 (bottom) antibody. d IP assay. COS-7 cells were transfected with the indicated Flag-Pinch1 deletion mutant expression vector. After 36 h, whole-cell protein extracts were immunoprecipitated with an M2 antibody and then subjected to western blot analysis using an M2 (top) or Smad2/3 antibody (bottom). e, f Cycloheximide (CHX) experiment. Primary Pinch2 KO BMSCs were transfected with control or Pinch1 siRNA. Twenty-four hours later, the cells were treated with 10 μg·mL−1 CHX. Cell lysates were subjected to western blot analysis of Smad2/3 expression. Quantitative analysis of Smad2/3 expression, normalized to β‐actin, from three independent experiments (f). g, h Smad2/3 ubiquitination. Primary BMSCs from Pinch2 KO mice were transfected with control (si-NC) or Pinch1 siRNA (si-Pinch1). Twenty-four hours later, whole‐cell extracts were immunoprecipitated with an anti‐Smad2/3 antibody, and then subjected to western blot analysis of ubiquitin (Ub) (g). Quantitative analysis of (Ub)n‐Smad2/3 from three independent experiments (h). *P < 0.01 versus si-NC. i, j IF staining. Primary BMSCs from Pinch2 KO mice were transfected with si-NC or si-Pinch1. Twenty-four hours later, the cells were treated with or without 10 ng·mL−1 TGF-β1 for 30 min and then subjected to IF staining using a Smad2/3 antibody and phalloidin. Scale bar, 20 µm. Quantitative analysis of pSmad2/3 expression normalized to tubulin, from three independent experiments (j). k, l Western blotting. Primary BMSCs from Pinch2 KO mice were transfected with si-NC or si-Pinch1. Twenty-four hours later, the cells were treated with 10 ng·mL−1 TGF-β1 for 30 min and then subjected to western blotting. Quantitative analysis of pSmad2/3 expression normalized to tubulin, from three independent experiments (l). *P < 0.01 versus si-NC
Fig. 6
Fig. 6
Pinch loss increases sclerostin expression in HZ chondrocytes and reduces bone formation. ae Calcein double labeling. Images of calcein double labeling of the femoral diaphyseal cortical bones (a) and metaphyseal cancellous bones (b) of 6-week-old male control and dKO mice. Scale bar, 50 μm. Quantification of MAR (c), MS/BS (d), and BFR (e) of the femoral diaphyseal cortical bones (Ct) and metaphyseal cancellous bones (Tb) of 6-week-old male control and dKO mice. N = 7 mice for control cortical bone MAR; N = 6 mice for dKO cortical bone MAR; N = 6 mice for both control and dKO trabecular bone MAR; N = 8 mice for control cortical bone BFR; N = 4 mice for dKO cortical bone BFR; N = 5 mice for control trabecular bone BFR; N = 8 mice for dKO trabecular bone BFR; N = 8 mice for control trabecular and cortical bone MS/BS; and N = 6 mice for dKO trabecular and cortical bone MS/BS. The data are expressed as the mean ± s.d. Student’s t test. *P < 0.05; **P < 0.01. f ELISA of serum levels of procollagen type 1 amino-terminal propeptide (P1NP). N = 5 control mice; N = 8 dKO mice. Student’s t test. The results are expressed as the mean ± s.d. *P < 0.05. g IHC staining of tibial sections from 6-week-old male control and dKO mice with an antibody against sclerostin. Scale bar, 50 μm
Fig. 7
Fig. 7
Pinch loss inhibits the osteoblastic differentiation capacity but enhances the adipogenic differentiation capacity of BMSCs. a The colony forming unit-fibroblast (CFU-F) assay. Nucleated bone marrow cells from 6-week-old male control and dKO mice were seeded in a six-well plate at a cell density of 2 × 106 per well, cultured using the Mouse MesenCult Proliferation Kit (CFU-F assay) for 14 days and subjected to Giemsa staining. b The colony forming unit-osteoblast (CFU-OB) assay. Nucleated bone marrow cells from 5-week-old male control and dKO mice were seeded in a six-well plate at a density of 4 × 106 per well, cultured in osteoblast differentiation media for 21 days (the medium was changed every 48 h) and subjected to alizarin red staining. c The BMSC proliferation assay. BMSCs were seeded in a 96-well plate at a density of 2 000 cells per well. The absorbance was measured at 0, 2, 4, and 6 days. *P < 0.05; **P < 0.01 versus control mice, Student’s t test. The results are expressed as the mean ± s.d. d, e Primary BMSCs from control and dKO mice were cultured with osteoblast differentiation medium for 7 days and then subjected to ALP staining (d) or quantitative real-time PCR (qRT-PCR) to evaluate the expression of the indicated genes, which was normalized to the level of Gapdh mRNA (e). N = 3 mice per group. f Alizarin red S staining. BMSCs were cultured in osteoblast differentiation medium for 7 days and then in mineralization-inducing medium for 7 days. g, h Adipogenic differentiation. BMSCs were cultured in adipogenic differentiation medium from the MesenCult™ Adipogenic Differentiation Kit for 9 days and then subjected to qPCR to evaluate the expression of the indicated genes, which was normalized to the level of Gapdh mRNA (g) or subjected to Oil Red O staining (h). N = 3 mice per group. Scale bar, 100 μm. i Western blotting. Protein extracts isolated from BMSCs from 6-week-old male control and dKO mice of the two genotypes were subjected to western blotting. jl IF staining. BMSCs from 6-week-old male control and dKO mice of the two genotypes were subjected to IF staining using the indicated antibodies or DAPI. Scale bar, 25 µm. Quantification of Yap1 (k) and β-catenin (l) expression
Fig. 8
Fig. 8
Pinch loss upregulates Rankl in HZ chondrocytes and promotes osteoclast formation in vitro and in bone. af Tartrate-resistant acid phosphatase (TRAP) staining. Tibial sections from 6-week-old male control and dKO mice were used for TRAP staining (a, d). The osteoclast surface/bone surface (Oc.S/BS) (c, f) and osteoclast number/bone perimeter (Oc.N/BPm) (b, e) of the primary and secondary spongiosa bones from mice of the two genotypes were measured using Image-Pro Plus 7.0 (cg). The arrow indicates osteoclasts located on the trabecular bone surface. Scale bar, 50 μm. *P < 0.05, ***P < 0.001. N = 5 mice per group. Student’s t test. The results are expressed as the mean ± s.d. gj In vitro osteoclast formation. Primary BMMs from 6-week-old control and dKO male mice were first cultured in proliferation medium (α-MEM containing 10% FBS and 10 ng·mL−1 human recombinant M-CSF) for 3 days followed by differentiation medium (proliferation medium plus 50 ng·mL−1 human recombinant RANKL) for 4–9 days and then subjected to TRAP staining (g). TRAP+ MNCs (≥3, 10, or 30 nuclei) per well were scored (hj). The data are expressed as the mean ± s.d. Student’s t test. **P < 0.01. Scale bar, 100 μm. k ELISA of serum levels of collagen type I cross-linked C-telopeptide (CTX1). Sera were collected from 6-week-old male control and dKO mice and subjected to ELISA for CTX1. N = 5 control mice; N = 6 dKO mice. Student’s t test. The results are expressed as the mean ± s.d. l IHC staining of tibial sections from 6-week-old male control and dKO mice with an anti-Rankl antibody. Scale bar, 50 μm
Fig. 9
Fig. 9
Deleting Pinch1 in chondrocytes and global Pinch2 deletion causes subtle limb shortening and low bone mass in mice. a Whole-body photographs of 2-month-old control and Pinch1Col2a1; Pinch2−/− mice. N = 5 mice per group. Scale bar, 1 cm. b, c The femurs, tibiae and humeri of 3-momth-old male control and Pinch1Col2a1; Pinch2−/− mice (b). Quantitative data of long bones length (c). *P < 0.05. N = 5 mice per group. Scale bar, 5 mm. d, e H/E staining of tibial sections from 3-month-old male control and Pinch1Col2a1; Pinch2−/− mice. Quantification of the data in d (e). The quantitative data were obtained from the areas between the two green dashed lines. N = 5 mice per group. Student’s t test. The results are expressed as the mean ± s.d. *P < 0.05. Scale bar, 20 μm. f 3D reconstruction from μCT scans of the femurs of 3-month-old male control and Pinch1Col2a1; Pinch2−/− mice. Scale bar, 500 μm. gl Quantitative analysis of the BMD, BV/TV, Tb.N, Tb.Sp, Tb.Th, and Ct.Th. N = 5 mice per group. Student’s t test. The results are expressed as the mean ± s.d. *P < 0.05

Similar articles

Cited by

References

    1. Kronenberg HM. Developmental regulation of the growth plate. Nature. 2003;423:332–336. doi: 10.1038/nature01657. - DOI - PubMed
    1. Long F. Building strong bones: molecular regulation of the osteoblast lineage. Nat. Rev. Mol. Cell Biol. 2012;13:27–38. doi: 10.1038/nrm3254. - DOI - PubMed
    1. Mackie EJ, Ahmed YA, Tatarczuch L, Chen KS, Mirams M. Endochondral ossification: how cartilage is converted into bone in the developing skeleton. Int. J. Biochem. Cell Biol. 2008;40:46–62. doi: 10.1016/j.biocel.2007.06.009. - DOI - PubMed
    1. Liu CF, Samsa WE, Zhou G, Lefebvre V. Transcriptional control of chondrocyte specification and differentiation. Semin. Cell Dev. Biol. 2017;62:34–49. doi: 10.1016/j.semcdb.2016.10.004. - DOI - PMC - PubMed
    1. Foster JW, et al. Campomelic dysplasia and autosomal sex reversal caused by mutations in an SRY-related gene. Nature. 1994;372:525–530. doi: 10.1038/372525a0. - DOI - PubMed

LinkOut - more resources