Lack of PPAR β/ δ-Inactivated SGK-1 Is Implicated in Liver Carcinogenesis
- PMID: 33083492
- PMCID: PMC7556072
- DOI: 10.1155/2020/9563851
Lack of PPAR β/ δ-Inactivated SGK-1 Is Implicated in Liver Carcinogenesis
Abstract
Objective: The present study examined the role of PPARβ/δ in hepatocellular carcinoma (HCC).
Methods: The effect of PPARβ/δ on HCC development was analyzed using PPARβ/δ-overexpressed liver cancer cells and PPARβ/δ-knockout mouse models.
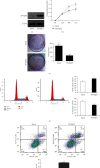
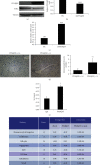
Results: PPARβ/δ (-/-) mice were susceptible to diethylnitrosamine- (DEN-) induced HCC (87.5% vs. 37.5%, p < 0.05). In addition, PPARβ/δ-overexpressed HepG2 cells had reduced proliferation, migration, and invasion capabilities accompanied by increased apoptosis and cell cycle arrest at the G0/G1 phase. Moreover, differential gene expression profiling uncovered that the levels of serine/threonine-protein kinase (SGK-1) mRNA and its encoded protein were reduced in PPARβ/δ-overexpressed HepG2 cells. Consistently, elevated SGK-1 levels were found in PPARβ/δ (-/-) mouse livers as well as PPARβ/δ-knockdown human SMMC-7721 HCC cells. Chromatin immunoprecipitation (ChIP) assays followed by real-time quantitative polymerase chain reaction (qPCR) assays further revealed the binding of PPARβ/δ to the SGK-1 regulatory region in HepG2 cells.
Conclusions: Due to the known tumor-promoting effect of SGK1, the present data suggest that PPARβ/δ-deactivated SGK1 is a novel pathway for inhibiting liver carcinogenesis.
Copyright © 2020 Bo Shen et al.
Conflict of interest statement
The authors declare that they have no conflicts of interest.
Figures


Similar articles
-
Functional characterization of peroxisome proliferator-activated receptor-β/δ expression in colon cancer.Mol Carcinog. 2011 Nov;50(11):884-900. doi: 10.1002/mc.20757. Epub 2011 Mar 11. Mol Carcinog. 2011. PMID: 21400612 Free PMC article.
-
PPARβ/δ promotes HRAS-induced senescence and tumor suppression by potentiating p-ERK and repressing p-AKT signaling.Oncogene. 2014 Nov 13;33(46):5348-59. doi: 10.1038/onc.2013.477. Epub 2013 Nov 11. Oncogene. 2014. PMID: 24213576 Free PMC article.
-
Nicotine stimulates PPARbeta/delta expression in human lung carcinoma cells through activation of PI3K/mTOR and suppression of AP-2alpha.Cancer Res. 2009 Aug 15;69(16):6445-53. doi: 10.1158/0008-5472.CAN-09-1001. Epub 2009 Aug 4. Cancer Res. 2009. PMID: 19654299 Free PMC article.
-
Dissecting the role of peroxisome proliferator-activated receptor-β/δ (PPARβ/δ) in colon, breast, and lung carcinogenesis.Cancer Metastasis Rev. 2011 Dec;30(3-4):619-40. doi: 10.1007/s10555-011-9320-1. Cancer Metastasis Rev. 2011. PMID: 22037942 Free PMC article. Review.
-
Peroxisome proliferator-activated receptor beta/delta as a therapeutic target for metabolic diseases.Expert Opin Ther Targets. 2005 Aug;9(4):861-73. doi: 10.1517/14728222.9.4.861. Expert Opin Ther Targets. 2005. PMID: 16083348 Review.
Cited by
-
Immunometabolic factors contributing to obesity-linked hepatocellular carcinoma.Front Cell Dev Biol. 2023 Jan 12;10:1089124. doi: 10.3389/fcell.2022.1089124. eCollection 2022. Front Cell Dev Biol. 2023. PMID: 36712976 Free PMC article. Review.
-
DLGAP4 acts as an effective prognostic predictor for hepatocellular carcinoma and is closely related to tumour progression.Sci Rep. 2022 Nov 17;12(1):19775. doi: 10.1038/s41598-022-23837-y. Sci Rep. 2022. PMID: 36396671 Free PMC article.
-
PPARs and the Kynurenine Pathway in Melanoma-Potential Biological Interactions.Int J Mol Sci. 2023 Feb 4;24(4):3114. doi: 10.3390/ijms24043114. Int J Mol Sci. 2023. PMID: 36834531 Free PMC article. Review.
-
Abnormal Metabolism in the Progression of Nonalcoholic Fatty Liver Disease to Hepatocellular Carcinoma: Mechanistic Insights to Chemoprevention.Cancers (Basel). 2021 Jul 11;13(14):3473. doi: 10.3390/cancers13143473. Cancers (Basel). 2021. PMID: 34298687 Free PMC article. Review.
-
Metabolomics combined with network pharmacology reveals the anti-hepatoma effects of terpenoids from Polygonatum kingianum var. grandifolium and Polygonatum sibiricum Redouté as well as differences in their terpenoid metabolites.BMC Plant Biol. 2025 Jun 5;25(1):769. doi: 10.1186/s12870-025-06807-0. BMC Plant Biol. 2025. PMID: 40474061 Free PMC article.
References
-
- Kliewer S. A., Forman B. M., Blumberg B., et al. Differential expression and activation of a family of murine peroxisome proliferator-activated receptors. Proceedings of the National Academy of Sciences of the United States of America. 1994;91(15):7355–7359. doi: 10.1073/pnas.91.15.7355. - DOI - PMC - PubMed
-
- Girroir E. E., Hollingshead H. E., He P., Zhu B., Perdew G. H., Peters J. M. Quantitative expression patterns of peroxisome proliferator-activated receptor-β/δ (PPARβ/δ) protein in mice. Biochemical and Biophysical Research Communications. 2008;371(3):456–461. doi: 10.1016/j.bbrc.2008.04.086. - DOI - PMC - PubMed
MeSH terms
Substances
Grants and funding
LinkOut - more resources
Full Text Sources
Medical
Molecular Biology Databases

