. 2020 Oct 16:6:55.
doi: 10.1038/s41523-020-00196-3. eCollection 2020.

Characterization of weaning-induced breast involution in women: implications for young women's breast cancer

Affiliations

Characterization of weaning-induced breast involution in women: implications for young women's breast cancer

Sonali Jindal et al. NPJ Breast Cancer. .

Abstract

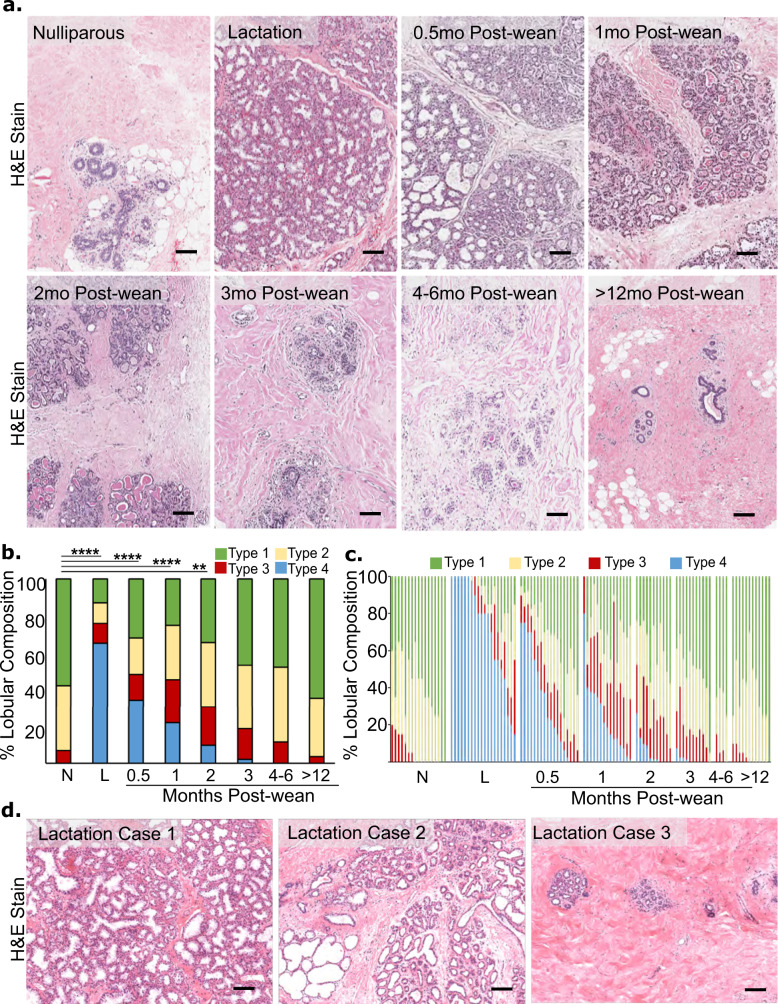
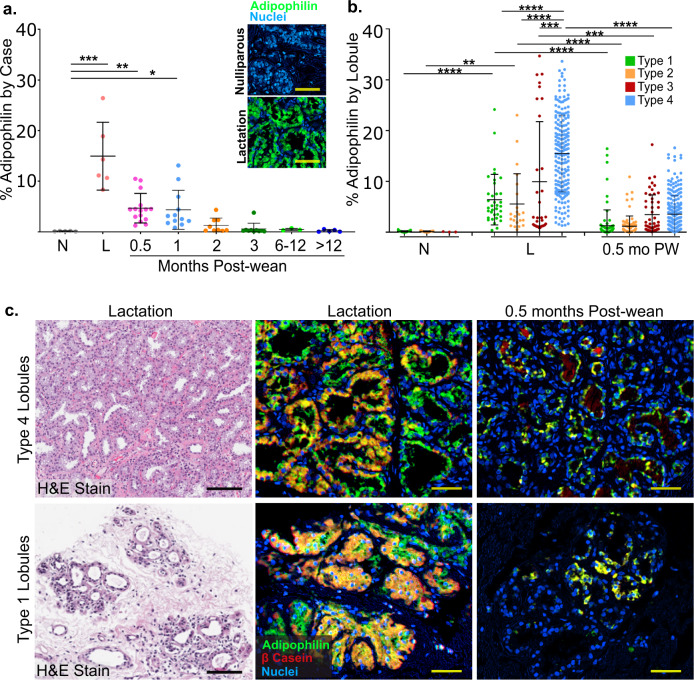
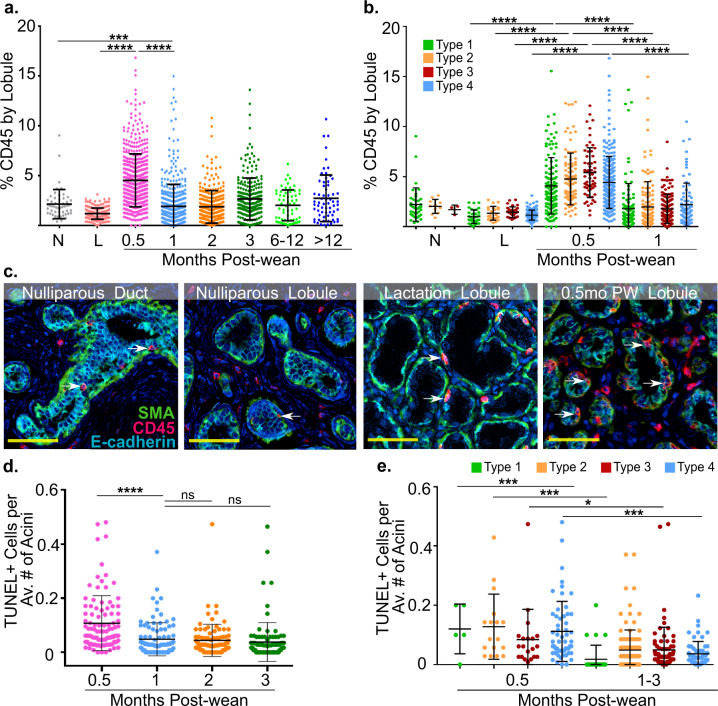
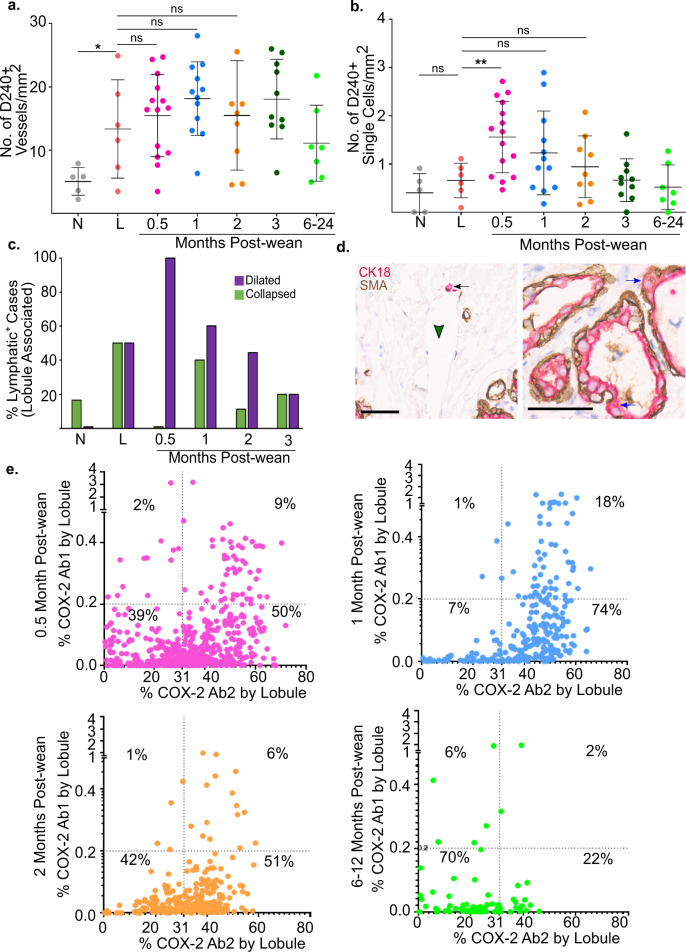
In rodents, weaning-induced mammary gland involution supports increased mammary tumor incidence, growth, and progression to metastasis. Further, the protumor attributes of gland involution are COX-2 dependent and mitigated by short-duration non-steroidal anti-inflammatory drugs (NSAIDs), suggesting a potential prevention strategy. However, the transition from lactation to postweaning breast involution has not been rigorously evaluated in healthy women. Here we queried breast biopsies from healthy women (n = 112) obtained at nulliparity, lactation, and multiple postweaning time points using quantitative immunohistochemistry. We found that mammary remodeling programs observed in rodents are mirrored in the human breast. Specifically, lactation associates with the expansion of large, secretory mammary lobules and weaning associates with lobule loss concurrent with epithelial cell death and stromal hallmarks of wound healing, including COX-2 upregulation. Altogether, our data demonstrate that weaning-induced breast involution occurs rapidly, concurrent with protumor-like attributes, and is a potential target for NSAID-based breast cancer prevention.

Keywords: Breast cancer; Cancer microenvironment; Cancer prevention; Developmental biology; Target identification.


Conflict of interest statement

Competing interestsThe authors declare no competing interests.

Figures

Fig. 1
Fig. 1. Breast lobular composition returns to pre-pregnant like state by three months post-wean.
a Representative H&E images of biopsies from each reproductive group: nulliparous, lactation, and 0.5, 1, 2, 3, 4–6, >12 months post-wean. b Quantification of the average lobular composition by lobular subtype for each group: nulliparous (N) n = 17, lactation (L) n = 20, and 0.5 (n = 18), 1 (n = 15), 2 (n = 11), 3 (n = 11), 4–6 (n = 4), 12–24 months post-wean (n = 12). In this chort, type 1 average 15 acini/lobule, type 2 average 35 acini per lobule, type 3 average 112 acini/lobule, and type 4 average 112 acini/lobule with flattened epithelium and large acinar lumen. c Lobular composition by case shows heterogeneity within each reproductive group. d Representative H&E images show lobular heterogeneity observed in the lactation group. (****P ≤ 0.0001, **P ≤ 0.01, scale bar = 100 µm).
Fig. 2
Fig. 2. Expression of the milk proteins adipophilin and β-casein occurs in all lobular subtypes at lactation with rapid decline by 0.5 months post-wean.
a Percent of adipophilin expression per mm2 for each group by case including nulliparous (N) n = 5, lactation (L) n = 6, and 0.5 (n = 15), 1 (n = 12), 2 (n = 9), 3 (n = 10), 6–12 (n = 3), 12–24 months post-wean (n = 5). Pseudo color multiplex immuno histochemistry (mIHC) images of adipophilin staining (green) in nulliparous (negative control) and lactational (positive control) glands are shown. b Percent of adipophilin expression per mm2 in nulliparous, lactation and 0.5 months post-wean cases by lobular subtype. c Representative H&E-stained images for type 4 and type 1 lobules in lactation cases (left column). mIHC stain for adipophilin (green) and β-casein (red) in type 4 and type 1 lobules during lactation (middle column) and at 0.5 months (right column) shows co-expression at the single cell level (orange/yellow). (****P ≤ 0.0001, ***P ≤ 0.001, **P ≤ 0.01, *P ≤ 0.05, scale bar = 50 µm).
Fig. 3
Fig. 3. Hallmarks of postweaning involution occur in all lobular subtypes and peak at 0.5 months post-wean.
a CD45+ expression by lobule for each group including nulliparous (N), n = 5, lactation (L) n = 5, and 0.5 (n = 15), 1 (n = 12), 2 (n = 9), 3 (n = 10), 6–12 (n = 3), 12–24 months post-wean (n = 5). b CD45+ expression by lobular subtype for nulliparous, lactation, and 0.5 months post-wean cases. c Representative pseudocolor multiplex IHC images of nulliparous (duct and lobule), lactation (lobule) and 0.5 months post-wean (lobule) showing spatial relationships between CD45+ immune cells (red), E-cadherin+ epithelial cells (blue), and SMA+ myoepithelium (green). Arrows show immune cells interspersed within acinar epithelium. d TUNEL+ epithelial cells per average number of acini are shown at 0.5 (n = 6), 1 (n = 6), 2 (n = 6), and 3 (n = 6) months post-wean. e Number of TUNEL+ epithelial cells per average number of acini at 0.5 and 1–3 months post-wean is shown by lobular subtype (****P ≤ 0.0001, ***P ≤ 0.001, *P ≤ 0.05, scale bar = 50 µm).
Fig. 4
Fig. 4. Lymphatic density and function increase during early weeks of weaning-induced involution.
a Lymphatic density measured by D2–40+ vessels/mm2 for each group by case including nulliparous (N) n = 5, lactation (L) n = 6, and 0.5 (n = 14), 1 (n = 12), 2 (n = 9), 3 (n = 10), 6–24 months post-wean (n = 7). b Number of D2–40+ single cells/mm2 for nulliparous (N) n = 5, lactation (L) n = 6, and 0.5 (n = 15), 1 (n = 12), 2 (n = 9), 3 (n = 10), 6–24 months post-wean (n = 7) cases. c Percentage of cases with dilated (purple) and collapsed (green) lymphatics present within 100 um of lobules in nulliparous (N) n = 5, lactation (L) n = 6, and 0.5 (n = 6), 1 (n = 9), 2 (n = 9), 3 (n = 10), 12–24 (n = 6) months post-wean. d Breast biopsy at 0.5 months post-wean stained for CK18 (red), SMA (brown), and hematoxylin counterstain (blue) showing CK18+ signal within mammary lymphatics (left panel) and basally located mammary epithelial cells outside the confines of the SMA+ myoepithelial cell layer (right panel). e Dot plots of lobules with positive COX-2 expression using Ab1 and Ab2 for 0.5, 1, 2, and 6–12 months post-wean. The K-means high and low COX-2 cutoff value (Ab1 = 0.2%, Ab2 = 31%) are shown by the dotted line (***P ≤ 0.001, **P ≤ 0.01, *P ≤ 0.05, scale bar = 50 µm).

Similar articles

Cited by

References

    1. Borges VF, Schedin PJ. Pregnancy-associated breast cancer: an entity needing refinement of the definition. Cancer. 2012;118:3226–3228. doi: 10.1002/cncr.26643. - DOI - PMC - PubMed
    1. Callihan EB, et al. Postpartum diagnosis demonstrates a high risk for metastasis and merits an expanded definition of pregnancy-associated breast cancer. Breast Cancer Res. Treat. 2013;138:549–559. doi: 10.1007/s10549-013-2437-x. - DOI - PMC - PubMed
    1. Goddard ET, et al. Association between postpartum breast cancer diagnosis and metastasis and the clinical features underlying risk. JAMA Netw. Open. 2019;2:e186997. doi: 10.1001/jamanetworkopen.2018.6997. - DOI - PMC - PubMed
    1. Lyons TR, Schedin PJ, Borges VF. Pregnancy and breast cancer: when they collide. J. Mammary Gland Biol. Neoplasia. 2009;14:87–98. doi: 10.1007/s10911-009-9119-7. - DOI - PMC - PubMed
    1. Warner ET, et al. Reproductive factors and risk of premenopausal breast cancer by age at diagnosis: are there differences before and after age 40? Breast Cancer Res. Treat. 2013;142:165–175. doi: 10.1007/s10549-013-2721-9. - DOI - PMC - PubMed