. 2020 Sep 30:3:127.
doi: 10.1038/s41746-020-00334-y. eCollection 2020.

Age and environment-related differences in gait in healthy adults using wearables

Affiliations

Age and environment-related differences in gait in healthy adults using wearables

Matthew D Czech et al. NPJ Digit Med. .

Abstract

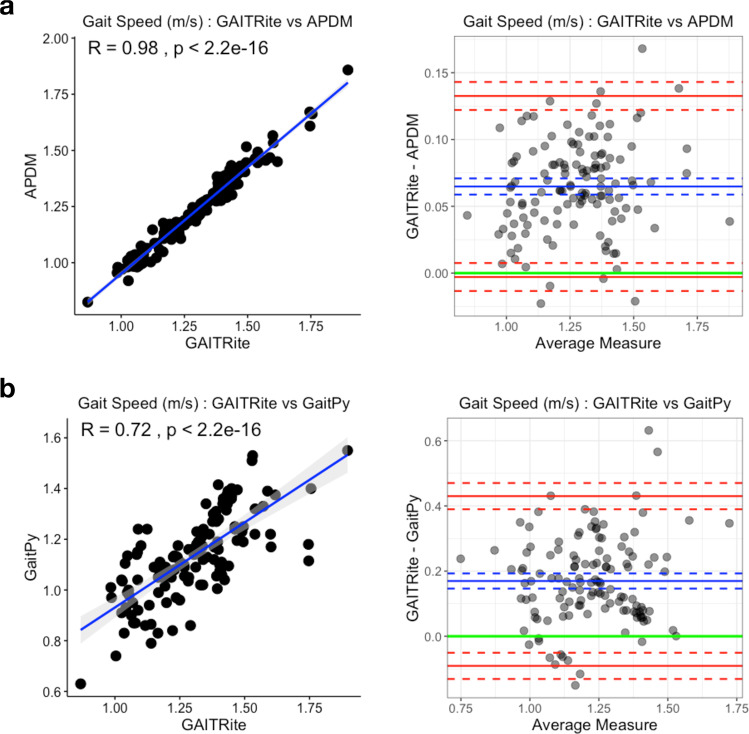
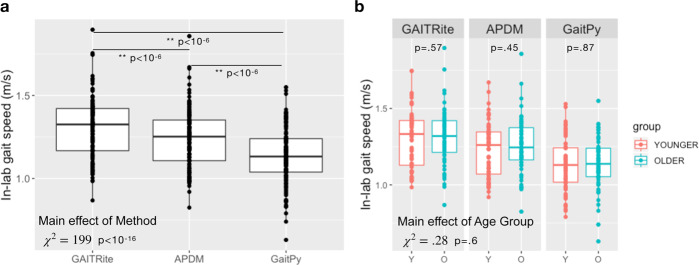
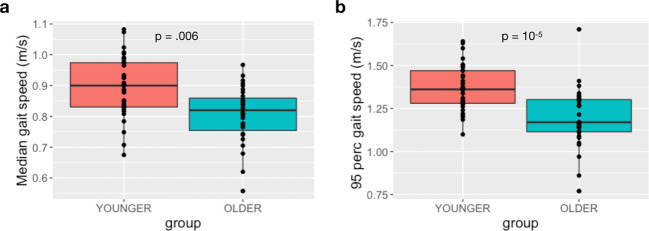
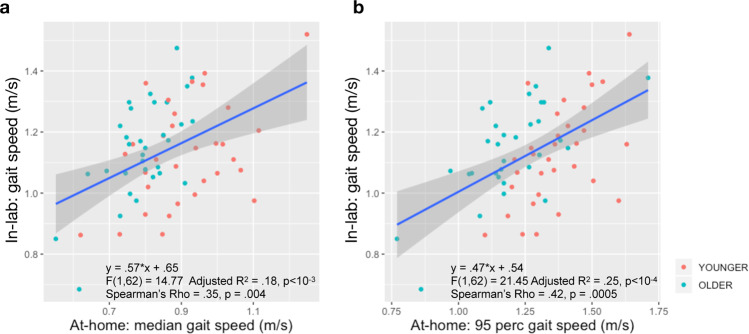
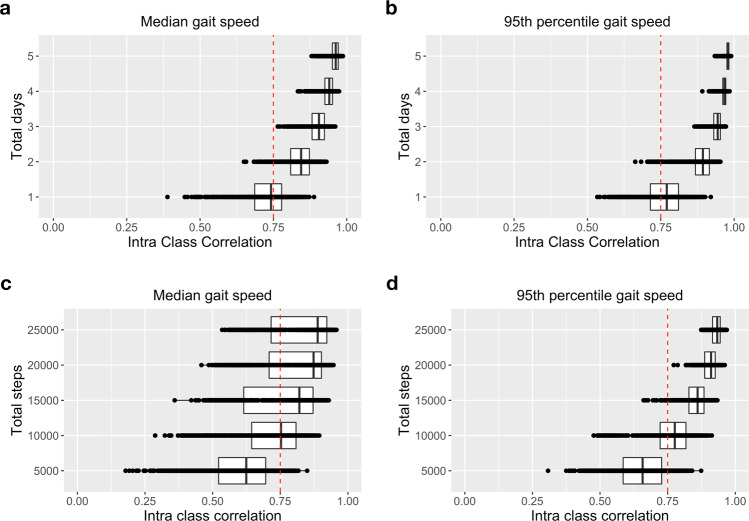
Technological advances in multimodal wearable and connected devices have enabled the measurement of human movement and physiology in naturalistic settings. The ability to collect continuous activity monitoring data with digital devices in real-world environments has opened unprecedented opportunity to establish clinical digital phenotypes across diseases. Many traditional assessments of physical function utilized in clinical trials are limited because they are episodic, therefore, cannot capture the day-to-day temporal fluctuations and longitudinal changes in activity that individuals experience. In order to understand the sensitivity of gait speed as a potential endpoint for clinical trials, we investigated the use of digital devices during traditional clinical assessments and in real-world environments in a group of healthy younger (n = 33, 18-40 years) and older (n = 32, 65-85 years) adults. We observed good agreement between gait speed estimated using a lumbar-mounted accelerometer and gold standard system during the performance of traditional gait assessment task in-lab, and saw discrepancies between in-lab and at-home gait speed. We found that gait speed estimated in-lab, with or without digital devices, failed to differentiate between the age groups, whereas gait speed derived during at-home monitoring was able to distinguish the age groups. Furthermore, we found that only three days of at-home monitoring was sufficient to reliably estimate gait speed in our population, and still capture age-related group differences. Our results suggest that gait speed derived from activities during daily life using data from wearable devices may have the potential to transform clinical trials by non-invasively and unobtrusively providing a more objective and naturalistic measure of functional ability.

Keywords: Biomedical engineering; Predictive markers; Quality of life.


Conflict of interest statement

Competing interestsM.D.C., D.P., H.Z., T.A., A.K., A.M., K.R.A.V.D., V.R., C.D., X.C., M.S., S.P., and F.I.K. are current employees of Pfizer, Inc. M.C. was a former employee of Pfizer, Inc.

Figures

Fig. 1
Fig. 1. Gait speed validation based on in-lab 4-m gait task.
a Comparison of gait speed estimated using a six-sensor system (APDM) and an instrumented gait mat (GAITRite). The gait speeds derived from two systems were highly correlated (Pearson’s r = 0.98, left). Bland–Altman plots (right) showed minimal mean difference (mean difference = 0.07, blue solid line; LoA = [−003, 0.13], red solid lines; corresponding confidence intervals are in dashed lines). b Comparison of gait speed estimated using a single lumbar-worn sensor (GaitPy) and an instrumented gait mat (GAITRite). The gait speeds derived from two systems were also highly correlated (Pearson’s r = 0.72, left). Bland–Altman plots (right) showed mean difference (mean difference = 0.17, blue solid line; LoA = [−0.09, 0.43] red solid lines; corresponding confidence intervals are represented by dashed lines). Both APDM and GaitPy had consistent bias compared to GAITRite and underestimated gait speed. LoA limits of agreement.
Fig. 2
Fig. 2. In-lab gait speed did not show any age group differences.
a Gait speed estimated using different methods differed (χ2 = 199, p < 10−16). Both APDM and GaitPy underestimated gait speed during in-lab gait task compared to GAITRite (p < 10−6), which is used as the gold standard. b Gait speed estimated using any of the three methods did not differ between the two age groups (younger group, n = 33, age = 29.2 ± 4.6, 17F; older group, n = 32, age = 72.3 ± 5.8, 16F; main age group effect: χ2 = 0.28, p = 0.6). Box and whiskers plots show the median and interquartile range, the lines extend to the smallest/largest value within 1.5 times interquartile range below/above the 25th/75th percentile, and the dots represent each individual data value.
Fig. 3
Fig. 3. At-home gait speed estimated using a single lumbar-worn sensor (GaitPy) differed between age groups.
a The median gait speed estimated by GaitPy showed significant group differences between younger and older groups (p = 0.006). There was also significant main effect of day type (χ2 = 42.08, p < 10−5), and group by day type interaction (χ2 = 13.38, p = 0.002); i.e., the group difference was larger during weekdays than weekends. b The 95th percentile gait speed was also different between younger and older groups (p = 10−5). Box and whiskers plots show the median and interquartile range, the lines extend to the smallest/largest value within 1.5 times interquartile range below/above the 25th/75th percentile, and the dots represent each individual data value.
Fig. 4
Fig. 4. Weak association between in-lab and at-home gait speed.
a The median gait speed at home showed a significant slope and an intercept (β = 0.57, p < 10−3, I = 0.65; p < 10−5). The two gait speed measures were moderately correlated (Spearman’s rho = 0.35, p = 0.004), and at-home median gait speed explained only 18% of the variance of in-lab gait speed. b When a regression analysis was performed to explain the in-lab gait speed with the 95th percentile gait speed, at-home gait speed showed a significant slope and an intercept (β = 0.47, p < 10−4; I = 0.54, p = 10−4). The two gait speed measures showed moderate correlation (Spearman’s rho = 0.42, p = 0.0005). At-home 95th percentile gait speed explained only 25% of the variance of in-lab gait speed. Shaded area shows the 95% confidence interval.
Fig. 5
Fig. 5. Amount of data needed to reliably estimate gait speed at home.
Subset of data in terms of successive steps or randomly selected days was compared to the full data set (ICC > 0.75 represents excellent agreement between two measurements). Minimum required data to estimate both a median gait speed and b 95th percentile gait speed was 2–3 days of monitoring data. c, d At least 15,000 and 10,000 concurrent steps were required to reliably estimate median and 95th percentile gait speed, respectively. Box and whiskers plots show the median and interquartile range, the lines extend to the smallest/largest value within 1.5 times interquartile range below/above the 25th/75th percentile, and the dots represent each individual data value.

Similar articles

Cited by

References

    1. Middleton A, Fritz SL, Lusardi M. Walking speed: the functional vital sign. J. Aging Phys. Act. 2015;23:314–322. - PMC - PubMed
    1. Fritz S, Lusardi M. Whitepaper: "Walking Speed: the Sixth Vital Sign". J. Geriatr.Phys. Ther. 2009;32:2–5. - PubMed
    1. Hornyak V, Vanswearingen JM, Brach JS. Measurement of gait speed. Top. Geriatr. Rehabil. 2012;28:27–32.
    1. Pirker W, Katzenschlager R. Gait disorders in adults and the elderly: aclinical guide. Wien. Klinische Wochenschr. 2017;129:81–95. - PMC - PubMed
    1. Peel NM, Kuys SS, Klein K. Gait speed as a measure in geriatric assessment in clinical settings: a systematic review. J. Gerontol. Ser. A Biol. Sci. Med. Sci. 2012;68:39–46. - PubMed