. 2020 Sep 15;23(10):101556.
doi: 10.1016/j.isci.2020.101556. eCollection 2020 Oct 23.

Spatial Transcriptomics Reveals Genes Associated with Dysregulated Mitochondrial Functions and Stress Signaling in Alzheimer Disease

Affiliations

Spatial Transcriptomics Reveals Genes Associated with Dysregulated Mitochondrial Functions and Stress Signaling in Alzheimer Disease

José Fernández Navarro et al. iScience. .

Abstract

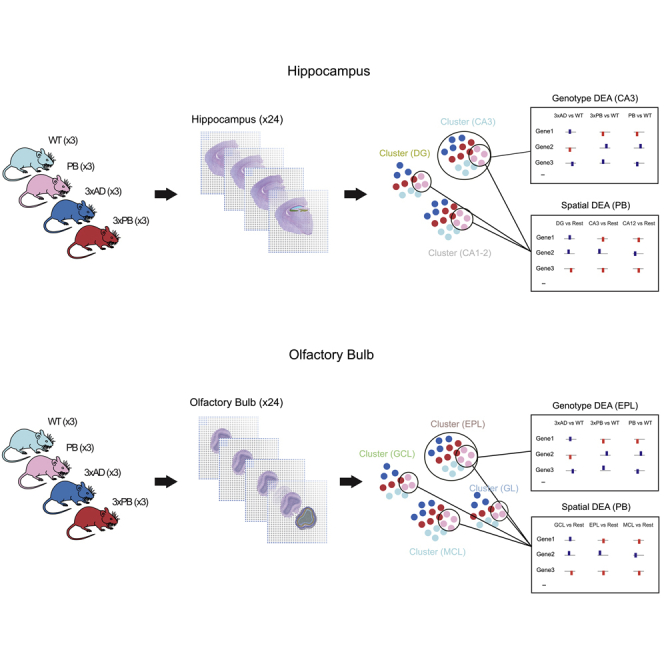
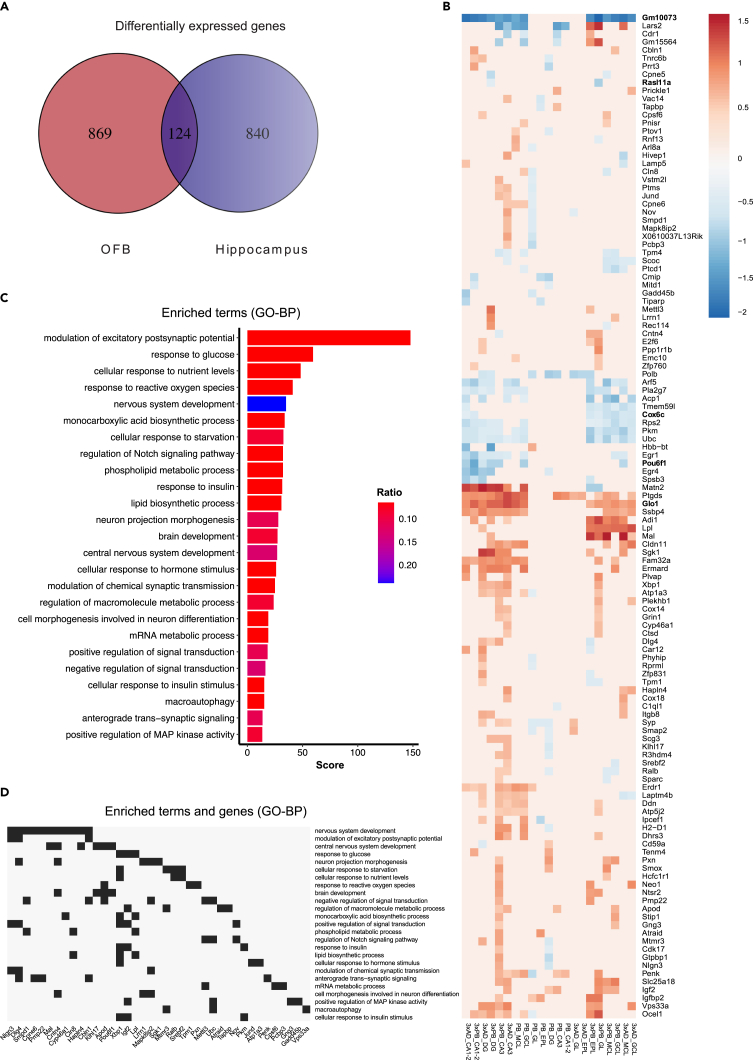
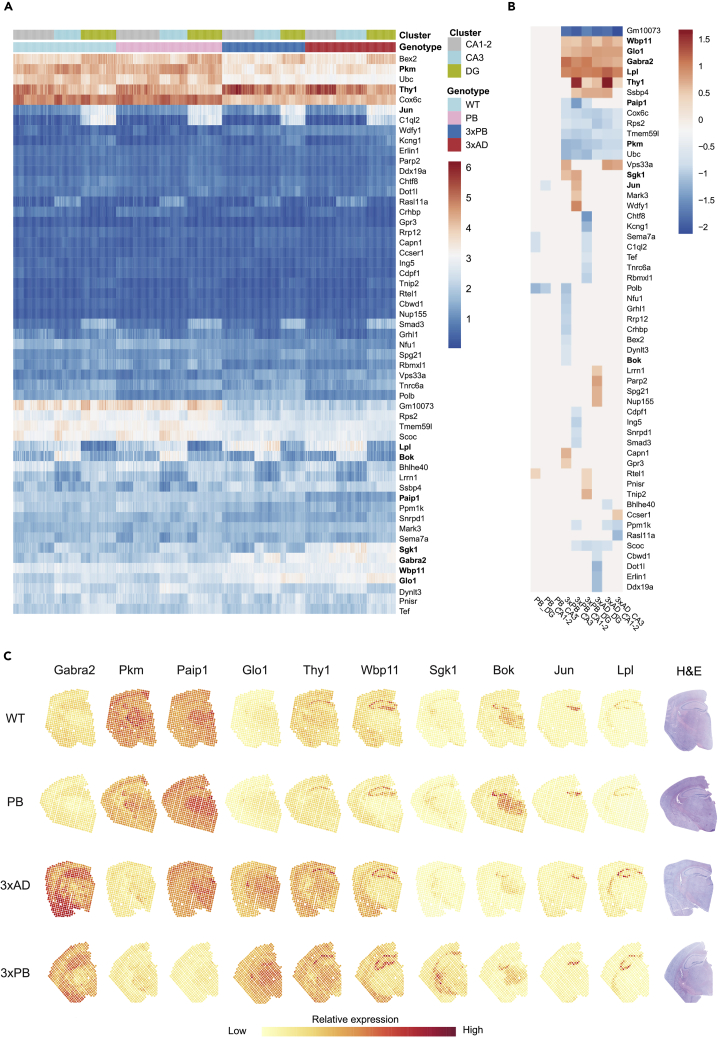
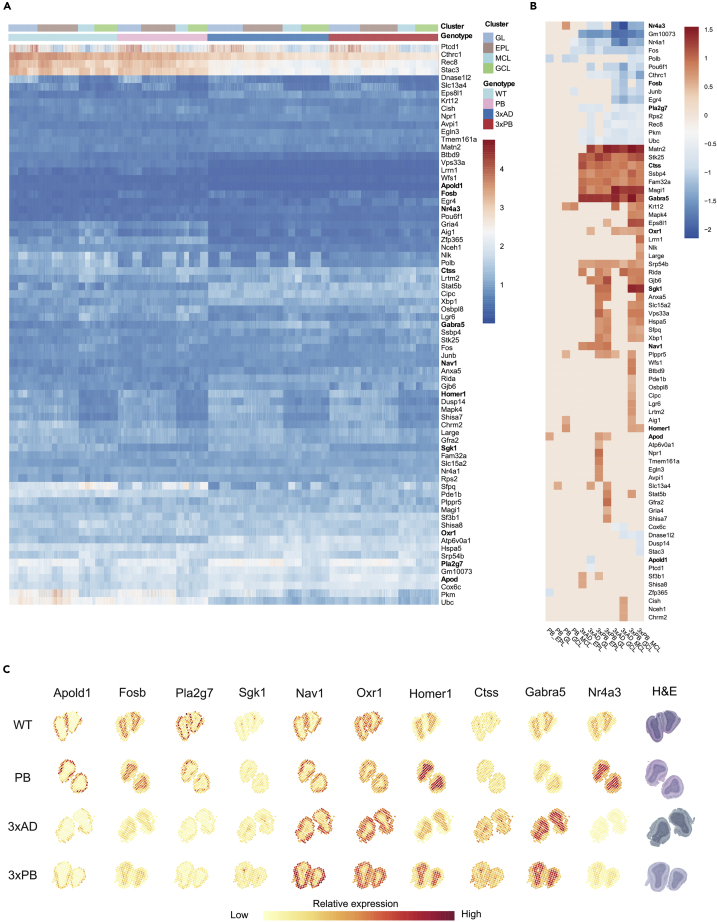
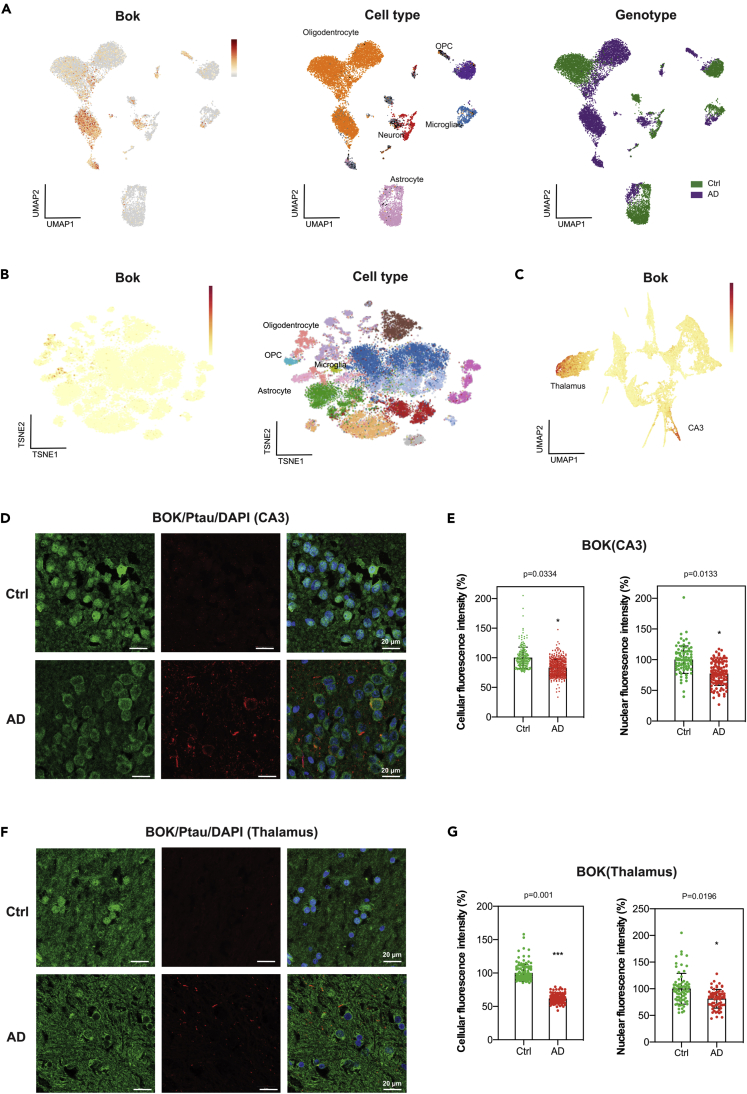
Alzheimer disease (AD) is a devastating neurological disease associated with progressive loss of mental skills and cognitive and physical functions whose etiology is not completely understood. Here, our goal was to simultaneously uncover novel and known molecular targets in the structured layers of the hippocampus and olfactory bulbs that may contribute to early hippocampal synaptic deficits and olfactory dysfunction in AD mice. Spatially resolved transcriptomics was used to identify high-confidence genes that were differentially regulated in AD mice relative to controls. A diverse set of genes that modulate stress responses and transcription were predominant in both hippocampi and olfactory bulbs. Notably, we identify Bok, implicated in mitochondrial physiology and cell death, as a spatially downregulated gene in the hippocampus of mouse and human AD brains. In summary, we provide a rich resource of spatially differentially expressed genes, which may contribute to understanding AD pathology.

Keywords: Cellular Neuroscience; Omics; Transcriptomics.


Conflict of interest statement

J.L. and J.F.N are scientific advisors at 10x Genomics Inc, which provides commercial barcoded arrays. All other authors declare no competing interests.

Figures

None
Graphical abstract
Figure 1
Figure 1
Application of ST to Understand Behavioral Changes in AD Mice (A) Graphic representation of LTP results measured at the Schaffer collateral synapses. EPSP, excitatory postsynaptic potential. There were no differences in pre-synaptic transmissions. Six slices from a minimum of five mice per group were assessed, and the values represent the mean ± SE. (B) Graphic representation of results of the buried food test. Mice n = 8–13 per genotype. Box plots hinges show 25th and 75 percentiles and sash mark shows median. See also Figure S1.
Figure 2
Figure 2
Statistics and Unsupervised Clustering Analysis (A) Reads and genes per spot distributions for the hippocampus dataset (median ± SD). (B) Reads and genes per spot distributions for the OFB dataset (median ± SD). (C) Factor analysis of the hippocampus dataset. UMAP manifold of the factor activities colored by cluster and genotype on the left and clusters overlaid onto the tissue sections on the right. (D) Factor analysis of the OFB dataset. UMAP manifold of the factor activities colored by cluster and genotype on the left and clusters overlaid onto the tissue sections on the right. (E) Graphic representation of the number of spots per cluster per mouse genotype (hippocampus). Three mice per genotype and two slices per mouse were used. (F) Graphic representation of the number of spots per cluster per mouse genotype (olfactory bulb). Three mice per genotype and two slices per mouse were used. See also Figure S2.
Figure 3
Figure 3
Identification of Genes Jointly Differentially Expressed in Hippocampi and Olfactory Bulb (A) Venn diagram showing the numbers of statistically significant differentially expressed genes per region and the number of genes found in at least one region in both datasets. (B) Heatmap showing the log2 fold-change for the set of shared genes, 124 genes, in (A) hierarchically clustered by anatomic region. (C) GO biological process terms enriched from genes shown in (B). Score represents statistical confidence, and ratio represents the relative number of genes detected in the term divided by all the input genes. (D) Gene clustergram showing the overrepresented genes from the GO terms shown in (C). Score represents statistical confidence, and ratio represents the relative number of genes detected in the term divided by all the inputted genes. See also Figure S3.
Figure 4
Figure 4
ST Analysis on Hippocampi Regions Reveals Differences among Stress Response Signaling Genes Globally and Regionally (A) Heatmap of the spatially differentially expressed genes found in the hippocampi clustered by rows. Graphic colorized by normalized expression and separated by color-coded genotype and cluster region. (B) Heatmap of log2-fold-change values of genes shown in (A) clustered by rows and columns. (C) Graphic representation of normalized gene expression of selected genes overlaid onto brain sections. The genes represent the types of data seen. Shown are Gabra2, Pkm, Paip1, Glo1, Thy1, Wbp1, Sgk1, Bok, Jun, and Lpl. H&E-stained brain slices are shown on the right. See also Figures S4 and S6–S9.
Figure 5
Figure 5
ST Analysis on Olfactory Bulbs Reveals Differences among Synaptic and Stress Response Signaling Genes both Globally and Regionally (A) Heatmap of the differentially expressed genes found in the OFBs clustered by rows. Graphic colorized by normalized expression and separated by color-coded genotype and cluster region. (B) Heatmap of log2-fold-change values of genes shown in (A) clustered by rows and columns. (C) Graphic representation of normalized gene expression of selected genes overlaid onto olfactory bulb tissue sections. Genes changed by region include Apold1, Fosb, Pla2g7, Sgk1, Nav1, Oxr1, Homer1, Ctss, Gabra5, and Nr4a3. H&E-stained brain slices are shown on the right. See also Figures S5, S10, and S11.
Figure 6
Figure 6
BOK Is Differentially Expressed in Human and Mouse AD Brains (A) Single-nuclei RNA-seq generated from the entorhinal cortex of human AD and control postmortem brains (data from Grubman et al., 2019). UMAP manifold of single nuclei colored by BOK's normalized expression (red means higher expression level) together with genotype and cell type maps. (B) Single-nuclei RNA-seq generated from the parietal lobe of human AD. t-SNE manifold of single nuclei colored by BOK (normalized expression) together with cell types. Data from Del-Aguila et al. (2019). (C) UMAP manifold of factor activities colored by Bok's normalized expression. The manifold is the same as in Figure 2C. The regions corresponding to the thalamus and CA3 are labeled. Localization of Bok denoted with red dots. (D) Alteration of BOK protein level and localization in AD hippocampi. Representative images of coronal CA3 sections from human control (Ctrl) and Alzheimer (AD, Braak VI) hippocampi. Scale bars, 20 μm. (E) Quantification of images of BOK staining in hippocampi. The cellular and nuclear BOK fluorescence intensities were quantified within CA2/CA3 cells from Ctrl and AD hippocampi (cellular Ctrl, n = 237; AD, n = 493) (nuclear Ctrl, n = 86; AD, n = 115). Data are presented as mean ± SEM. Statistical significance was determined using per brain mean value; three brains per category were analyzed. (F) Alteration of BOK protein levels and localization in AD thalami. Representative images of coronal sections from human control (Ctrl) and Alzheimer (AD, Braak VI) thalami. Scale bars, 20 μm. (G) Quantification of images of BOK staining in thalami. The cellular and nuclear BOK fluorescence intensities were quantified within cells from Ctrl and AD thalami (cellular Ctrl, n = 127; AD, n = 133) (nuclear Ctrl, n = 74; AD, n = 67). Data are presented as mean ± SEM. Statistical significance was determined using per brain mean value; three brains per category were quantified.

Similar articles

Cited by

References

    1. Angeloni C., Zambonin L., Hrelia S. Role of methylglyoxal in Alzheimer's disease. Biomed. Res. Int. 2014;2014:238485. - PMC - PubMed
    1. Bartholomeusz G., Wu Y., Ali Seyed M., Xia W., Kwong K.Y., Hortobagyi G., Hung M.C. Nuclear translocation of the pro-apoptotic Bcl-2 family member Bok induces apoptosis. Mol. Carcinog. 2006;45:73–83. - PubMed
    1. Berglund E., Maaskola J., Schultz N., Friedrich S., Marklund M., Bergenstrahle J., Tarish F., Tanoglidi A., Vickovic S., Larsson L. Spatial maps of prostate cancer transcriptomes reveal an unexplored landscape of heterogeneity. Nat. Commun. 2018;9:2419. - PMC - PubMed
    1. Blalock E.M., Geddes J.W., Chen K.C., Porter N.M., Markesbery W.R., Landfield P.W. Incipient Alzheimer's disease: microarray correlation analyses reveal major transcriptional and tumor suppressor responses. Proc. Natl. Acad. Sci. U S A. 2004;101:2173–2178. - PMC - PubMed
    1. Burgess D.J. Spatial transcriptomics coming of age. Nat. Rev. Genet. 2019;20:317. - PubMed

LinkOut - more resources