. 2020 Sep 15;23(10):101564.
doi: 10.1016/j.isci.2020.101564. eCollection 2020 Oct 23.

Mitochondrial Superoxide Dismutase Specifies Early Neural Commitment by Modulating Mitochondrial Dynamics

Affiliations

Mitochondrial Superoxide Dismutase Specifies Early Neural Commitment by Modulating Mitochondrial Dynamics

Smitha Bhaskar et al. iScience. .

Abstract

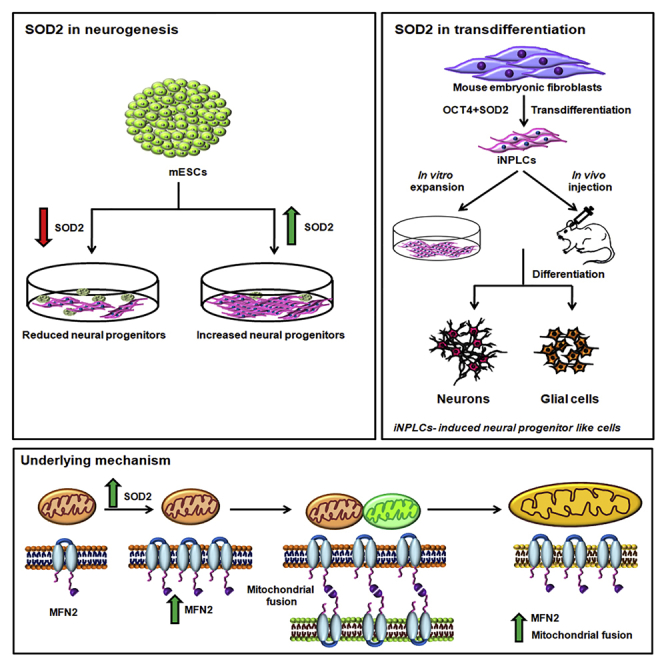
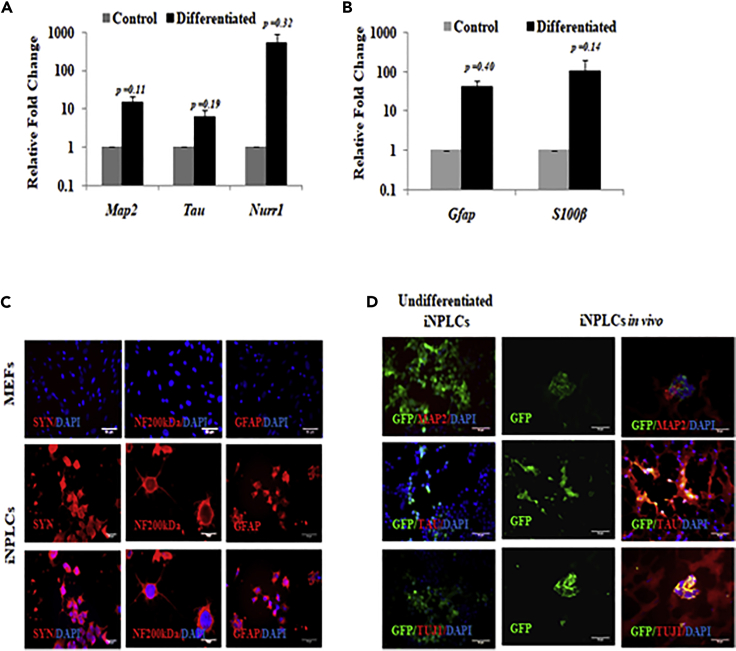
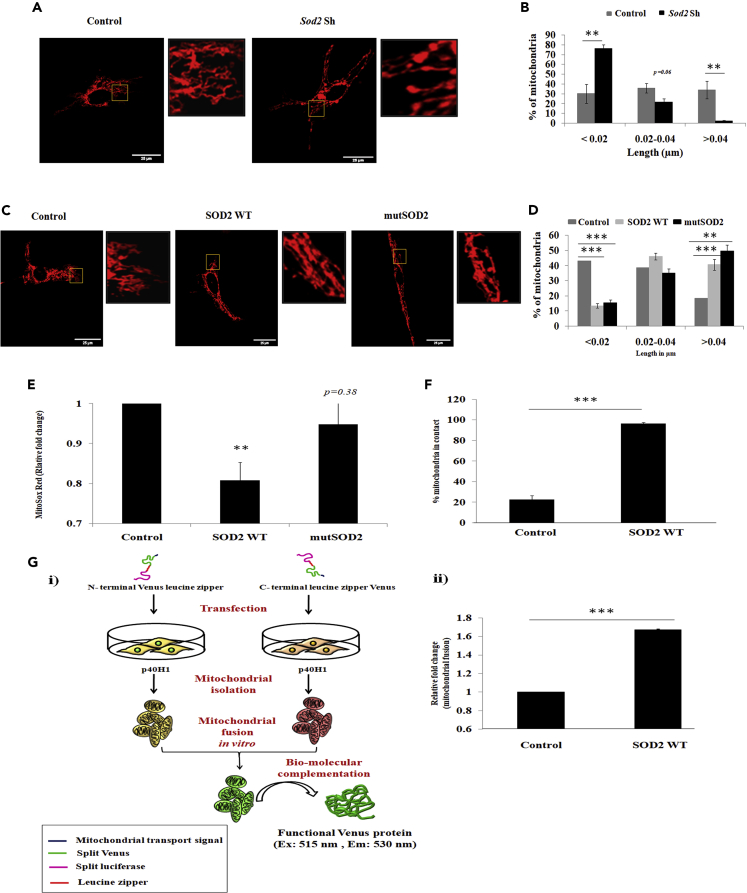
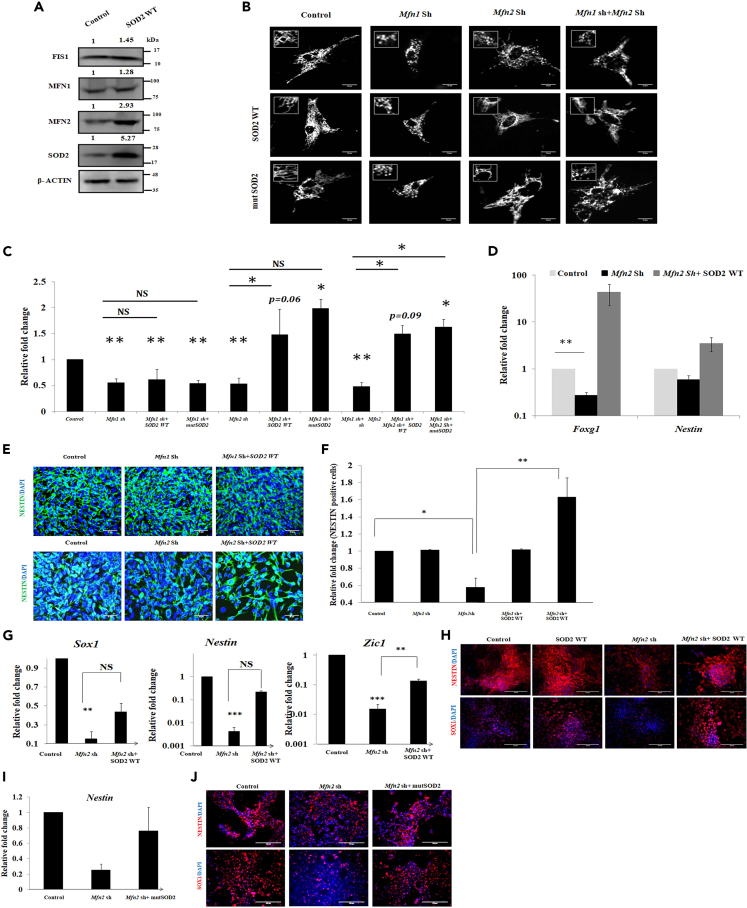
Studies revealing molecular mechanisms underlying neural specification have majorly focused on the role played by different transcription factors, but less on non-nuclear components. Earlier, we reported mitochondrial superoxide dismutase (SOD2) to be essential for self-renewal and pluripotency of mouse embryonic stem cells (mESCs). In the present study, we found SOD2 to be specifically required for neural lineage, but not the meso- or endoderm specification. Temporally, SOD2 regulated early neural genes, but not the matured genes, by modulating mitochondrial dynamics-specifically by enhancing the mitochondrial fusion protein Mitofusin 2 (MFN2). Bio-complementation strategy further confirmed SOD2 to enhance mitochondrial fusion process independent of its antioxidant activity. Over-expression of SOD2 along with OCT4, but neither alone, transdifferentiated mouse fibroblasts to neural progenitor-like colonies, conclusively proving the neurogenic potential of SOD2. In conclusion, our findings accredit a novel role for SOD2 in early neural lineage specification.

Keywords: Developmental Genetics; Developmental Neuroscience; Molecular Genetics.


Conflict of interest statement

The authors declare no competing interest.

Figures

None
Graphical abstract
Figure 1
Figure 1
SOD2 Is Essential for the Expression of Neuroectodermal Genes (A and B) mRNA (A) and protein (B) levels of SOD2 in endoderm, mesoderm, and neural differentiation of mESCs. mRNA levels are plotted as mean ± SE of biological triplicates and statistical significance has been calculated using paired Student's t test, ∗p < 0.05, ∗∗p < 0.01. (C) mRNA expression of SOD2 and specific markers in neural (i) and oligodendrocyte (ii) differentiation of mESCs. Comparison of mRNA (D) and protein (E) levels of neural markers in SOD2 over-expression against the vector control. (F) Comparison of mRNA levels of neural markers in the vector control, with and without BMP4 treatment, and SOD2 over-expression with BMP4 treatment. (G) Transcript analysis of germ layer markers in endodermal (i), mesodermal (ii), and ectodermal (iii) differentiation from mESCs upon SOD2 knockdown. Expression analysis of early neural marker SOX1 upon SOD2 knockdown in early neural differentiation of mESCs by immunoblotting (H) and immunofluorescence (I). Scale bar represents 50 μm. Un-cropped full western blot images are available in Data S1. List of primers used for transcript analysis and antibodies used for protein detection are available in Tables S1 and S2, respectively.
Figure 2
Figure 2
SOD2 Specifically Modulates Early Neural Differentiation (A) Modulation of protein expression of SOD2 across neural differentiation of mESCs. (B) Analysis of ROS levels using DCFHDA staining during early and late neural differentiation of mESCs. (C) mESCs were transfected with inducible SOD2 over-expression construct and 48 h after addition of doxycycline, cells were harvested and expression of SOD2 analyzed by western blotting. (D) Gene expression analysis of specific neural markers upon SOD2 over-expression induced during (i) early neural differentiation (days 0–3) and (ii) late neural differentiation (days 3–7). (E) mESCs were transfected with inducible SOD2 shRNA construct and 48 h after addition of doxycycline, cells were harvested and expression of SOD2 analyzed by western blotting. (F) Transcript analysis of specific neural markers upon SOD2 knockdown induced during (i) early neural differentiation (days 0–3) and (ii) late neural differentiation (days 3–7). Un-cropped full western blot images are available in data S1. List of primers used for transcript analysis and antibodies used for protein detection are available in Tables S1 and S2, respectively.
Figure 3
Figure 3
SOD2 along with OCT4 Transdifferentiates MEFs to iNPLCs (A) Phase contrast images of mouse embryonic fibroblasts (MEF) and colonies obtained from OCT4 and SOD2-mediated transdifferentiation. (B–K) Characterization of three independent clones obtained by OCT4 and SOD2-transduced cells. Scale bar represents 50 μm. (B) Gene expression analysis of pluripotency markers—Oct3/4, Nanog, and Rex1. (C) Transcript analysis of Epiblast specific marker Fgf5. Gene expression analysis of (D) Endodermal markers—Sox17, Cxcr4, and Gata6; (E) Mesodermal markers—Mixl1, Fkl1, and Vegf; and (F) Neural markers—Pax6, Foxg1, and Zic1 in iNPLC colonies. (G) Flow cytometric analysis of neural specific marker ZIC1 in MEF and i-NPLCs. (H) Protein levels as analyzed by western blot of early neural markers—ZIC1, SOX1, PAX6, and FOXG1, oligodendrocyte progenitor marker—OLIG2, and fibroblast marker—VIMENTIN in i-NPLCs. (I) Representative immunofluorescence images of neural markers—SOX1, ZIC1, PAX6—and oligodendrocyte progenitor marker—OLIG2—in i-NPLCs. (J) Microarray analysis showing the global gene expression analysis of mouse brain derived neural progenitor cells and i-NPLCs. (K) Comparison of mRNA levels of early neural markers between endogenous mouse neural progenitors obtained P2 infant brain and i-NPLCs with respect to MEF control. (L–N) Transcript analysis of neural genes at different time points in MEFs transduced with either Oct4 and WT SOD2 (L) or OCT4 and mutSOD2 (M). Analysis of neural transcripts in cells cultured in NSC medium (N). (O) Immunofluorescence analysis of NESTIN in MEFs transduced with either OCT4 and WT or OCT4 and mutSOD2. Scale bar represents 100 μm. Mean ± SE of biological triplicates, ∗p < 0.05, ∗∗p < 0.01, ∗∗∗p < 0.001 compared with control MEF. Un-cropped full western blot images are available in data S1. List of primers used for transcript analysis and antibodies used for protein detection are available in Tables S1 and S2, respectively.
Figure 4
Figure 4
iNPLCs Differentiate to Mature Neurons In Vitro and In Vivo (A and B) mRNA levels of matured neural markers (A) and glial markers (B) in iNPLC clones differentiated in vitro. (C) Representative immunofluorescence image of matured neuronal and glial markers in iNPLC clones differentiated in vitro. (D) Representative immunohistochemistry image showing in vivo maturation of injected iNPLC cells harboring GFP plasmid. Mean ± SE, n = 3 independent experiments. Scale bar represents 50 μm. List of primers used for transcript analysis and antibodies used for protein detection are available in Tables S1 and S2, respectively.
Figure 5
Figure 5
SOD2 Enhances Mitochondrial Fusion Process (A) Representative confocal images showing modulation in mitochondrial architecture upon SOD2 knockdown in P40H1 cell line. The enlarged image of the boxed region is represented beside each main image. (B) Quantification of mitochondrial length upon SOD2 knockdown in P40H1 cell line. (C) Representative confocal images showing modulation in mitochondrial architecture upon over-expression of wild-type and redox activity mutant constructs of SOD2 in P40H1 cell line. (D) Change in mitochondrial length upon the over-expression of WT and mutant SOD2 in P40H1 cell line. (E) Mitochondrial superoxide levels upon over-expression of SOD2 wild-type and mutant SOD2 constructs as quantified using Mitosox Red staining. (F) Quantification of percentage of mitochondrial contacts upon SOD2 over-expression. (G) (i) Schematic representation depicting the bio-complementation assays used to quantify the mitochondrial fusion process and (ii) the relative fold change in mitochondrial fusion upon SOD2 over-expression as assayed using bio-complementation assay. Data representative of mean ± SE, n = 3 independent experiments, ∗∗p < 0.01, ∗∗∗p < 0.001. Scale bar represents 100 pixels. Twelve images per condition were analyzed and length of ∼400 mitochondria was calculated. See also Videos S1 and S2.
Figure 6
Figure 6
SOD2-Induced Neurogenesis Is by Enhancing Mitochondrial Fusion Process (A) Protein levels of mitochondrial fission (FIS1) and fusion (MFN1 and MFN2) markers upon SOD2 over-expression. (B) Representative images of mitochondria upon WT or mutSOD2 over-expression in cells where Mfn1, Mfn2, or both are knocked down. (C) Quantification of mitochondrial length in the conditions as mentioned in the (B). (D) mRNA levels of early neural markers (Foxg1 and Nestin) in P40H1 cells with conditions wherein SOD2 is over-expressed in cells with Mfn2 knockdown. (E) Representative immunofluorescence images of NESTIN in neural cells with Mfn 1, Mfn 2 individual or simultaneous knockdown and subsequent SOD2 over-expression. Scale bar represents 50 μm. (F) Relative fold change in the percentage of NESTIN-positive cells upon knockdown of Mfn 1, Mfn2, or both, and subsequent SOD2 over-expression. (G) Transcript analysis showing rescue in neural markers Sox1, Nestin, and Zic1 of mESCs differentiated to neural progenitors under Mfn2 shRNA and over-expression of SOD2 conditions. (H) Immunofluorescence images of NESTIN and SOX1 showing rescue in neural differentiation upon over-expression of SOD2 in Mfn2 knockdown background. (I) Transcript analysis of Nestin and (J) immunofluorescence for NESTIN and SOX1 showing rescue in neural differentiation of mESCs upon over-expression of antioxidant activity mutant SOD2 under Mfn2 shRNA condition. Scale bar represents 100 μm. Data representative of mean ± SE, n = 3 independent experiments, ∗p < 0.05, ∗∗p < 0.01, ∗∗∗p < 0.001. Number of mitochondria counted per condition ∼400. Un-cropped full western blot images are available in data S1. List of primers used for transcript analysis and antibodies used for protein detection are available in Tables S1 and S2, respectively.

Similar articles

Cited by

References

    1. Agostini M., Romeo F., Inoue S., Niklison-Chirou M.V., Elia A.J., Dinsdale D., Morone N., Knight R.A., Mak T.W., Melino G. Metabolic reprogramming during neuronal differentiation. Cell Death Differ. 2016;23:1502–1514. - PMC - PubMed
    1. Alvarez-buylla A., Garcı J.M. Neurogenesis in adult subventricular zone. J. Neurosci. 2002;22:629–634. - PMC - PubMed
    1. Arrázola M.S., Andraini T., Szelechowski M., Mouledous L., Arnauné-Pelloquin L., Davezac N., Belenguer P., Rampon C., Miquel M.C. Mitochondria in developmental and adult neurogenesis. Neurotox. Res. 2019;36:257–267. - PubMed
    1. Beckervordersandforth R., Ebert B., Schäffner I., Moss J., Fiebig C., Shin J., Moore D.L., Ghosh L., Trinchero M.F., Stockburger C. Role of mitochondrial metabolism in the control of early lineage progression and aging phenotypes in adult hippocampal neurogenesis. Neuron. 2017;93:560–573.e6. - PMC - PubMed
    1. Bond A.M., Ming G., Song H. Adult mammalian neural stem cells and neurogenesis: Five Decades Later. Cell Stem Cell. 2015;17:385–395. - PMC - PubMed