. 2020 Sep 17;23(10):101569.
doi: 10.1016/j.isci.2020.101569. eCollection 2020 Oct 23.

Lipid Droplets Maintain Energy Homeostasis and Glioblastoma Growth via Autophagic Release of Stored Fatty Acids

Affiliations

Lipid Droplets Maintain Energy Homeostasis and Glioblastoma Growth via Autophagic Release of Stored Fatty Acids

Xiaoning Wu et al. iScience. .

Abstract

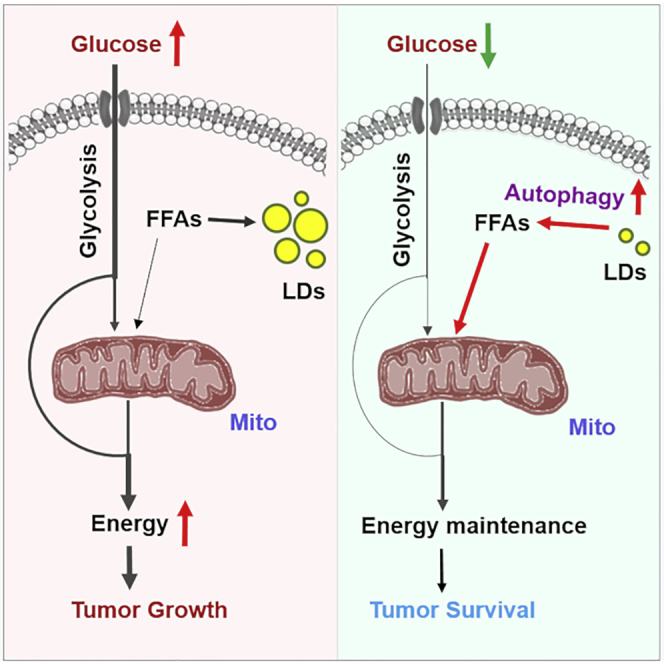
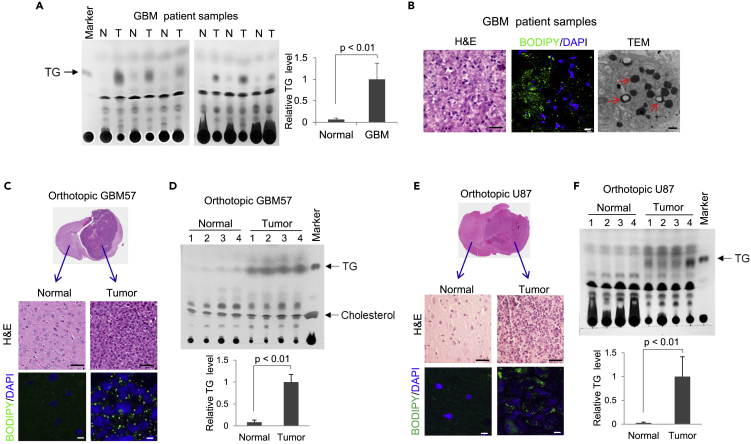
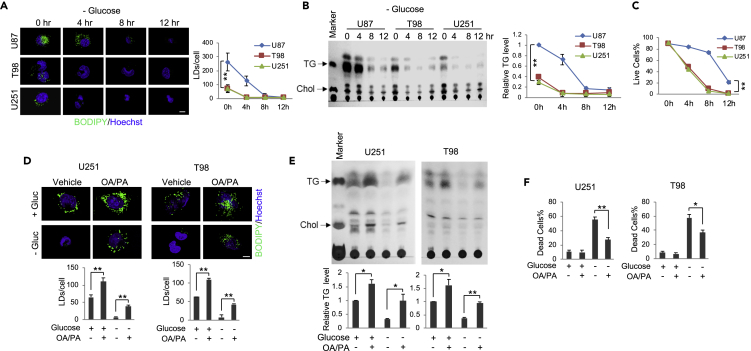
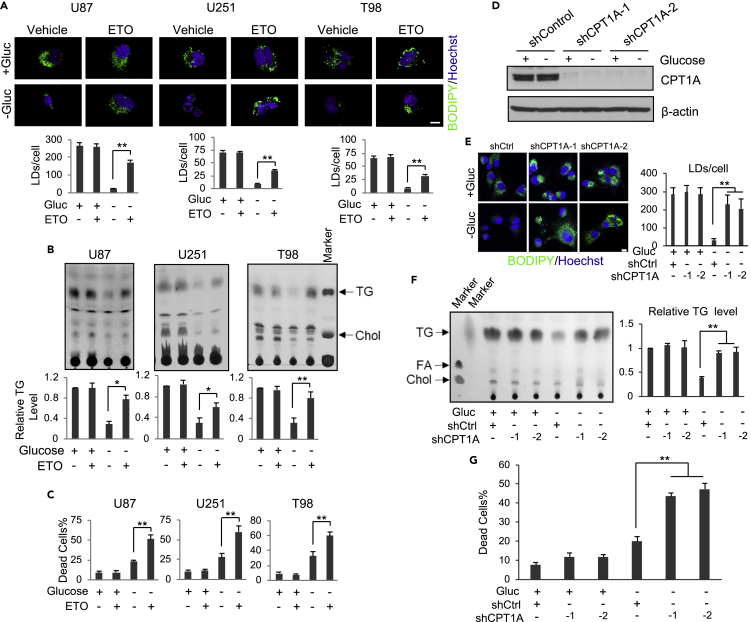
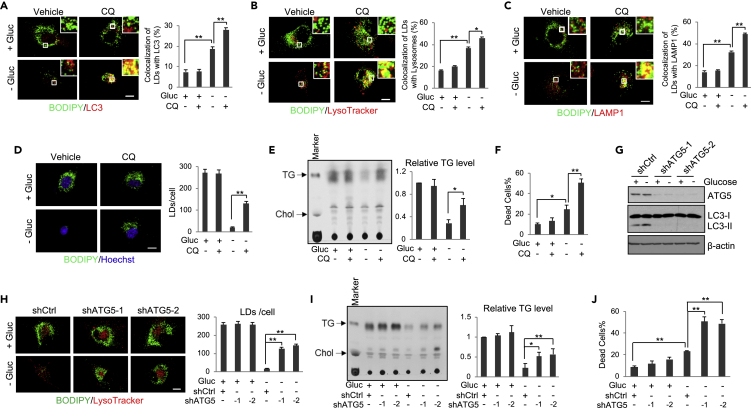
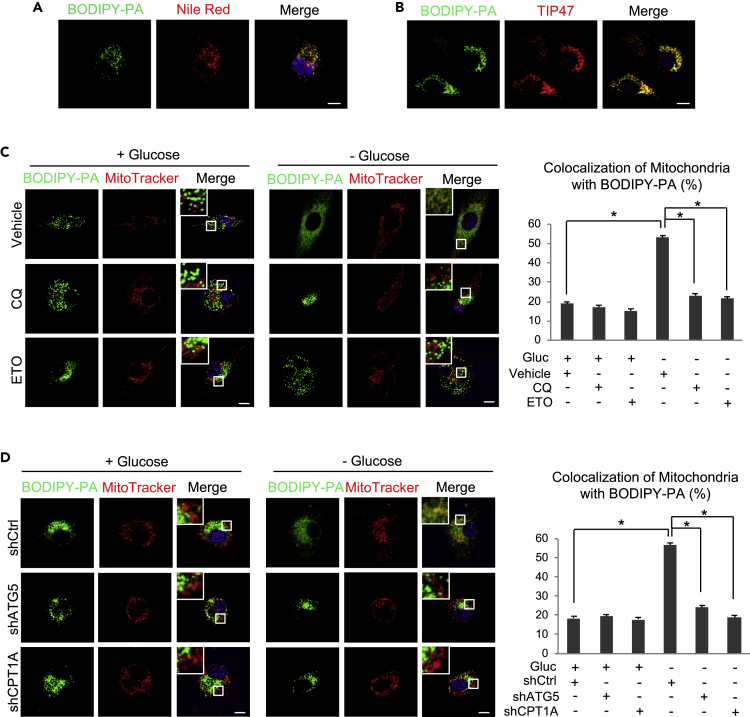
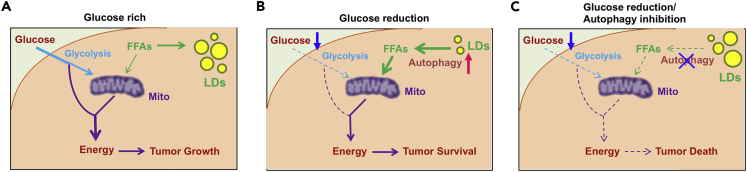
Recently, lipid metabolism reprogramming has been further evidenced in malignancies via the observation of large amounts of lipid droplets (LDs) in human tumors, including in glioblastoma (GBM), the most lethal primary brain tumor. However, the role played by LDs in tumor cells remains unknown. Here, we show that triglycerides (TG), the major components of LDs, serve as a critical energy reservoir to support GBM cell survival. TG/LDs rapidly diminished in GBM cells upon glucose reduction, whereas inhibiting fatty acid oxidation or autophagy resulted in the accumulation of TG/LDs and strongly potentiated GBM cell death. Immunofluorescence imaging and time-lapse videos showed that LDs are hydrolyzed by autophagy to release free fatty acids that mobilize into mitochondria for energy production. Our study demonstrates that autophagy-mediated hydrolysis of TG/LDs maintains energy homeostasis and GBM survival upon glucose reduction, suggesting that limiting TG/LDs utilization might be necessary upon treating GBM.

Keywords: Cancer; Cell Biology; Cellular Physiology.


Conflict of interest statement

The authors declare that there are no conflicts of interest for this manuscript.

Figures

None
Graphical abstract
Figure 1
Figure 1
GBM Tumor Tissues Contain Large Amounts of TG and LDs (A) Thin-layer chromatography (TLC) analysis of total lipid extracts from the same weight (4 mg) of normal (N) versus tumor (T) tissues from GBM patient autopsy samples (middle panel). TG standard loaded on the left. The intensity of TLC TG bands for each sample was quantified by the ImageJ software and normalized to the average intensity of TG in six tumor tissues to determine the relative TG levels between normal brain and GBM tissue (mean ± SD, n = 6) (right panel). Significance was determined by unpaired Student's t test. (B) Representative images of tumor tissues from GBM patient biopsy stained by H&E (left panel), BODIPY 493/503 (green), and DAPI (blue) (middle panel) or visualized by transmission electron microscopy (TEM) (right panel). Red arrows in TEM image indicate LDs. Scale bar: 50 μm for H&E, 10 μm for fluorescence imaging, 500 nm for TEM. (C–F) Representative images of normal and tumor tissues from primary GBM57- (C) or U87-derived (E) orthotopic mouse models stained by H&E or BODIPY 493/503 (green)/DAPI (blue). Scale bar: 50 μm for H&E; 10 μm for fluorescence imaging. TLC analysis of total lipid extracts from normal and tumor tissues from GBM57 (D) or U87 (F) orthotopic mice. Relative TG levels were quantified by ImageJ software and normalized to the average TG levels in tumor tissues (mean ± SD, n = 4). Significance was determined by an unpaired Student's t test. Please also see Figure S1A.
Figure 2
Figure 2
Glucose Deprivation Triggers GBM Cells Hydrolyzing TG/LDs to Support Cell Survival (A–C) U87, T98, and U251 GBM cells were cultured in medium with 25 mM glucose or no glucose for 4, 8, and 12 h. Cells were stained with BODIPY 493/503 (green)/Hoechst 33342 (blue) and observed by confocal microscopy (A). Quantification of LDs/cell for over 30 cells was conducted using the ImageJ software (mean ± SD). Total lipids were extracted and analyzed by TLC (B). TG levels at different time points and in various cell lines were normalized to U87 cells cultured in 25 mM glucose medium (mean ± SD, n = 3). Live cell percentage at different time points after glucose withdrawal was determined after trypan blue staining (mean ± SD, n = 3) (C). Significance between different cell lines was determined by two-way ANOVA. ∗∗p < 0.001; ∗p < 0.01. Chol, cholesterol. (D–F) U251 and T98 cells were cultured in medium with/without palmitic acid (PA, C16:0, 5 μM) and oleic acid (OA, C18:1, 5 μM) mixtures (1:1) for 24 h and then placed in fresh medium in the absence or presence of glucose (Gluc, 25 mM) for 4 h. Cells were stained with BODIPY 493/503 (green)/Hoechst 33342 (blue) and observed by confocal microscopy (D). Quantification of LDs/cell in over 30 cells was conducted using ImageJ (mean ± SEM). Total lipid extracts from these cells were analyzed by TLC (E). Relative TG levels were quantified by ImageJ and normalized to the control cells (mean ± SD, n = 3) (E). Cell death was determined by trypan blue exclusion (mean ± SD, n = 3) (F). Significance was determined by one-way ANOVA. ∗∗p < 0.01, ∗p < 0.05. Please also see Figure S1B.
Figure 3
Figure 3
TG/LDs Accumulate upon the Inhibition of Fatty Acid β-Oxidation under Glucose-Free Conditions, Leading to Increased GBM Cell Death (A and B) Representative fluorescence images of LDs stained with BODIPY 493/503 (green)/Hoechst 33342 (blue) (A). TLC analysis of total lipids (B) in U87 (8 h), U251, and T98 cells (4 h) after treatment with/without ETO (100 μM) in the absence or presence of glucose (25 mM). LDs/cell (mean ± SEM, n = 30) and TG levels (mean ± SD, n = 3) were quantified by ImageJ and normalized to the control cells. (C) Cell death was determined in U87 (8 h), U251, and T98 cells (3 h) after treatment with/without ETO (100 μM) in the absence or presence of glucose (25 mM) by trypan blue staining (mean ± SD, n = 3). (D–G) U87 cells were transfected with CPT1A shRNA-expressing lentivirus for 24 h and then cultured in glucose-free or 25 mM glucose medium for 8 h. Cells were analyzed by western blotting (D), observed by confocal microcopy after BODIPY 493/503 and Hoechst 33342 staining (E), or analyzed by TLC for lipid levels (F). LDs/cell (mean ± SEM, n = 30) or relative TG levels (mean ± SD, n = 3) were determined by ImageJ. Cell death was determined after trypan blue staining (mean ± SD, n = 3) (G). FA, fatty acids. Significance was determined by one-way ANOVA. ∗∗p < 0.01, ∗p < 0.05. Please also see Figure S2.
Figure 4
Figure 4
TG/LDs are Hydrolyzed by Autophagy to Support GBM Cell Survival upon Glucose Deprivation (A) Representative fluorescence images of U87 cells stained with BODIPY 493/503 (green) and anti-LC3 antibody (red) in the absence or presence of glucose (25 mM) and chloroquine (CQ, 5 μM) for 6 h. The co-localization was quantified by ImageJ (mean ± SEM) in over 30 cells. (B and C) Representative fluorescence images of U87 cells co-stained with BODIPY 493/503 (green) and LysoTracker (red) (B) or anti-LAMP1 antibody (red) (C) in the presence or absence of glucose (25 mM) and CQ (5 μM) for 6 h. The co-localization was quantified by ImageJ (mean ± SEM, n = 30). (D–F) Representative fluorescence images of U87 cells stained with BODIPY 493/503 (green) and Hoechst 33342 (blue) in the absence or presence of glucose (25 mM) and CQ (5 μM) for 8 h. LDs/cell were quantified in 30 cells (mean ± SEM, n = 30) (D). Their total lipids were analyzed by TLC (mean ± SD, n = 3) (E). Cell death was determined after trypan blue staining (mean ± SD, n = 3) (F). (G–J) U87 cells were transfected with ATG5 shRNA-expressing lentivirus for 24 h and then cultured in medium without/with glucose (25 mM) for 8 h. Cell lysates were subjected to western blotting analysis using the indicated antibodies (G). Cells were stained with BODIPY 493/503 (green) and LysoTracker (red) and observed by confocal microscopy (H). Total cellular lipids were analyzed by TLC (I). Cell death was determined after trypan blue staining (J). Quantification and significance determination of LD number, relative TG levels, and cell death were same as in panels D–F. Statistical significance was determined by one-way ANOVA for this entire figure; ∗∗p < 0.01, ∗p < 0.05. Please also see Figures S3 and S4, and Videos S1, S2, S3, and S4.
Figure 5
Figure 5
LD-Stored Fatty Acids Released by Autophagy Move into Mitochondria for Energy Production (A and B) Representative fluorescence images of U87 cells after culturing with BODIPY-labeled PA (C16:0; Cat# D3821, Life Technologies) (0.5 μM) for 12 h and then staining with Nile red and Hoechst 33342 (blue) (A) or with anti-TIP47 antibody (red) (B). Scale bar: 10 μm. (C) U87 cells were cultured with BODIPY-PA (0.5 μM) for 12 h and then treated with/without CQ (5 μM) or ETO (100 μM) in the absence or presence of glucose (25 mM) for 8 h. Cells were then stained with MitoTracker (Red) and Hoechst 33342 (blue) and visualized by confocal microscopy. The co-localization of diffused BODIPY-PA and mitochondria was determined by the ratio of co-localized red and green signal (yellow) to total red signal using the ImageJ software (mean ± SEM, n = 30). Significance was determined by one-way ANOVA. ∗p < 0.01. (D) U87 cells were transfected with shRNA-expressing lentivirus against ATG5 or CPT1A for 24 h and then cultured with BODIPY-labeled PA (0.5 μM) for 12 h. Cells were then placed into fresh medium without/with glucose (25 mM) for 8 h. Cell staining and quantification of the co-localization of BODIPY-PA and mitochondria were the same as in Panel C. Significance was determined by one-way ANOVA. ∗p < 0.01.
Figure 6
Figure 6
Schematic Model of TG/LDs Hydrolysis Mediated by Autophagy, Maintaining GBM Cell Energy Homeostasis and Survival (A–C) GBM cells maintain energy homeostasis by utilizing glucose and TG/LDs. Under glucose-rich conditions, GBM cells mainly use glucose for energy production (A). Upon glucose starvation, autophagy is activated, which breaks down TG/LDs and releases the stored fatty acids that enter mitochondria for energy production (B). Blocking TG/LDs hydrolysis via inhibiting autophagy upon glucose reduction conditions will induce dramatic GBM cell death (C).

References

    1. Accioly M.T., Pacheco P., Maya-Monteiro C.M., Carrossini N., Robbs B.K., Oliveira S.S., Kaufmann C., Morgado-Diaz J.A., Bozza P.T., Viola J.P. Lipid bodies are reservoirs of cyclooxygenase-2 and sites of prostaglandin-E2 synthesis in colon cancer cells. Cancer Res. 2008;68:1732–1740. - PubMed
    1. Aird K.M., Worth A.J., Snyder N.W., Lee J.V., Sivanand S., Liu Q., Blair I.A., Wellen K.E., Zhang R. ATM couples replication stress and metabolic reprogramming during cellular senescence. Cell Rep. 2015;11:893–901. - PMC - PubMed
    1. Amaravadi R.K., Yu D., Lum J.J., Bui T., Christophorou M.A., Evan G.I., Thomas-Tikhonenko A., Thompson C.B. Autophagy inhibition enhances therapy-induced apoptosis in a Myc-induced model of lymphoma. J. Clin. Invest. 2007;117:326–336. - PMC - PubMed
    1. Bao S., Wu Q., McLendon R.E., Hao Y., Shi Q., Hjelmeland A.B., Dewhirst M.W., Bigner D.D., Rich J.N. Glioma stem cells promote radioresistance by preferential activation of the DNA damage response. Nature. 2006;444:756–760. - PubMed
    1. Brace L.E., Vose S.C., Stanya K., Gathungu R.M., Marur V.R., Longchamp A., Trevino-Villarreal H., Mejia P., Vargas D., Inouye K. Increased oxidative phosphorylation in response to acute and chronic DNA damage. NPJ Aging Mech. Dis. 2016;2:16022. - PMC - PubMed