. 2020 Sep 23;23(10):101596.
doi: 10.1016/j.isci.2020.101596. eCollection 2020 Oct 23.

Unique Epigenetic Programming Distinguishes Regenerative Spermatogonial Stem Cells in the Developing Mouse Testis

Affiliations

Unique Epigenetic Programming Distinguishes Regenerative Spermatogonial Stem Cells in the Developing Mouse Testis

Keren Cheng et al. iScience. .

Abstract

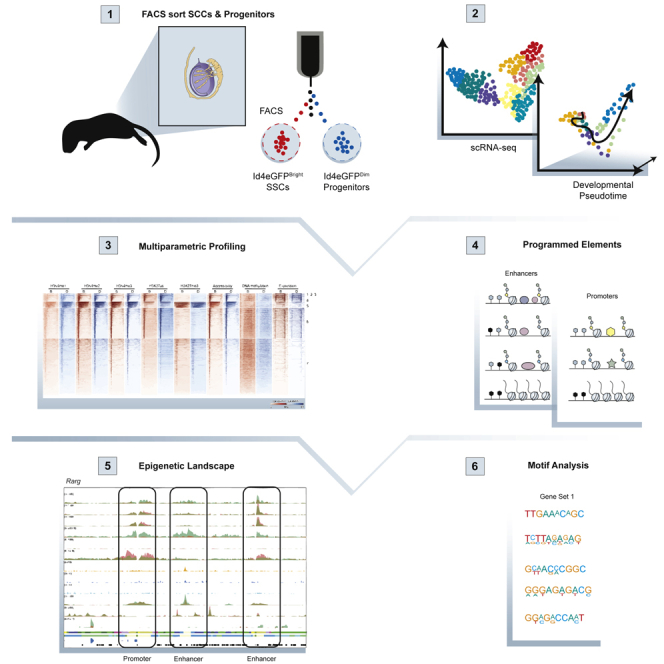
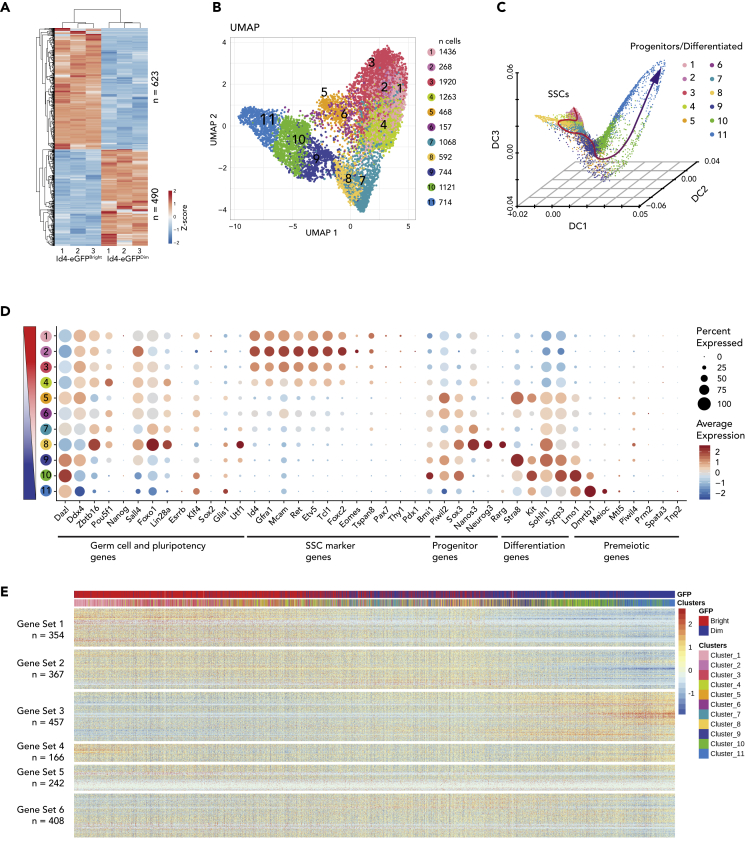
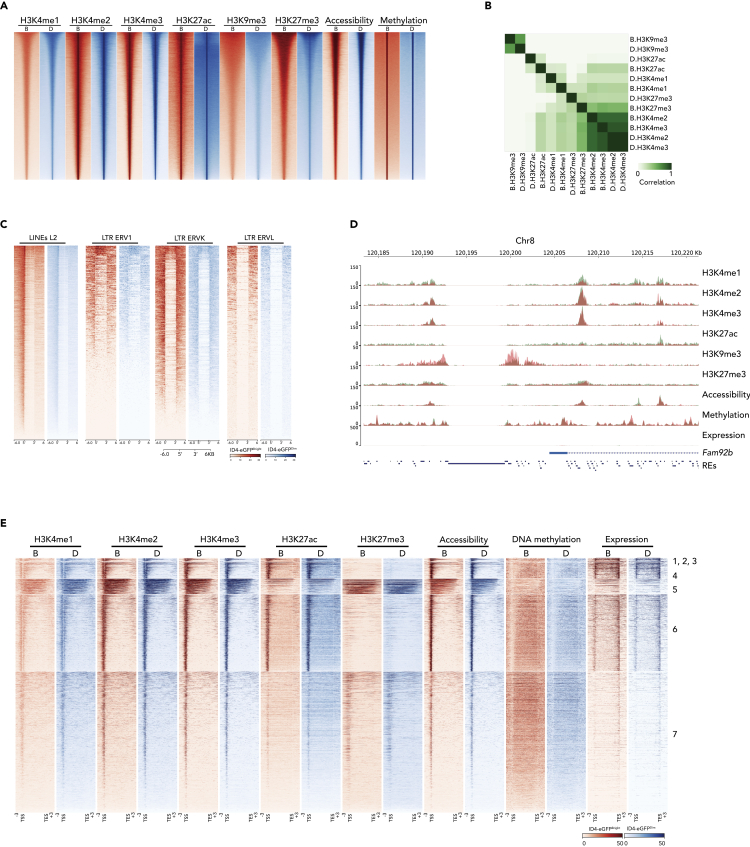
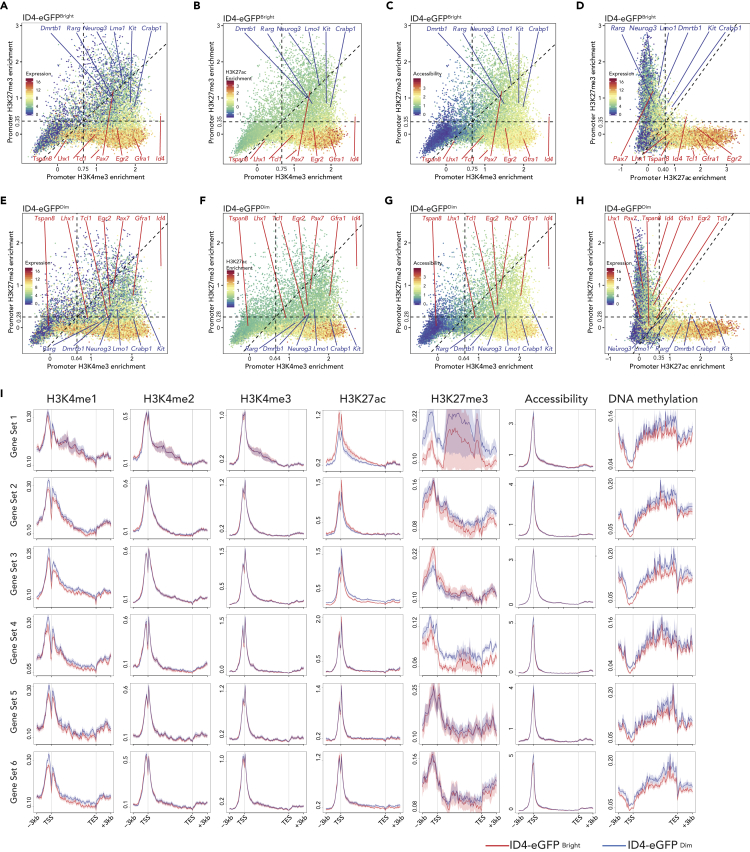
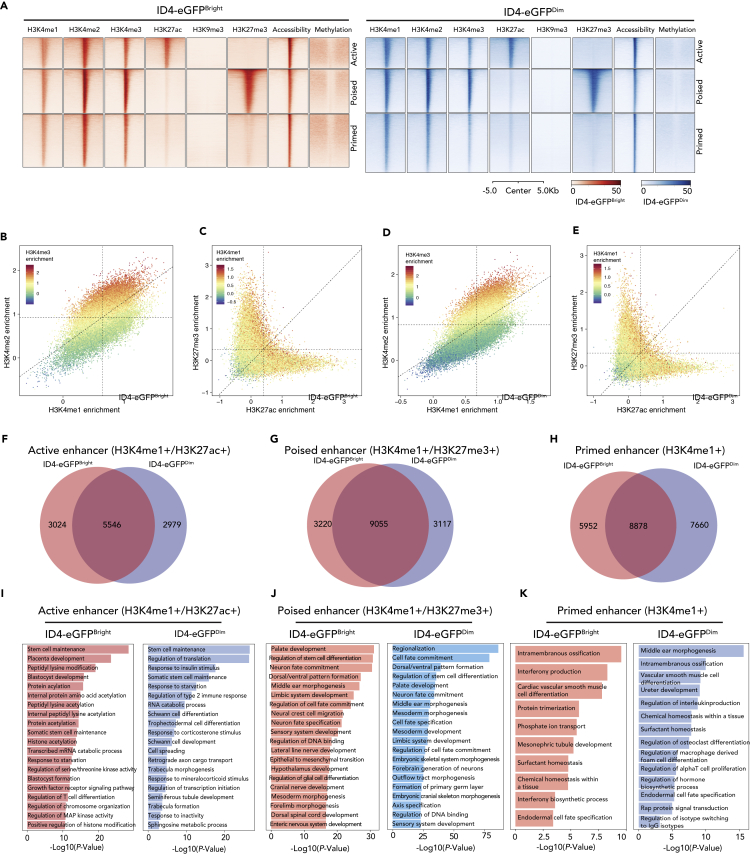
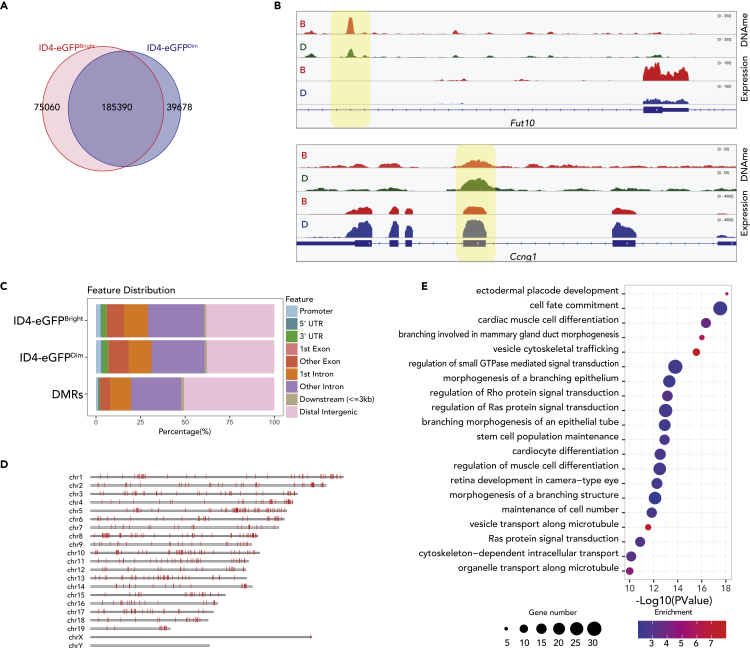
Spermatogonial stem cells (SSCs) both self-renew and give rise to progenitors that initiate spermatogenic differentiation in the mammalian testis. Questions remain regarding the extent to which the SSC and progenitor states are functionally distinct. Here we provide the first multiparametric integrative analysis of mammalian germ cell epigenomes comparable with that done for >100 somatic cell types by the ENCODE Project. Differentially expressed genes distinguishing SSC- and progenitor-enriched spermatogonia showed distinct histone modification patterns, particularly for H3K27ac and H3K27me3. Motif analysis predicted transcription factors that may regulate spermatogonial subtype-specific fate, and immunohistochemistry and gene-specific chromatin immunoprecipitation analyses confirmed subtype-specific differences in target gene binding of a subset of these factors. Taken together, these results show that SSCs and progenitors display distinct epigenetic profiling consistent with these spermatogonial subtypes being differentially programmed to either self-renew and maintain regenerative capacity as SSCs or lose regenerative capacity and initiate lineage commitment as progenitors.

Keywords: Developmental Genetics; Omics.


Conflict of interest statement

The authors declare no conflict of interest.

Figures

None
Graphical abstract
Figure 1
Figure 1
Differential Gene Expression in SSC-Enriched and Progenitor-Enriched Spermatogonial Subpopulations (A) Differential gene expression profiling of ID4-eGFPBright and ID4-eGFPDim spermatogonia by bulk RNA-seq. Genes with >1.5 LFC (Log2 Fold Change difference >1.5, p < 0.01) were hierarchically clustered. Red–blue colors indicate high–low expression levels in Z score. Gene-specific results of bulk RNA-seq can be found in Table S1. (B) Subpopulations among P6 ID4-eGFPBright and ID4-eGFPDim spermatogonia are revealed in this UMAP display of single-cell RNA-seq (scRNA-seq) data. Each dot represents a single cell. The cell number in each cluster is indicated via color coding. (C) Developmental trajectory of neonatal spermatogonia. A dynamic diffusion map shows the developmental progression of ID4-eGFPBright to ID4-eGFPDim spermatogonia in pseudotime. (D) Scaled average expression of selected marker genes and the percentage of cells within each cluster with detectable expression (dot radius) for each selected marker gene within each cell cluster. The cell cluster order was arranged by Diffusion Map from top to bottom. (E) Scaled, normalized expression of the 2,000 most variably expressed genes in ID4-eGFPBright and ID4-eGFPDim spermatogonia. Cells are ordered along their pseudotime developmental progression shown in Figure 1C. The top bar indicates the progression from ID4-eGFPBright (red) to ID4-eGFPDim (blue) cells based on intensity of ID4-eGFP expression. The lower bar represents the cell clusters identified according to the color code shown in Figure 1B. These 2,000 most variably expressed genes were hierarchically clustered into six gene sets based on expression patterns throughout the pseudotime progression. A detailed list of variably expressed genes is provided in Table S1.
Figure 2
Figure 2
Epigenetic Profiling of Genic Regions in ID4-eGFPBright and ID4-eGFPDim Spermatogonial Subpopulations (A) A heatmap shows peaks of histone modifications (H3K4me1, H3K4me2, H3K4me3, H3K9me1, H3K27ac, and H3K27me3) deduced by ChIP-seq, chromatin accessibility deduced by ATAC-seq, and DNA methylation deduced by MeDIP-seq in ID4-eGFPBright and ID4-eGFPDim spermatogonia. Red color indicates reads from ID4-eGFPBright B cells; blue color indicates reads from ID4-eGFPDim D cells. (B) A heatmap depicts correlations among individual histone modification patterns in ID4-eGFPBright and ID4-eGFPDim spermatogonia. (C) Heatmaps of H3K9me3 deposition in four types of repeats—LINEs(L2) and LTRs (ERV1, ERVK, ERVL) in ID4-eGFPBright (red) and ID4-eGFPDim (blue) spermatogonia. (D) A genome browser snapshot showing sequencing reads of six histone modifications, chromatin accessibility, DNA methylation, and transcript expression in ID4-eGFPBright (coral colored tracks) and ID4-eGFPDim spermatogonia (green colored tracks). The location of a gene that is expressed in both ID4-eGFPBright and ID4-eGFPDim spermatogonia (Fam92b) as well as that of repeat elements is shown at the bottom of this browser image. (E) Epigenetic profiles within genic regions (TSS – TES + 3 kb upstream and 3 kb downstream) of all mouse Refseq annotated genes (n = 24,012) in ID4-eGFPBright (red tracks, B) and ID4-eGFPDim (blue tracks, D) spermatogonia together with corresponding transcript expression tracks. K-means clustering revealed seven distinct epigenetic profiles, including three that are too small to visually resolve (1–3). The order of genes represented in these tracks is shown in Table S2.
Figure 3
Figure 3
Epigenetic Profiling at Promoters in ID4-eGFPBright and ID4-eGFPDim Spermatogonia (A–H) Scatterplots correlating H3K4me3 (x axis) and H3K27me3 (y axis) enrichments (log2RPKM) at promoters (TSS ±500 bp) in ID4-eGFPBright (A–C) and ID4-eGFPDim (E–G) spermatogonia. Color codes indicate gene expression levels (A, E), H2K27ac enrichment (B and F), and chromatin accessibility (C and G) at promoters. H3K27ac/H3K27me3 double ChIP-seq signal enrichment correlated with gene expression levels at promoters in ID4-eGFPBright and ID4-eGFPDim spermatogonia (D and H). (I) Comparisons of histone modification, chromatin accessibility, and DNA methylation levels (RPKM, Reads Per Kilobase of sequence range per Million mapped reads) in the most differentially expressed gene sets in ID4-eGFPBright (red trace) and ID4-eGFPDim (blue trace) spermatogonia.
Figure 4
Figure 4
Epigenetic Profiling at Enhancers in ID4-eGFPBright and ID4-eGFPDim Spermatogonia (A) Heatmaps show profiles of each set of histone modification, chromatin accessibility, and DNA methylation peaks at sites of intergenic enhancers in ID4-eGFPBright (red) and ID4-eGFPDim (blue) spermatogonia. Peak profiles are shown for active, poised, and primed enhancers in each spermatogonial subtype. Genomic coordinates of enhancers shown in this figure are listed in Table S3. (B–E) Scatterplots showing positive or negative combinatorial enrichment of different histone modifications at enhancers. Dashed lines indicate the minimum threshold value indicative of enrichment within each bimodal distribution. Each dot is 1 enhancer. (B) Enrichment of the H3K4me3 modification correlates positively with enrichment of the H3K4me2 and H3K4me1 modifications. (C) Enrichment of the H3K4me1 modification correlates positively with enrichment of either the H3K27me3 or the H3K27ac modifications, but enrichment of the H3K27me3 modification correlates negatively with enrichment of the H3K27ac modification, and vice versa. (D) Enrichment of the H3K4me3 modification correlates positively with enrichment of either the H3K27me3 or the H3K27ac modifications, but enrichment of the H3K27me3 modification correlates negatively with enrichment of the H3K27ac modification, and vice versa. (F–H) Venn diagrams show proportions of active (F), poised (G), and primed (H) enhancers unique to ID4-eGFPBright spermatogonia, common to both ID4-eGFPBright and ID4-eGFPDim spermatogonia, or unique to ID4-eGFPDim spermatogonia. (I–K) GREAT GO analysis of functions encoded by genes associated with active (I), poised (J), or primed (K) enhancers in ID4-eGFPBright or ID4-eGFPDim spermatogonia.
Figure 5
Figure 5
DNA Methylation Profiles in ID4-eGFPBright and ID4-eGFPDim Spermatogonia (A) Venn diagrams show proportions of DNA methylation peaks unique to ID4-eGFPBright spermatogonia, common to both ID4-eGFPBright and ID4-eGFPDim spermatogonia, or unique to ID4-eGFPDim spermatogonia. (B) Genome browser snapshots showing correlations or lack thereof between DNA methylation and transcript peaks in ID4-eGFPBright (B, orange tracks) and ID4-eGFPDim (D, green or blue tracks) spermatogonia in regions encompassing a gene that is up-regulated in ID4-eGFPBright spermatogonia (Fut10) and a gene that is up-regulated in ID4-eGFPDim spermatogonia (Ccng1). Differentially methylated regions within gene bodies, but not at promoters, appear to be positively correlated with gene expression levels. (C) The distribution of DNA methylation peaks in each spermatogonial subtype and DMRs between the two subtypes is shown. DMRs were rare at promoters but abundant in intra- and intergenic regions. (D) DMRs were found throughout the autosomes, but, with one exception, not on the sex chromosomes. Genomic coordinates of DMRs are shown in Table S4. (E) GREAT-GO analysis of genes associated with DMRs. The color code indicates the enrichment levels of DMR-associated genes (blue–red = low–high). Dot diameters indicate the number of DMR-associated genes within each GO term.
Figure 6
Figure 6
Enrichment of Transcription Factor Binding Sites Predicts Cell Type and Gene-Specific Patterns of Expression and Binding of Specific Transcription Factors in ID4-eGFPBright and ID4-eGFPDim Spermatogonia (A) De novo motif discovery within promoters of genes most differentially expressed in ID4-eGFPBright and ID4-eGFPDim spermatogonia. (B–D) Differential enrichment of transcription factor binding motifs within active, poised, or primed enhancers in ID4-eGFPBright (red) and ID4-eGFPDim (blue) spermatogonia, including active enhancers (B), poised enhancers (C), and primed enhancers (D). (E) ChIP-qPCR confirms predicted binding patterns of specific transcription factors in ID4-eGFPBright and ID4-eGFPDim spermatogonia. FOXP1 preferentially binds to promoters of Egr1, Egr2, and Etv5 in ID4-eGFPBright spermatogonia. DMRTB1 preferentially binds to promoters of Syce2 and Sohlh2 in ID4-eGFPDim spermatogonia. LHX1 preferentially binds to the Cited2 gene promoter (Cited2.p), the Cited2 proximal enhancer (Cited2.e), and the Spry4 enhancer (Spry4.e). (F) Immunochemistry staining (IHC) of marker proteins in seminiferous cords in whole-mount sections of P6 mouse testes. GFRA1 and FOXC2 localized specifically to ID4-eGFPBright SSCs, OCT4 appeared in both ID4-eGFPBright SSCs and progenitor-enriched ID4-eGFPDim spermatogonia but was more prominent in the latter, FOXO1 and DMRTB1 localized specifically in progenitor-enriched ID4-eGFPDim spermatogonia, DMRT1 appeared in ID4-eGFPDim spermatogonia and some Sertoli cells, but not in ID4-eGFPBright SSCs, and EGR1 and REST co-localized with both ID4-eGFPBright SSCs and ID4-eGFPDim progenitor/early differentiating spermatogonia as well as in some somatic Sertoli cells. formula image
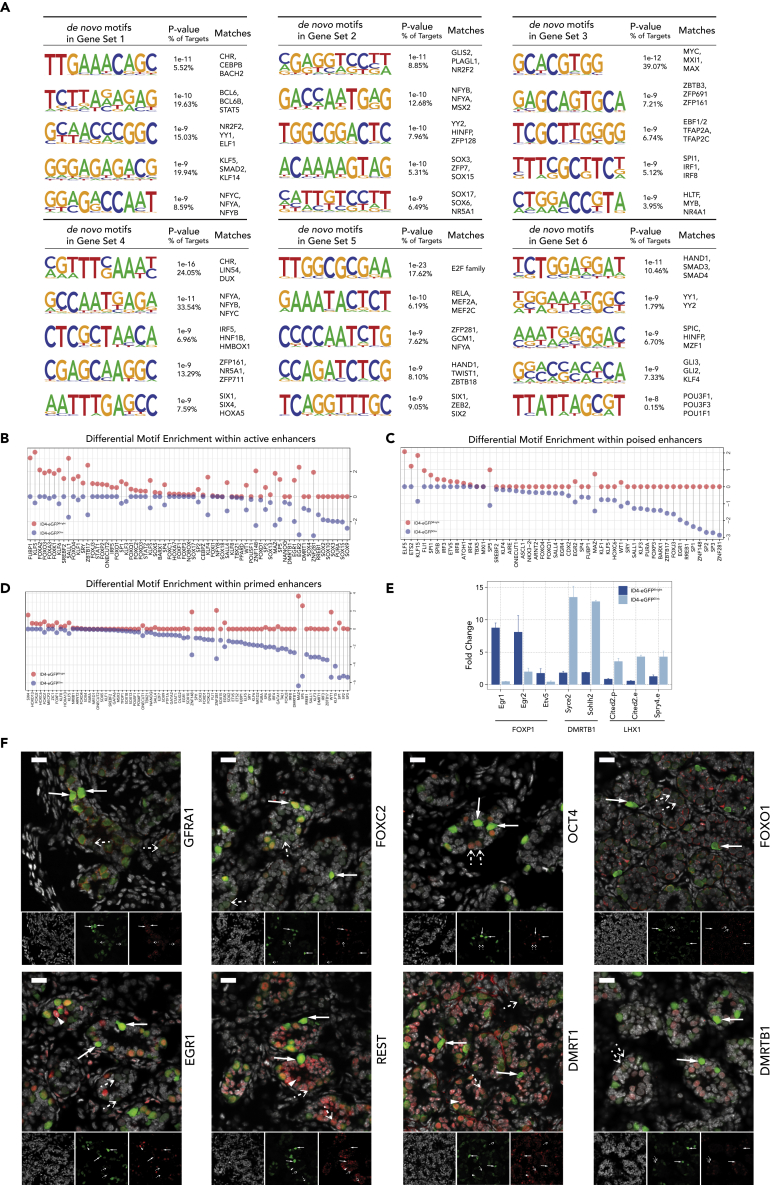
, ID4-eGFPBright spermatogonium; formula image, ID4-eGFPDim spermatogonium; formula image, Sertoli cell. Scale bars, 20 μm.
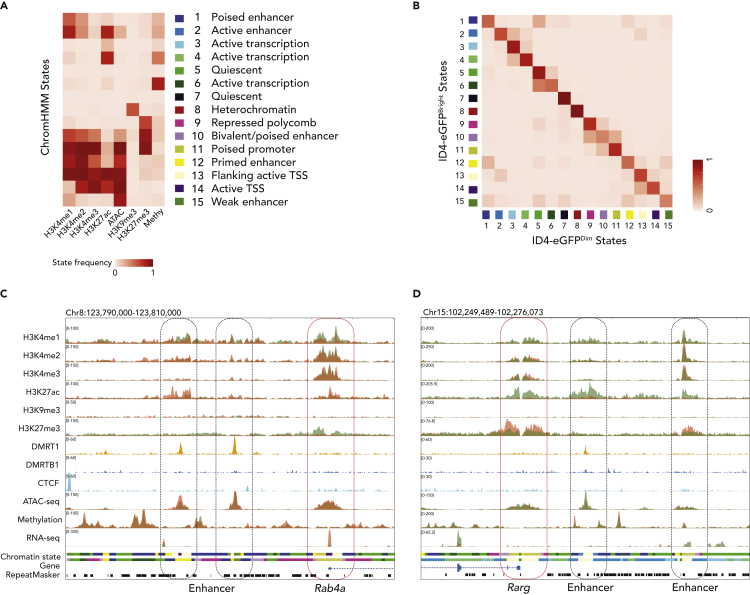
Figure 7
Figure 7
Coordinated Epigenetic Programming Correlates with Differential Gene Expression in ID4-eGFPBright and ID4-eGFPDim Spermatogonia (A) A heatmap shows that 15 distinct chromatin states are predicted by ChromHMM analysis of unique combinational patterns of eight different epigenetic parameters.(B) A heatmap reveals spermatogonial-subtype specific transitions among the 15 chromatin states color-coded to match those shown in Figure 7A. (C and D) Genome browser views from ID4-eGFPBright spermatogonia (coral colored tracks) and ID4-eGFPDim spermatogonia (green colored tracks) of epigenetic parameters associated with a gene (Rab4a) up-regulated in ID4-eGFPBright spermatogonia (C), and a gene (Rarg) up-regulated in ID4-eGFPDim spermatogonia (D). Note the elevated H3K27ac levels associated with both the enhancer and promoter regions of each gene in the spermatogonial subtype in which the gene is up-regulated and the elevated H3K27me3 levels associated with both the enhancer and promoter regions of each gene in the spermatogonial subtype in which the gene is down-regulated.

References

    1. Bailey T., Krajewski P., Ladunga I., Lefebvre C., Li Q., Liu T., Madrigal P., Taslim C., Zhang J. Practical guidelines for the comprehensive analysis of ChIP-seq data. PLoS Comput. Biol. 2013;9:e1003326. - PMC - PubMed
    1. Becker J.S., Nicetto D., Zaret K.S. H3K9me3-Dependent heterochromatin: barrier to cell fate changes. Trends Genet. 2016;32:29–41. - PMC - PubMed
    1. Brinster R.L., Avarbock M.R. Germline transmission of donor haplotype following spermatogonial transplantation. Proc. Natl. Acad. Sci. U S A. 1994;91:11303–11307. - PMC - PubMed
    1. Buaas F.W., Kirsh A.L., Sharma M., McLean D.J., Morris J.L., Griswold M.D., De Rooij D.G., Braun R.E. Plzf is required in adult male germ cells for stem cell self-renewal. Nat. Genet. 2004;36:647–652. - PubMed
    1. Buenrostro J.D., Giresi P.G., Zaba L.C., Chang H.Y., Greenleaf W.J. Transposition of native chromatin for fast and sensitive epigenomic profiling of open chromatin, DNA-binding proteins and nucleosome position. Nat. Methods. 2013;10:1213–1218. - PMC - PubMed