. 2020 Sep 4;23(9):101530.
doi: 10.1016/j.isci.2020.101530. eCollection 2020 Sep 25.

STING Mediates Lupus via the Activation of Conventional Dendritic Cell Maturation and Plasmacytoid Dendritic Cell Differentiation

Affiliations

STING Mediates Lupus via the Activation of Conventional Dendritic Cell Maturation and Plasmacytoid Dendritic Cell Differentiation

Arthid Thim-Uam et al. iScience. .

Erratum in

Abstract

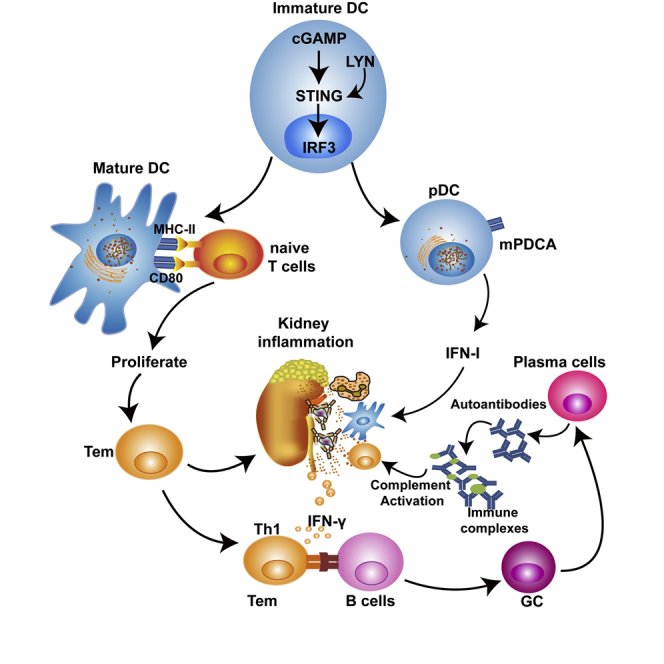
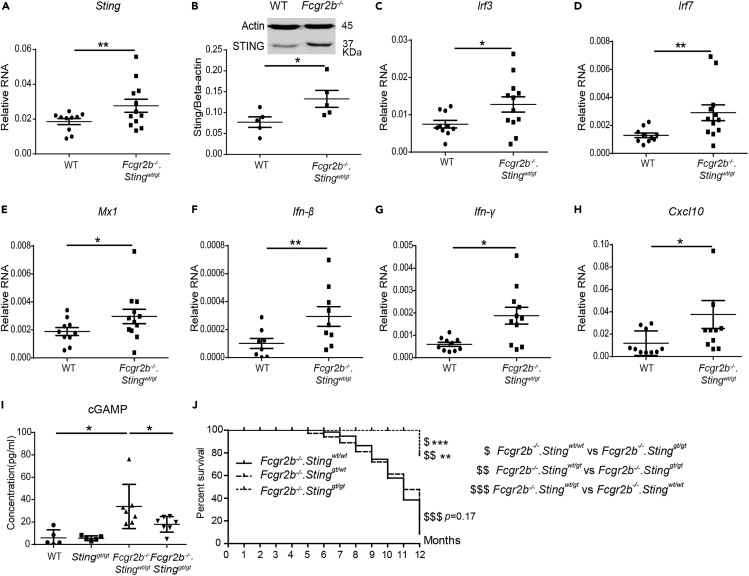
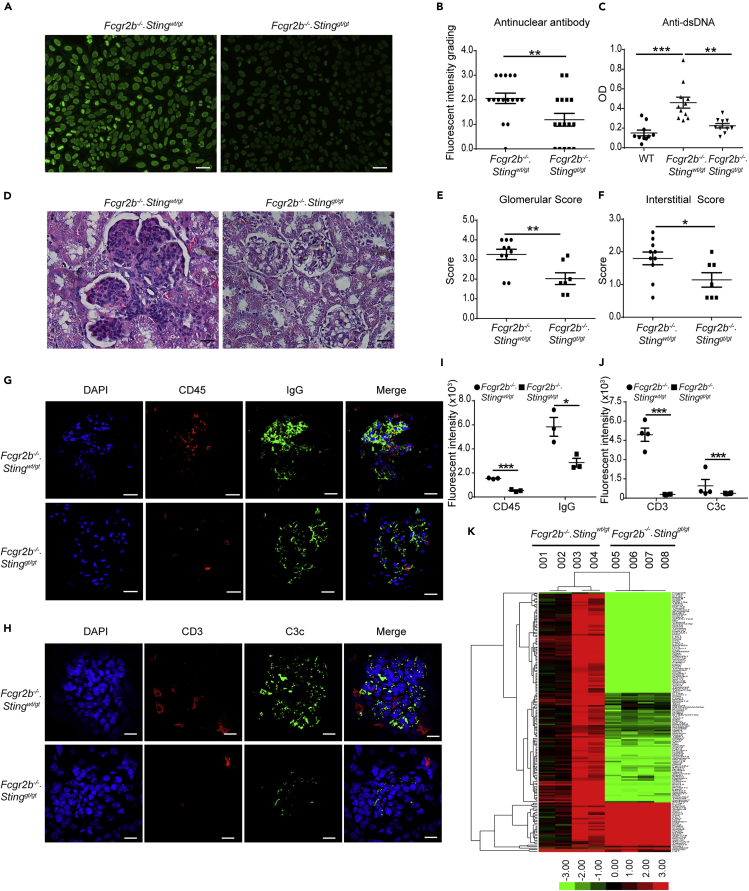
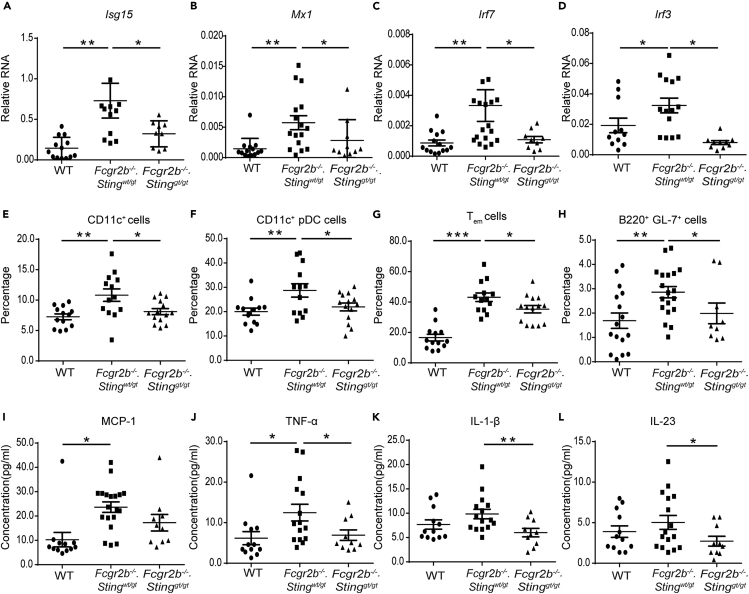
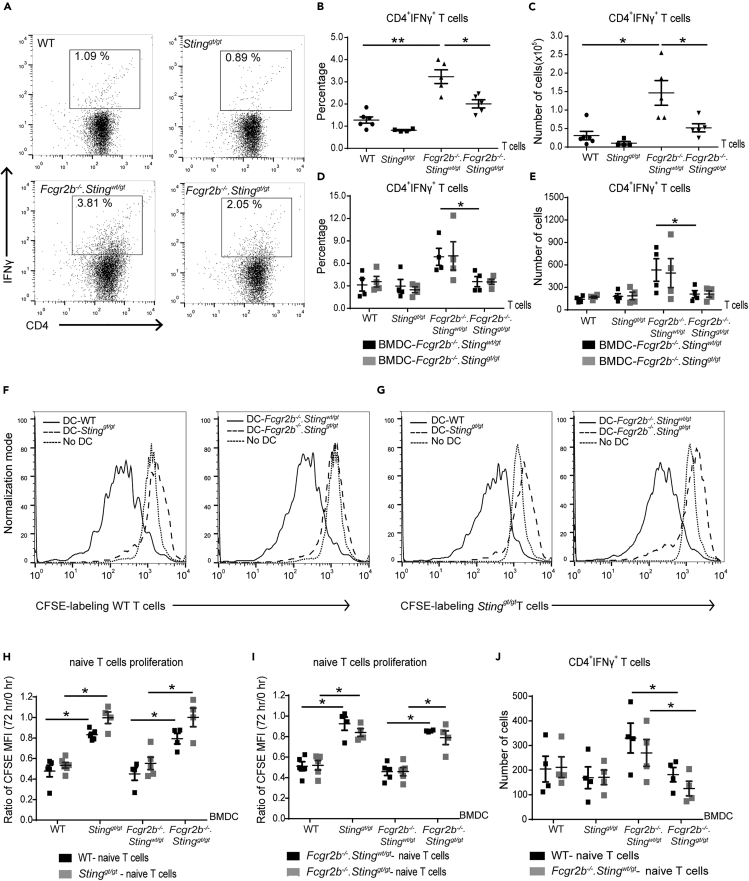
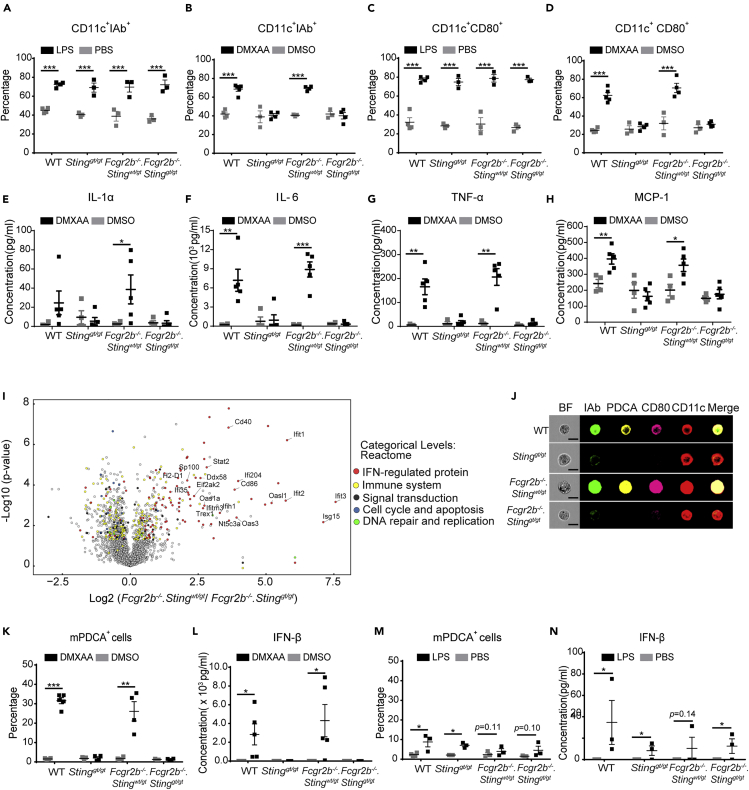
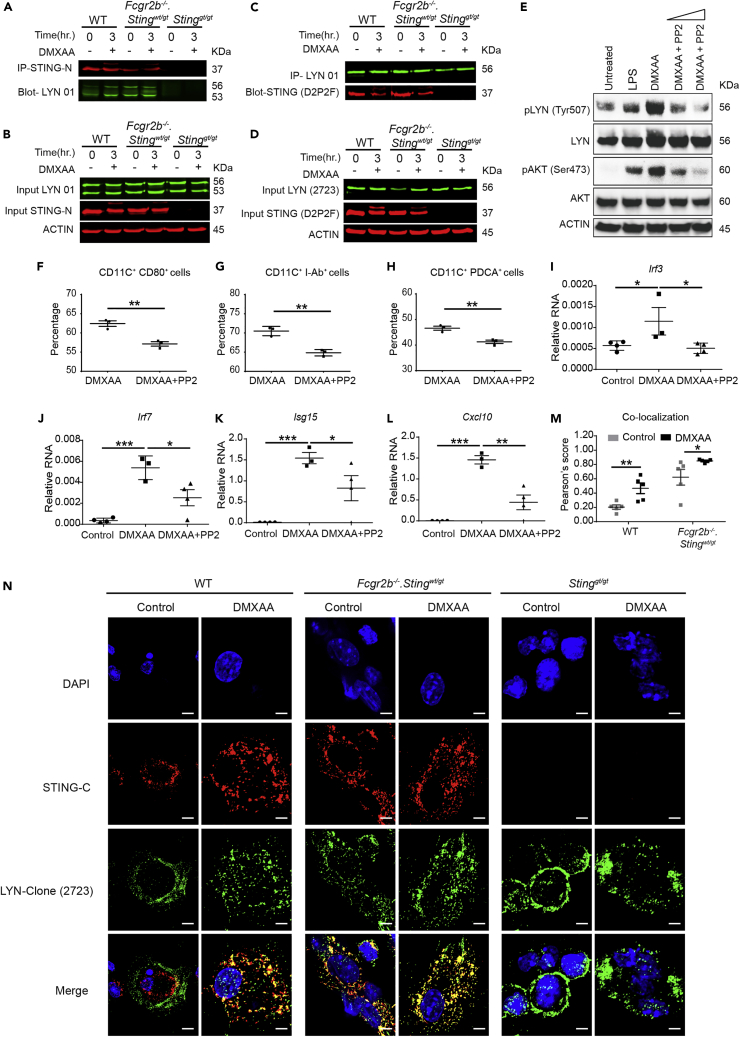
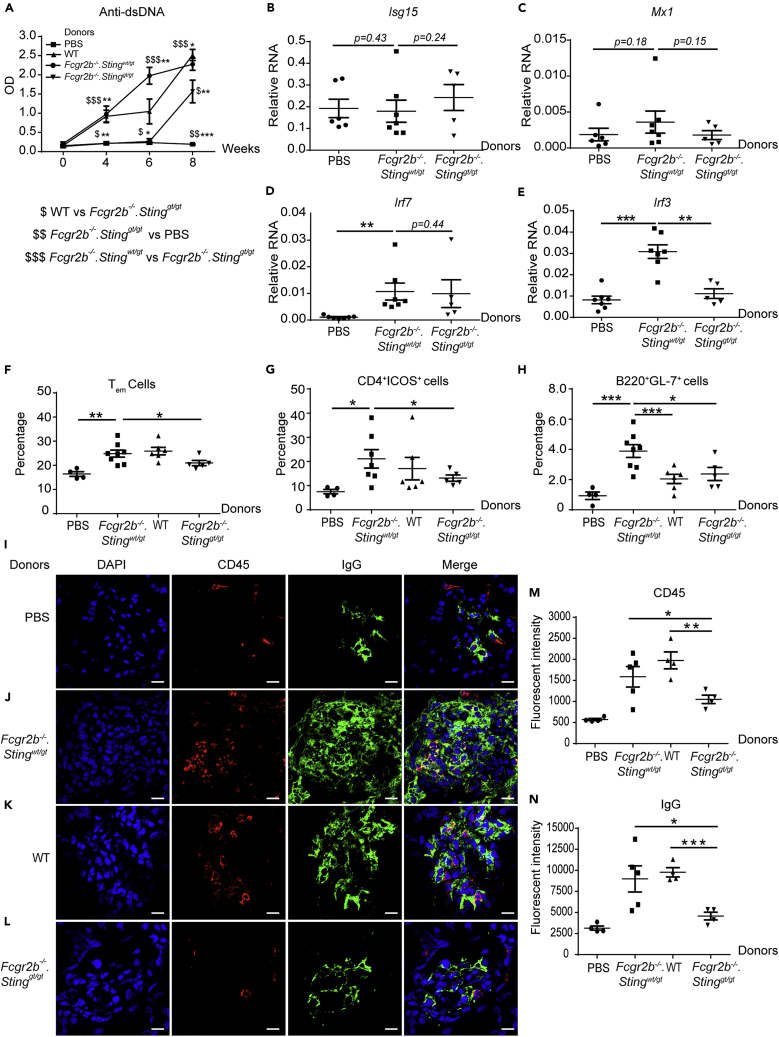
Signaling through stimulator of interferon genes (STING) leads to the production of type I interferons (IFN-Is) and inflammatory cytokines. A gain-of-function mutation in STING was identified in an autoinflammatory disease (STING-associated vasculopathy with onset in infancy; SAVI). The expression of cyclic GMP-AMP, DNA-activated cGAS-STING pathway, increased in a proportion of patients with SLE. The STING signaling pathway may be a candidate for targeted therapy in SLE. Here, we demonstrated that disruption of STING signaling ameliorated lupus development in Fcgr2b-deficient mice. Activation of STING promoted maturation of conventional dendritic cells and differentiation of plasmacytoid dendritic cells via LYN interaction and phosphorylation. The inhibition of LYN decreased the differentiation of STING-activated dendritic cells. Adoptive transfer of STING-activated bone marrow-derived dendritic cells into the FCGR2B and STING double-deficiency mice restored lupus phenotypes. These findings provide evidence that the inhibition of STING signaling may be a candidate targeted treatment for a subset of patients with SLE.

Keywords: Immunology; Molecular Biology; Molecular Genetics.


Conflict of interest statement

The authors declare no conflict of interest.

Figures

None
Graphical abstract
Figure 1
Figure 1
Loss of the Stimulator of Type I Interferon Genes (STING) Increases Survival of Fcgr2b−/− Lupus Mice (A and C–H) Gene expression profiles from spleens of wild-type and Fcgr2b−/− mice at the age of 6 months were tested by real-time PCR (N = 10–12 per group). The relative RNA expressions (normalized by actin) of (A) Sting, (C) Irf3, (D) Irf7, (E) Mx1, (F) Ifn-β, (G) Ifn-γ, and (H) Cxcl10 are shown. (B) Isolated splenocytes were analyzed for STING protein expression by western blot. Data are representative of three mice per group. Quantification of the intensity was normalized by actin (N = 3 per group). (I) The concentration of cGAMP from isolated splenocytes (N = 5–7). (J) The Fcgr2b-deficient mice were crossed with Sting-deficient mice (Stinggt/gt) to generate the double-deficient mice (Fcgr2b−/−. Stinggt/gt) and littermate controls. The survival curve of the mice was observed for up to 12 months (N = 14 per group). Error bars indicate SEM; ∗p < 0.05, ∗∗p < 0.01, and ∗∗∗p < 0.001. The dollar sign ($) shown the comparison between the group.
Figure 2
Figure 2
STING Signaling Pathway Promotes Autoantibody Production and Glomerulonephritis in the Fcgr2b−/− Lupus Mice (A)The anti-nuclear antibodies (ANA) were detected in the serum (dilution 1:800) using the immunofluorescence staining on Hep-2 cells (A). Data are representative of eight mice per group (scale bar, 20 μm). (B) Semi-quantification of ANA was graded by fluorescence intensity (N = 8 mice per group). (C) Anti-dsDNA from sera (dilution 1:100) of Fcgr2b−/− and Fcgr2b−/−. Stinggt/gt was detected by ELISA (N = 10–11 per group). (D) Kidney sections of Fcgr2b−/− and Fcgr2b−/−. Stinggt/gt mice (6–8 months old) were stained with H&E. Data are representative of 7–10 mice per group (scale bar, 25 μm). (E–H) (E and F) Glomerular scores and interstitial scores of kidney sections were blindly graded (N = 7–10 per group). Immunofluorescence staining of the kidneys from Fcgr2b−/− and Fcgr2b−/−. Stinggt/gt mice show in (G) IgG (green), CD45 (red), and DAPI (blue) and (H) C3c (green), CD3 (red), and DAPI (blue). Data are representative of 3–4 mice per group (scale bar, 10 μm). (I and J) The quantitative immunofluorescence signal (I) CD45, and IgG, (J) CD3 and C3c (N = 3–4 mice per group). Data are shown as mean ± SEM; ∗p < 0.05, ∗∗p < 0.01 and ∗∗∗p < 0.001. (K) A heatmap of microarray data from the kidneys of Fcgr2b−/− and Fcgr2b−/−. Stinggt/gt mice show that the interferon signature genes significantly changed in the Fcgr2b−/−mice (N = 4 mice per group). Data shown in log2 (sample/wild-type).
Figure 3
Figure 3
STING is Essential for Inflammatory Phenotypes of the Fcgr2b−/− Lupus Mice (A–D) The relative RNA expression (normalized by actin) of (A) Isg15, (B) Mx1, (C) Irf7, and (D) Irf3 from the kidneys of wild-type, Fcgr2b−/−. Stingwt/gt, and Fcgr2b−/−. Stinggt/gt mice at the age of 6 months are shown (N = 10–17 per group). (E–H) Flow cytometry analysis of splenocytes isolated from wild-type, Fcgr2b−/−. Stingwt/gt, and Fcgr2b−/−. Stinggt/gt mice at the age of 6–7 months (N = 13–14 per group). Data are shown in the percentage of (E) CD11c+, (F) plasmacytoid dendritic cells (pDC), (G) Tem (CD3+CD4+CD44hiCD62Llo), and (H) B220+GL7+ cells. (I–L) The sera cytokines of wild-type, Fcgr2b−/−. Stingwt/gt, and Fcgr2b−/−. Stinggt/gt mice at the age of 6 months were analyzed by cytometric bead array. Serum cytokines of (I) MCP-1, (J) TNF-α, (K) IL-1β, and (L) IL-23 (N = 10–15 per group). Data are shown as mean ± SEM; ∗p < 0.05, ∗∗p < 0.01 and ∗∗∗p < 0.001.
Figure 4
Figure 4
STING-Activated Dendritic Cells Induce the Proliferation of Naive CD4+ T Cells (A–C) Flow cytometry analysis of (A and B) intracellular staining of IFN-γ-producing CD4+ T cells isolated from lymph nodes of wild-type, Stinggt/gt, Fcgr2b−/−.Stingwt/gt, and Fcgr2b−/−.Stinggt/gt mice at the age of 6–7 months. (A) Data are representative of 4–5 mice per group. (B) The percentage of IFN-γ+CD4+ T cells and (C) the number of IFN-γ+CD4+ T cells (N = 4–5 per group). (D and E) The isolated CD4+ T cells were co-cultured with stimulated BMDC for 6 h. The x axis shows the genotypes that CD4+ T cells were isolated. (D) The percentage and (E) the number of intracellular IFN-γ-producing CD4+ cells after co-culturing with DMXAA-activated BMDC from Fcgr2b−/−.Stingwt/gt and Fcgr2b−/−.Stinggt/gt (6–7 months old) for 6 h (N = 4–5). (F–J) Co-culture of naive T cells with DMXAA-activated BMDC from wild-type, Stinggt/gt, Fcgr2b−/−.Stingwt/gt, and Fcgr2b−/−.Stinggt/gt mice for 72 h. The x axis shows the genotypes that BMDCs were isolated. (F and G) The histogram of CFSE labeling T cells in the co-culture with BMDCs. Data are representative of 4–5 mice per group. (H and I) CFSE dilution of isolated naive T cells showed in the ratio of mean fluorescence intensity (MFI) at 72 h/initial labeling (time 0), and (J) the total numbers of IFN-γ+CD4+ T cells (N = 4 per group). Data are shown as mean ± SEM; ∗p < 0.05, and ∗∗p < 0.01.
Figure 5
Figure 5
STING Activation Promotes the Maturation of Dendritic Cells and the Differentiation of Plasmacytoid Dendritic Cells Bone marrows were isolated from wild-type, Stinggt/gt, Fcgr2b−/−. Stingwt/gt, and Fcgr2b−/−. Stinggt/gt mice at the age of 6 months. (A–D) IL-4 and G-CSF differentiated bone marrow-derived dendritic cells (BMDC) for 5 days were stimulated with LPS or DMXAA for 24 h. Flow cytometry analysis shows the percentage of (A and B) CD11c+ IAb+ cells and (C and D) CD11c+CD80+ cells. (E–H) Supernatants were collected and analyzed after DMXAA stimulation for 24 h. Cytometric bead array shows the levels of (E) IL-1α, (F) IL-6, (G) TNF-α, and (H) MCP-1. (I) Volcano plot of protein expressions from proteomic analysis of DMXAA-activated BMDC of Fcgr2b−/−. Stingwt/gt, and Fcgr2b−/−.Stinggt/gt mice at the age of 6–7 months (N = 4 per group). (J) Imaging flow cytometry of DMXAA-activated BMDC shows the representative staining of IAb (green), mPDCA (yellow), CD80 (pink), and CD11c (red) (N = 3 mice per group). (K and M) The percentage of pDC (PDCA+ cells) after (K) DMXAA activation and (M) LPS activation for 24 h (N = 3–4 per group). (L and N) The level of IFN-β from the culture supernatant of activated BMDC with (L) DMXAA and (N) LPS (N = 5 per group). Data are shown as mean ± SEM; ∗p < 0.05, ∗∗p < 0.01 and ∗∗∗p < 0.001.
Figure 6
Figure 6
STING Activation Induced DC Maturation and Promoted the Interaction between LYN and STING in DC (A–D) Fluorescent western blot shows (A) the immunoprecipitation (IP) with STING-N (red) and blots with Lyn (green) and (B) cell lysate of activated BMDC with DMXAA at 0 and 3 h (C) A reverse IP using the Lyn antibody and blot with STING antibody and (D) cell lysate of activated BMDC with DMXAA at 0 and 3 h. Data show a representative of four experiments. (E–L) (E) Western blot analysis of Sting-activated BMDC with or without PP2 inhibitor showed the phosphorylation of Lyn (Try507) and Akt (Ser473). Data are representative of three mice per group. Sting-activated BMDCs were cultured with Lyn inhibitor (PP2) and analyzed by (F–H) flow cytometry shows the percentage of (F) CD80+CD11c+, (G) I-Ab+CD11c+, and (H) PDCA+CD11c+ cells (N = 3 per group), and (I–L) the relative RNA expression (normalized by actin) of (I) Irf3, (J) Irf7, (K) Isg15, and (L) Cxcl10 are shown (N = 4 per group). (M and N) Confocal microscopy of DMXAA-activated BMDC from WT, Stinggt/gt, and Fcgr2b−/−. Stingwt/gt - mice for 6 h. (M) The quantification of colocalization signals between STING and Lyn (N = 5 per group). Data are shown as mean ± SEM; ∗p < 0.05, ∗∗p < 0.01, and ∗∗∗p < 0.001. (N) Immunofluorescence staining of BMDC shows Lyn (green), STING (red), and DAPI (blue) (scale bar, 20 μm). Data show a representative of five experiments.
Figure 7
Figure 7
Adoptive Transfer of Sting-Expressing BMDC Induces Lupus Development in the Fcgr2b−/−.Stinggt/gt Mice DMXAA-activated BMDC from Fcgr2b−/−.Stingwt/gt, WT, and Fcgr2b−/−.Stinggt/gt were transferred into the recipient mice (Fcgr2b−/−.Stinggt/gt). (A) The level of anti-dsDNA from the sera (1:100) measured by ELISA (N = 5–10 per group). The dollar sign ($) shows the comparison between the groups. (B–E) The relative RNA expressions (normalized by actin) of (B) Isg15, (C) Mx1, (D) Irf7, and (E) Irf3 in the kidney of the mice receiving BMDC are shown (N = 5–6 per group). (F–H) Flow cytometry analysis of recipient splenocytes after BMDC transferred every 2 weeks for four times shows the percentage of (F) Tem (CD4+CD44hiCD62Llo), (G) CD4+ICOS+ cells, (H) B220+GL7+ cells (N = 5–10 per group). (I–L) Immunofluorescence staining of the kidney from the Fcgr2b−/−.Stinggt/gt recipient mice after the transfer with (I) PBS control, DMXAA-activated BMDC from (J) Fcgr2b−/−.Stingwt/gt, (K) WT, and (L) Fcgr2b−/−.Stinggt/gt. The confocal microscope shows DAPI (blue), CD45 (red), and IgG (green). The representative of four experiments (scale bar, 10 μm). (M and N) The quantification of fluorescence intensity of (M) CD45, and (N) IgG staining. Data are shown as mean ± SEM; ∗p < 0.05, ∗∗p < 0.01, and ∗∗∗p < 0.001.

References

    1. Ahn J., Gutman D., Saijo S., Barber G.N. STING manifests self DNA-dependent inflammatory disease. Proc. Natl. Acad. Sci. U S A. 2012;109:19386–19391. - PMC - PubMed
    1. Ahn J., Ruiz P., Barber G.N. Intrinsic self-DNA triggers inflammatory disease dependent on STING. J. Immunol. 2014;193:4634–4642. - PMC - PubMed
    1. Aiba Y., Kameyama M., Yamazaki T., Tedder T.F., Kurosaki T. Regulation of B-cell development by BCAP and CD19 through their binding to phosphoinositide 3-kinase. Blood. 2008;111:1497. - PubMed
    1. An J., Durcan L., Karr R.M., Briggs T.A., Rice G.I., Teal T.H., Woodward J.J., Elkon K.B. Expression of cyclic GMP-AMP synthase in patients with systemic lupus erythematosus. Arthritis Rheum. 2017;69:800–807. - PubMed
    1. Asselin-Paturel C., Brizard G., Chemin K., Boonstra A., O'Garra A., Vicari A., Trinchieri G. Type I interferon dependence of plasmacytoid dendritic cell activation and migration. J. Exp. Med. 2005;201:1157–1167. - PMC - PubMed