. 2020 Sep 5;23(9):101536.
doi: 10.1016/j.isci.2020.101536. eCollection 2020 Sep 25.

A Glucose-Triptolide Conjugate Selectively Targets Cancer Cells under Hypoxia

Affiliations

A Glucose-Triptolide Conjugate Selectively Targets Cancer Cells under Hypoxia

Emmanuel Datan et al. iScience. .

Abstract

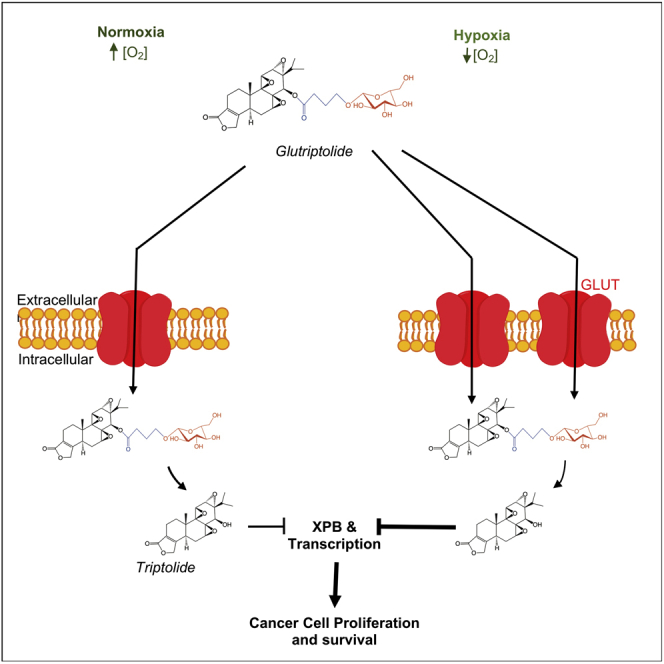
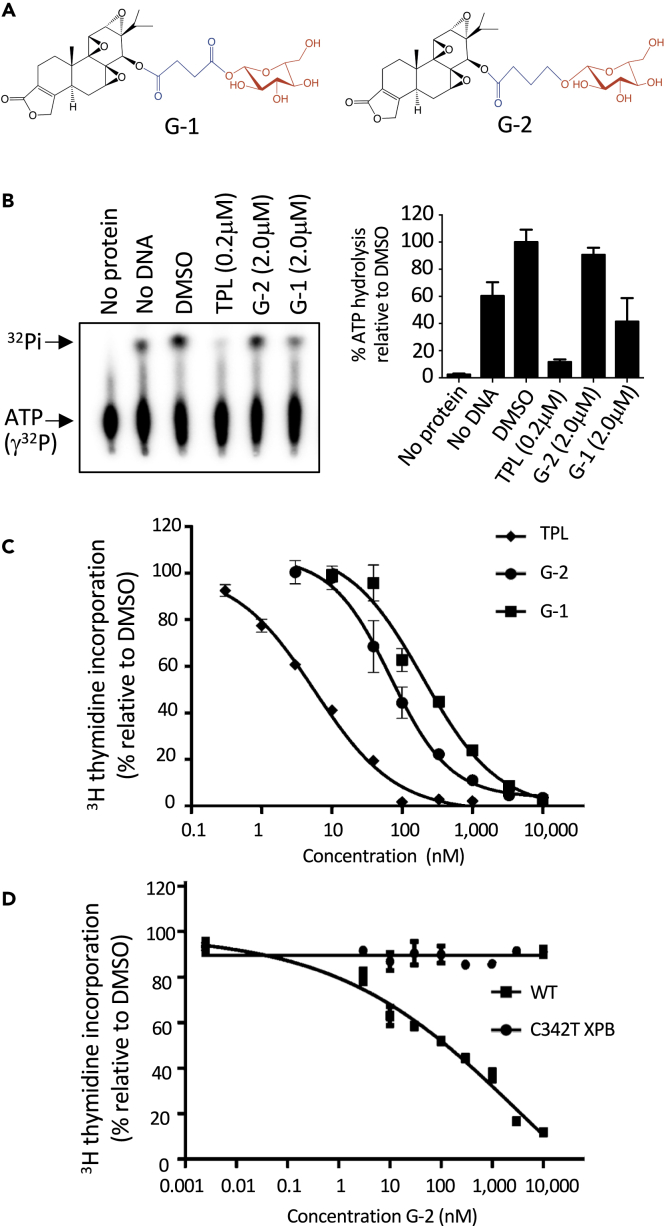
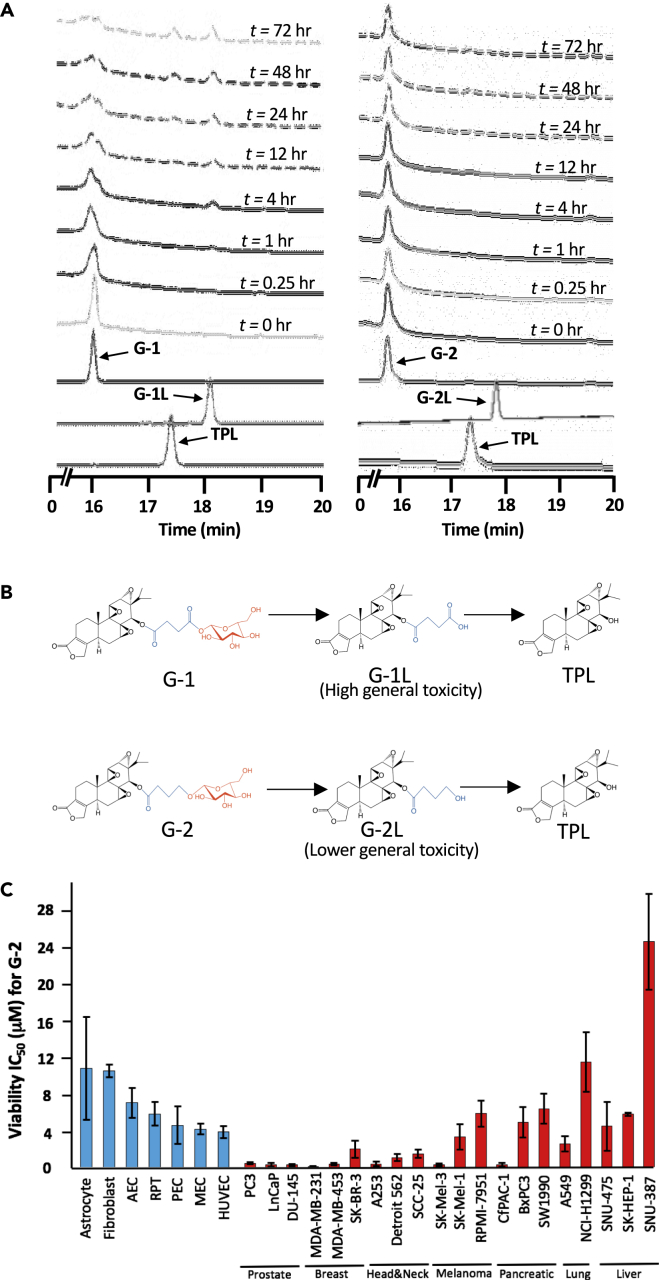
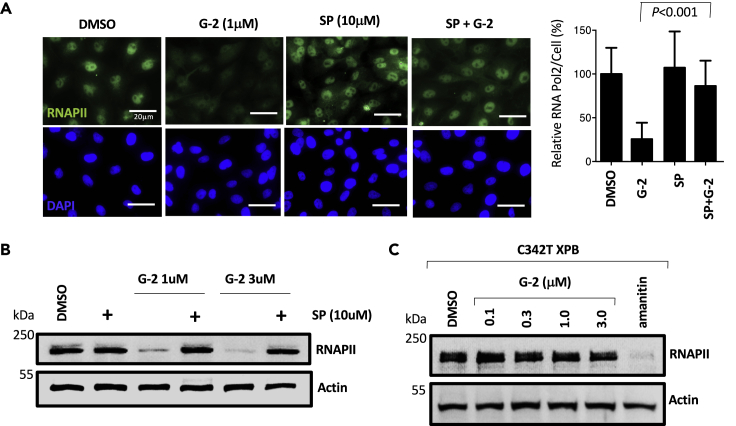
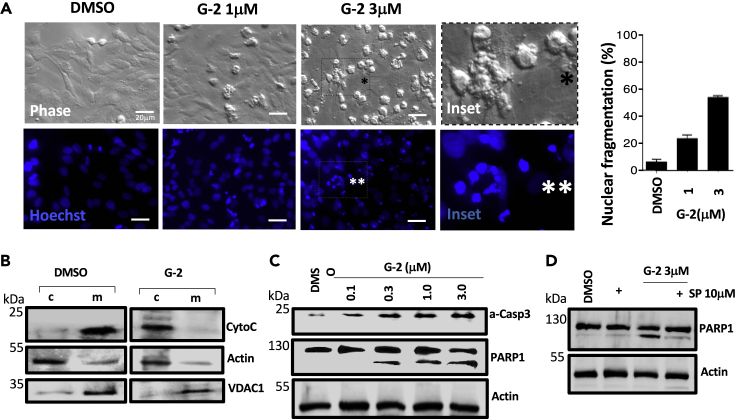
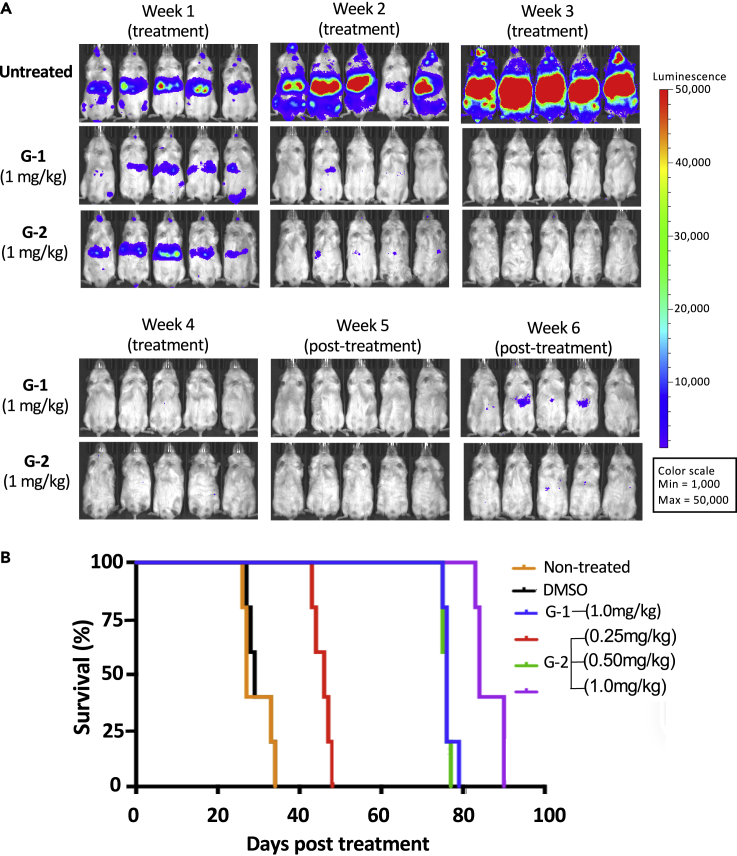
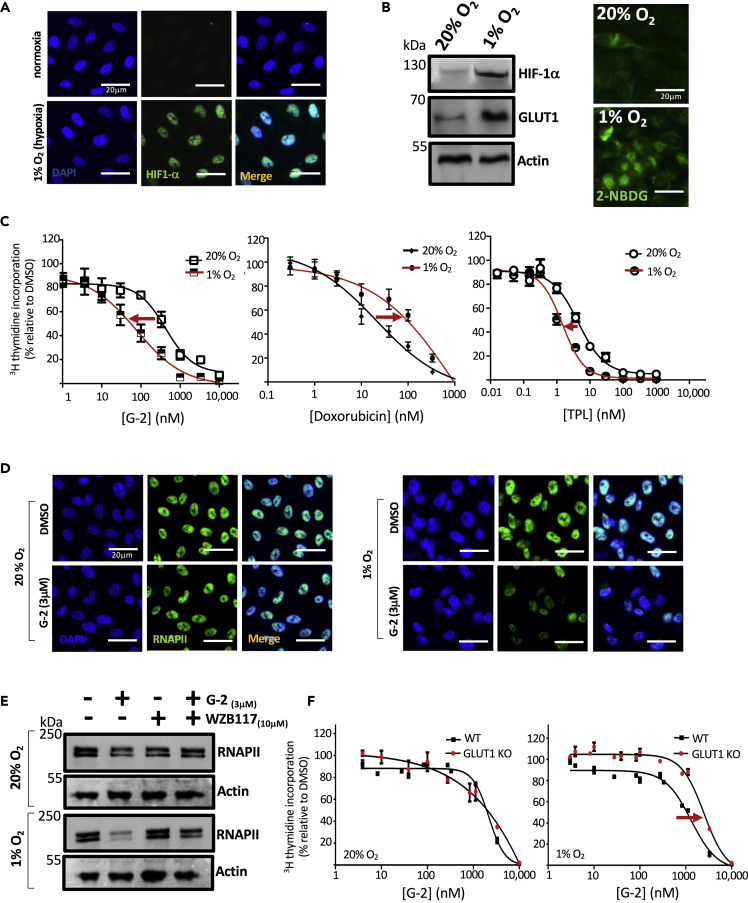
A major hurdle in the treatment of cancer is chemoresistance induced under hypoxia that is characteristic of tumor microenvironment. Triptolide, a potent inhibitor of eukaryotic transcription, possesses potent antitumor activity. However, its clinical potential has been limited by toxicity and water solubility. To address those limitations of triptolide, we designed and synthesized glucose-triptolide conjugates (glutriptolides) and demonstrated their antitumor activity in vitro and in vivo. Herein, we identified a lead, glutriptolide-2 with an altered linker structure. Glutriptolide-2 possessed improved stability in human serum, greater selectivity toward cancer over normal cells, and increased potency against cancer cells. Glutriptolide-2 exhibits sustained antitumor activity, prolonging survival in a prostate cancer metastasis animal model. Importantly, we found that glutriptolide-2 was more potent against cancer cells under hypoxia than normoxia. Together, this work provides an attractive glutriptolide drug lead and suggests a viable strategy to overcome chemoresistance through conjugation of cytotoxic agents to glucose.

Keywords: Cancer; Inorganic Chemistry; Medical Biochemistry; Medical Substance.


Conflict of interest statement

A patent covering glutriptolides has been licensed from Johns Hopkins to Rapafusyn Pharmaceuticals, of which J.O.L. is a cofounder and an equity owner. The potential conflict of interest is being managed by Johns Hopkins University. No potential conflicts of interest were disclosed by the other authors.

Figures

None
Graphical abstract
Figure 1
Figure 1
Glutriptolide-2 Is a Prodrug that Requires XPB Binding for Its Antiproliferative Effect (A) Chemical structures of glutriptolides 1 (G-1) and 2 (G-2). Structural motifs in glutriptolides are highlighted (black = triptolide, blue = linker, and red = glucose). (B) G-2 does not inhibit the ATPase activity of TFIIH in vitro, whereas triptolide (TPL) effectively suppresses activity at a 10-fold lower concentration. Data are represented as mean ± SE of released inorganic phosphate (32Pi) relative to DMSO (n = 3). (C) Treatment with G-2 (circle), G-1 (square), or TPL (diamond) inhibits cell proliferation after 24 h. (D) The knock-in cell line for XPB expressing only the C342T XPB mutant is resistant to G-2 (circle), whereas inhibition of proliferation is observed in the isogenic cell line expressing WT (square) XPB. Proliferation was measured by 3H thymidine incorporation and plotted using GraphPad prism. Data are represented as mean ± SEM relative to DMSO (n = 3).
Figure 2
Figure 2
Glutriptolide-2 Possesses Increased Stability in Human Serum and Lower General Toxicity toward Nonmalignant, Primary Cells Relative to G-1 (A) Hydrolysis of G-1 and G-2 at different incubation times in human serum as monitored by tandem HPLC-MS. Chromatograms were taken at A218. (B) Chemical structures of G-1 and G-2 with hydrolysis intermediates G-1L and G-2L that subsequently releases triptolide (TPL). Structural motifs in glutriptolides are highlighted (black = triptolide, blue = linker, and red = glucose). (C) Primary cell viability as measured by XTT assay exhibits reduced sensitivity to G-2 in comparison to multiple cancer cell lines. Liver, lung, melanoma, and pancreatic cancer cell lines respond poorly to G-2 treatment. HUVEC = Human Umbilical Vascular Endothelial Cell, MEC = Mammary Epithelial Cell, PEC = Prostate Epithelial Cell, RPT = Renal Proximal Tubule, AEC = Airway Epithelial Cell. Data are represented as mean ± SEM viability relative to DMSO (n = 3–7).
Figure 3
Figure 3
Glutriptolide-2-Induced RNA Polymerase 2 Degradation is XPB Dependent (A) Treatment with 1 μM G-2 for 24 h depletes endogenous RNA polymerase II (RNAPII), whereas 10 μM spironolactone (SP) or DMSO by themselves do not affect protein levels in fixed HeLa cells processed for immunocytochemical staining of RPB1 (catalytic subunit of RNAPII) and DAPI (nuclear marker). Pre-treatment of cells with 10 μM spironolactone significantly (P < 0.001) rescues endogenous RNAPII from G-2-induced degradation. Representative images of RPB1 and DAPI staining are shown with quantification of intracellular RPB1 and student's t test analysis. Data are represented as mean ± SE RPB1 levels relative to DMSO (n = 3). (B) Whole cell lysates of cells treated with G-2, SP, or in combination were subjected to western blot analysis of endogenous RNAPII using antibodies specific for RPB1 showing that G-2 induced RNAPII degradation at 1 or 3 μM is antagonized by 10 μM SP. (C) Whole cell lysates from isogenic knock-in cells expressing only C342T XPB show that degradation of the catalytic subunit of RNAPII by G-2 as measured by immunoblotting for RPB1 is inhibited in the absence of WT XPB. In contrast, the RPB1-interacting inhibitor α-amanitin induced the degradation of Rpb1 at 1μM in the C342T XPB isogenic cell line. Actin was used as a loading control. Scale bar, 20 μm.
Figure 4
Figure 4
Glutriptolide-2 Induces Apoptosis Signaling (A) Bright phase micrographs show minimal cytopathology with DMSO exposure in contrast to G-2 treatments especially with 3 μM G-2 where numerous cells round up and bleb (inset with black asterisk). Nuclear fragmentation, as detected by cytochemical analysis using Hoechst 33258 stain, in round up HeLa cells is dramatically increased by G-2 treatment (inset with two white asterisks) but not in DMSO. Data are represented as percentage of nuclear fragmented cells relative to total cells ±SE (n = 3). (B) Cytochrome c release during G-2 treatment was assessed by centrifugal separation of mitochondria followed by western blot analysis using cytochrome-c-specific antibody. Exposure of HeLa cells to 3 μM G-2 triggers the release of cytochrome c from the mitochondria (m) to the cytosol (c). Actin- and VDAC1-specific antibodies were used to ensure the efficiency of cytoplasm and mitochondria fractionation, respectively. (C) Western blot analysis of whole cell lysates for active caspase 3 (a-Casp3) and PARP1 during G-2 treatment shows a dose-dependent increase in caspase 3 activation. Pronounced PARP1 cleavage by active caspase 3 is also observed with increasing concentrations of G-2. (D) Degradation of XPB in cells by 10 μM sprironolactone dampens G-2-induced apoptosis signaling as indicated by reduced PARP1 cleavage in whole cell lysates subjected to western blot analysis. Actin was used as loading control. Scale bar, 20 μm.
Figure 5
Figure 5
Glutriptolide-2 Improves Survival in an In-Vivo Prostate Cancer Model (A) G-2 and G-1 have similar maximum tolerable dose (MTD) in a metastatic prostate cancer model. After confirmation of tumor growth in NOD/SCID/IL2rnull mice by bioluminescence imaging, daily administration of 1 mg/kg G-1 or G-2 for 30 days was tolerated by animals and able to suppress tumor growth throughout the treatment. Anti-tumor effect by G-1 or G-2 persists 2 weeks posttreatment. (B) Kaplan-Meier curves showing survival time (days after initiation of treatments [n = 5]) for controls, G-1, or G-2 treatments. Median survival times (days) are as follows: nontreated = 27, DMSO = 29, G-1 (1mg/kg) = 76, G-2 (0.25mg/kg) = 46, G-2 (0.5mg/kg) = 76, G-2 (1mg/kg) = 84.
Figure 6
Figure 6
Hypoxia Enhances Antiproliferative Effect of Glutriptolide-2 (A) Immunocytochemical analysis of fixed cells using antibodies specific to HIF-1α show that exposure to hypoxia (1% O2) for 24 h stabilizes endogenous HIF-1α compared with normoxia (20% O2) in PC3 cells. (B) Western blot analysis of whole cell lysates for endogenous HIF-1α shows an increase during hypoxia compared with normoxia, which also corresponds with an increase in glucose transporter 1 (GLUT1). (C) Hypoxia enhances the antiproliferative effect of G-2 at 48 h posttreatment as measured by 3H thymidine incorporation, whereas co-treatment with doxorubicin and hypoxia reduces drug potency. Triptolide (TPL) shows a modest antiproliferative effect. Data are represented as mean ± SE relative to DMSO (n = 3). (D) Immunocytochemistry using antibody specific to RPB1 shows that exposure of cells to hypoxia triggers an early onset of RNAPII subunit RPB1 degradation by 3 μM glutriptolide-2 after 6 h. (E) Whole cell lysates subjected to western blot using anti-RPB1-specific antibody shows that 10 μM glucose transporter 1 inhibitor WZB117 antagonizes the early onset of RNAPII degradation triggered by 3 μM G-2 and hypoxia. (F) DLD-1 WT cells exposed to hypoxia exhibited enhanced sensitivity to G-2 in comparison to DLD-1 GLUT1 knockout (GLUT1 KO) cells. No difference in sensitivity is observed between DLD-1 WT and GLUT1 KO under normoxia. Data are represented as mean ± SEM relative to DMSO (n = 3). Scale bar, 20 μm.

References

    1. Bensaude O. Inhibiting eukaryotic transcription: which compound to choose? How to evaluate its activity? Transcription. 2011;2:103–108. - PMC - PubMed
    1. Bhat M., Robichaud N., Hulea L., Sonenberg N., Pelletier J., Topisirovic I. Targeting the translation machinery in cancer. Nat. Rev. Drug Discov. 2015;14:261–278. - PubMed
    1. Chugh R., Sangwan V., Patil S.P., Dudeja V., Dawra R.K., Banerjee S., Schumacher R.J., Blazar B.R., Georg G.I., Vickers S.M. A preclinical evaluation of Minnelide as a therapeutic agent against pancreatic cancer. Sci. Transl. Med. 2012;4:156ra139. - PMC - PubMed
    1. Corson T.W., Cavga H., Aberle N., Crews C.M. Triptolide directly inhibits dCTP pyrophosphatase. Chembiochem. 2011;12:1767–1773. - PMC - PubMed
    1. Elinoff J.M., Chen L.Y., Dougherty E.J., Awad K.S., Wang S., Biancotto A., Siddiqui A.H., Weir N.A., Cai R., Sun J. Spironolactone-induced degradation of the TFIIH core complex XPB subunit suppresses NF-kappaB and AP-1 signalling. Cardiovasc. Res. 2018;114:65–76. - PMC - PubMed

LinkOut - more resources