[Preprint]. 2020 Oct 16:2020.10.15.340455.
doi: 10.1101/2020.10.15.340455.

Progressive and accurate assembly of multi-domain protein structures from cryo-EM density maps

Affiliations

Progressive and accurate assembly of multi-domain protein structures from cryo-EM density maps

Xiaogen Zhou et al. bioRxiv. .

Update in

Abstract

Progress in cryo-electron microscopy (cryo-EM) has provided the potential for large-size protein structure determination. However, the solution rate for multi-domain proteins remains low due to the difficulty in modeling inter-domain orientations. We developed DEMO-EM, an automatic method to assemble multi-domain structures from cryo-EM maps through a progressive structural refinement procedure combining rigid-body domain fitting and flexible assembly simulations with deep neural network inter-domain distance profiles. The method was tested on a large-scale benchmark set of proteins containing up to twelve continuous and discontinuous domains with medium-to-low-resolution density maps, where DEMO-EM produced models with correct inter-domain orientations (TM-score >0.5) for 98% of cases and significantly outperformed the state-of-the-art methods. DEMO-EM was applied to SARS-Cov-2 coronavirus genome and generated models with average TM-score/RMSD of 0.97/1.4Å to the deposited structures. These results demonstrated an efficient pipeline that enables automated and reliable large-scale multi-domain protein structure modeling with atomic-level accuracy from cryo-EM maps.


Conflict of interest statement

COMPETING FINANCIAL INTERESTS

The authors declare no competing financial interests.

Figures

Figure 1
Figure 1
Flowchart of DEMO-EM illustrated with a 3-domain protein from the iron-dependent regulator of mycobacterium tuberculosis (PDBID: 1fx7A). Starting from the query sequence, domain boundaries and models of each domain are first predicted by FUpred and I-TASSER, respectively. Meanwhile, inter-domain distances are predicted with a deep convolutional neural-network predictor DomainDist. Second, each of the domain models is independently fit into the density map by quasi-Newton searching. Third, the initial full-length models are optimized by a two-step rigid-body REMC simulation to minimize the DCS between the density map and full-length model (Eq. 1). Fourth, the lowest DCS model selected from the rigid-body assembly simulations undergoes flexible assembly with atom-, segment-, and domain-level refinements using REMC simulation guided by the DCS and inter-domain distance profiles coupled with a knowledge-based force field, with the resulting decoy conformations clustered by SPICKER to obtain a centroid model. Finally, the flexible assembly simulation is performed again for the full-atomic model with constraints from centroid models adding to the energy, and the final model is created from the lowest energy model after side-chain repacking with FASPR and FG-MD.
Figure 2.
Figure 2.
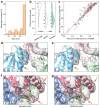
Summary of full-length structural models constructed by different approaches on 357 multi-domain proteins using synthesized density maps. (a) Mean and distribution of TM-score for models by DEMO-EM, MDFF and Rosetta, respectively. (b) Boxplot and distribution for RMSD of models by DEMO-EM, MDFF, and Rosetta, respectively. (c) Head-to-head comparison between TM-score of initial models by domain matching and that of final models after rigid-body assembly, flexible assembly and refinement. (d) Comparison between TM-score of individual domain models by I-TASSER and that in final full-length models by DEMO-EM.
Figure 3
Figure 3
Representative examples showing the process of DEMO-EM. Density maps are shown in gray shadow where cartoons are DEMO-EM models with different colors indicating different domains. (a) 2e1qC, a protein with 10 domains (8 continuous domains and 2 discontinuous domains) using a simulated density map with a resolution of 5.3 Å. (b) 1q25A, a protein with 3 domains using a simulated density map with a resolution of 9.9Å.
Figure 4.
Figure 4.
Summary of structures constructed by different approaches using experimental density map. (a) Distribution of NDO score of domain boundaries predicted by FUpred. (b) TM-score of full-length models constructed by DEMO-EM, MDFF, and Rosetta. (c) Head-to-head TM-score comparison of the initial individual models by I-TASSER and that in final full-length models by DEMO-EM. (d, e) The deposited model in PDB (PDBID: 6eny) (d) and reconstructed model (e) by DEMO-EM for human PLC editing module, where different color represents different domains. (f, g) The deposited model in PDB (PDBID: 5fj6) (f) and reproduced model (g) by DEMO-EM for the P2 polymerase inside in vitro assembled bacteriophage phi6 polymerase complex.
Figure 5.
Figure 5.
Overlay of structural models by DEMO-EM on the cryo-EM density maps for the six proteins in SARS-CoV-2 genome. (a) Spike protein (density map from EMD-21375). (b) NSP8 (EMD-11007). (c) Helicase/NSP13 (EMD-22160). (d) ORF3a (EMD-22136). (e) NSP7 (EMD-11007). (f) RNA-directed RNA polymerase/NSP12 (EMD-11007). (g) Comparison of the Spike RBD domain by DEMO-EM (cyan) with the X-ray structure (red, PDB 7bz5A).

Similar articles

References

    1. Cheng Y. Single-Particle Cryo-EM at Crystallographic Resolution. Cell 161, 450–457 (2015). - PMC - PubMed
    1. Kuhlbrandt W. The Resolution Revolution. Science 343, 1443–1444 (2014). - PubMed
    1. Cowtan K. The Buccaneer software for automated model building. 1. Tracing protein chains. Acta Crystallographica Section D: Biological Crystallography 62, 1002–1011 (2006). - PubMed
    1. Emsley P., Lohkamp B., Scott W.G. & Cowtan K. Features and development of Coot. Acta Crystallographica Section D: Biological Crystallography 66, 486–501 (2010). - PMC - PubMed
    1. Terwilliger T.C. et al. Iterative model building, structure refinement and density modification with the PHENIX AutoBuild wizard. Acta Crystallographica Section D: Biological Crystallography 64, 61–69 (2008). - PMC - PubMed

Publication types