. 2021 Jan;166(1):101-113.
doi: 10.1007/s00705-020-04845-7. Epub 2020 Oct 20.

Coronavirus: proteomics analysis of chicken kidney tissue infected with variant 2 (IS-1494)-like avian infectious bronchitis virus

Affiliations

Coronavirus: proteomics analysis of chicken kidney tissue infected with variant 2 (IS-1494)-like avian infectious bronchitis virus

Hamed Abdollahi et al. Arch Virol. 2021 Jan.

Abstract

Avian infectious bronchitis virus is one of the most important gammacoronaviruses, which causes a highly contagious disease. In this study, we investigated changes in the proteome of kidney tissue of specific-pathogen-free (SPF) chickens that were infected with an isolate of the nephrotropic variant 2 genotype (IS/1494/06) of avian coronavirus. Twenty 1-day-old SPF White Leghorn chickens were randomly divided into two groups, each comprising 10 chickens, which were kept in separate positive-pressure isolators. Chickens in group A served as a virus-free control group up to the end of the experiment, whereas chickens in group B were inoculated with 0.1 ml of 104.5 EID50 of the IBV/chicken/Iran/UTIVO-C/2014 isolate of IBV, and kidney tissue samples were collected at 2 and 7 days post-inoculation (dpi) from both groups. Sequencing of five protein spots at 2 dpi and 22 spots at 7 dpi that showed differential expression by two-dimensional electrophoresis (2DE) along with fold change greater than 2 was done by MS-MALDI/TOF/TOF. Furthermore, the corresponding protein-protein interaction (PPI) networks at 2 and 7 dpi were identified to develop a detailed understanding of the mechanism of molecular pathogenesis. Topological graph analysis of this undirected PPI network revealed the effect of 10 genes in the 2 dpi PPI network and nine genes in the 7 dpi PPI network during virus pathogenesis. Proteins that were found by 2DE analysis and MS/TOF-TOF mass spectrometry to be down- or upregulated were subjected to PPI network analysis to identify interactions with other cellular components. The results show that cellular metabolism was altered due to viral infection. Additionally, multifunctional heat shock proteins with a significant role in host cell survival may be employed circuitously by the virus to reach its target. The data from this study suggest that the process of pathogenesis that occurs during avian coronavirus infection involves the regulation of vital cellular processes and the gradual disruption of critical cellular functions.


Figures
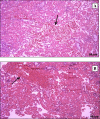
Fig. 1
Fig. 1
Haematoxylin and eosin (H&E) staining of 2 dpi (A) and 7 dpi (B) samples. Microscopic changes were observed in kidney tissue samples of the IS/1494/06-infected group of SPF chickens, including (A) mild hyperemia and (B) multifocal infiltration of heterophils along with hyperemia in the interstitial tissue
Fig. 2
Fig. 2
Detection of IS/1494/06 in kidney tissue samples and determination of the viral load by real-time RT-PCR of a conserved sequence of the IBV genome. The control group remained uninfected up to the end of the experiment, and the infection of challenge group was confirmed by real-time RT-PCR. formula image , 2 dpi control group; formula image , 2 dpi infected group; formula image , 7 dpi control group; formula image , 7 dpi infected group; formula image , negative RT-PCR standard; formula image , standard 104; formula image , standard 105; formula image , standard 106; formula image , standard 107; formula image , standard 108; formula image , positive RT-PCR standard
Fig. 3
Fig. 3
Standard curve of viral load determined by real-time RT-PCR. As expected, the viral load increased from 2 to 7 dpi, showing the normal progression of virus propagation
Fig. 4
Fig. 4
Aligned 2DE images of extracted proteins from the control and infected groups at 2 dpi using Progenesis Same-Spots software to detect differentially expressed proteins. Extracted proteins loaded on 7-cm IPG strips (pI 3-10) for the first dimension, and afterwards, SDS-PAGE was carried out as the second dimension. Proteins were stained using the anionic dye Coomassie blue R-350. Protein spots that showed a fold change > 2 were selected
Fig. 5
Fig. 5
Aligned 2DE images of extracted proteins from the control and infected groups at 7 dpi using Progenesis Same-Spots software to detect differentially expressed proteins
Fig. 6
Fig. 6
Biological processes of 2 dpi samples. Semantic similarity-based scatter-plot of differentially expressed protein spots from kidney samples at 2 dpi. The allowed similarity was adjusted to 0.7, and simRel was selected as the similarity measure. Size indicates the frequency of the GO term in the underlying GOA database (bubbles of more general terms are larger)
Fig. 7
Fig. 7
Molecular functions of 2 dpi samples. Semantic similarity-based scatter-plot of differentially expressed protein spots from kidney samples at 2 dpi based on their functional annotations. The allowed similarity was adjusted to 0.7, and simRel was selected as the similarity measure. Size indicates the frequency of the GO term in the underlying GOA database (bubbles of more general terms are larger)
Fig. 8
Fig. 8
Interaction network of differentially expressed proteins at 2 dpi (high confidence < 0.7). The size of the circle shows the importance of the node in relation to its neighbors. Table 2 shows the centralities of important nodes. This is an undirected graph. Differences in the color of circles show that the proteins belong to different components of the graph
Fig. 9
Fig. 9
Interaction network of differentially expressed proteins at 7 dpi (high confidence < 0.7). The size of the circle shows the importance of the node in relation to its neighbors. Table 3 shows the centralities of important nodes. This is an undirected graph. Differences in the color of circles show that the proteins belong to different components of the graph
Fig. 10
Fig. 10
Real-time qPCR analysis of eight selected genes in the IBV-inoculated and control groups. Fold change values were calculated using the 2-ΔΔCT method with 28S rRNA as a reference gene. Error bars represent the standard error of three independent repeats

Similar articles

Cited by

References

    1. Schalk AF, Hawn MC. An apparently new respiratory disease of baby chicks. J Am Vet Med Assoc. 1931;78(19):413–422.
    1. Jackwood MW. Review of infectious bronchitis virus around the world invited review—review of infectious bronchitis virus around the world. Avian Dis. 2012;56(4):634–641. - PubMed
    1. de Wit JJS, Cook JKA, van der Heijden HMJF. Infectious bronchitis virus variants: a review of the history, current situation and control measures. Avian Pathol. 2011;40(3):223–235. doi: 10.1080/03079457.2011.566260. - DOI - PMC - PubMed
    1. Ramage HR, et al. A combined proteomics/genomics approach links hepatitis C virus infection with nonsense-mediated mRNA decay. Mol Cell. 2015;57(2):329–340. - PMC - PubMed
    1. Matheson NJ, et al. Cell surface proteomic map of HIV infection reveals antagonism of amino acid metabolism by Vpu and Nef. Cell Host Microbe. 2015;18(4):409–423. - PMC - PubMed

MeSH terms

LinkOut - more resources