. 2020 Oct;25(10):106003.
doi: 10.1117/1.JBO.25.10.106003.

Feasibility of combined optical coherence tomography and autofluorescence imaging for visualization of needle biopsy placement

Affiliations

Feasibility of combined optical coherence tomography and autofluorescence imaging for visualization of needle biopsy placement

Geoffrey Hohert et al. J Biomed Opt. 2020 Oct.

Abstract

Significance: Diagnosis of suspicious lung nodules requires precise collection of relevant biopsies for histopathological analysis. Using optical coherence tomography and autofluorescence imaging (OCT-AFI) to improve diagnostic yield in parts of the lung inaccessible to larger imaging methods may allow for reducing complications related to the alternative of computed tomography-guided biopsy.

Aim: Feasibility of OCT-AFI combined with a commercially available lung biopsy needle was demonstrated for visualization of needle puncture sites in airways with diameters as small as 1.9 mm.

Approach: A miniaturized OCT-AFI imaging stylet was developed to be inserted through an 18G biopsy needle. We present design considerations and procedure development for image-guided biopsy. Ex vivo and in vivo porcine studies were performed to demonstrate the feasibility of the procedure and the device.

Results: OCT-AFI scans were obtained ex vivo and in vivo. Discrimination of pullback site is clear.

Conclusions: Use of the device is shown to be feasible in vivo. Images obtained show the stylet is effective at providing structural information at the puncture site that can be used to assess the diagnostic potential of the sample prior to collection.

Keywords: animal study; autofluorescence; biopsy; lung imaging; optical coherence tomography.


Figures

Fig. 1
Fig. 1
Distal end of the imaging stylet. (a) Schematic showing the OCT and excitation light path in red. (b) Imaging stylet loaded in the biopsy needle and retracted slightly for puncture and (c) stylet extended for imaging.
Fig. 2
Fig. 2
The proximal handle of the Bronchus FleXNeedle, with attached T-junction for vacuum suction, and releasable luer seal around the imaging stylet.
Fig. 3
Fig. 3
Videobronchscope images of the needle being (a) maneuvered into view; (b) advanced out of the tubing by 1 cm; and (c) used to puncture the airway wall.
Fig. 4
Fig. 4
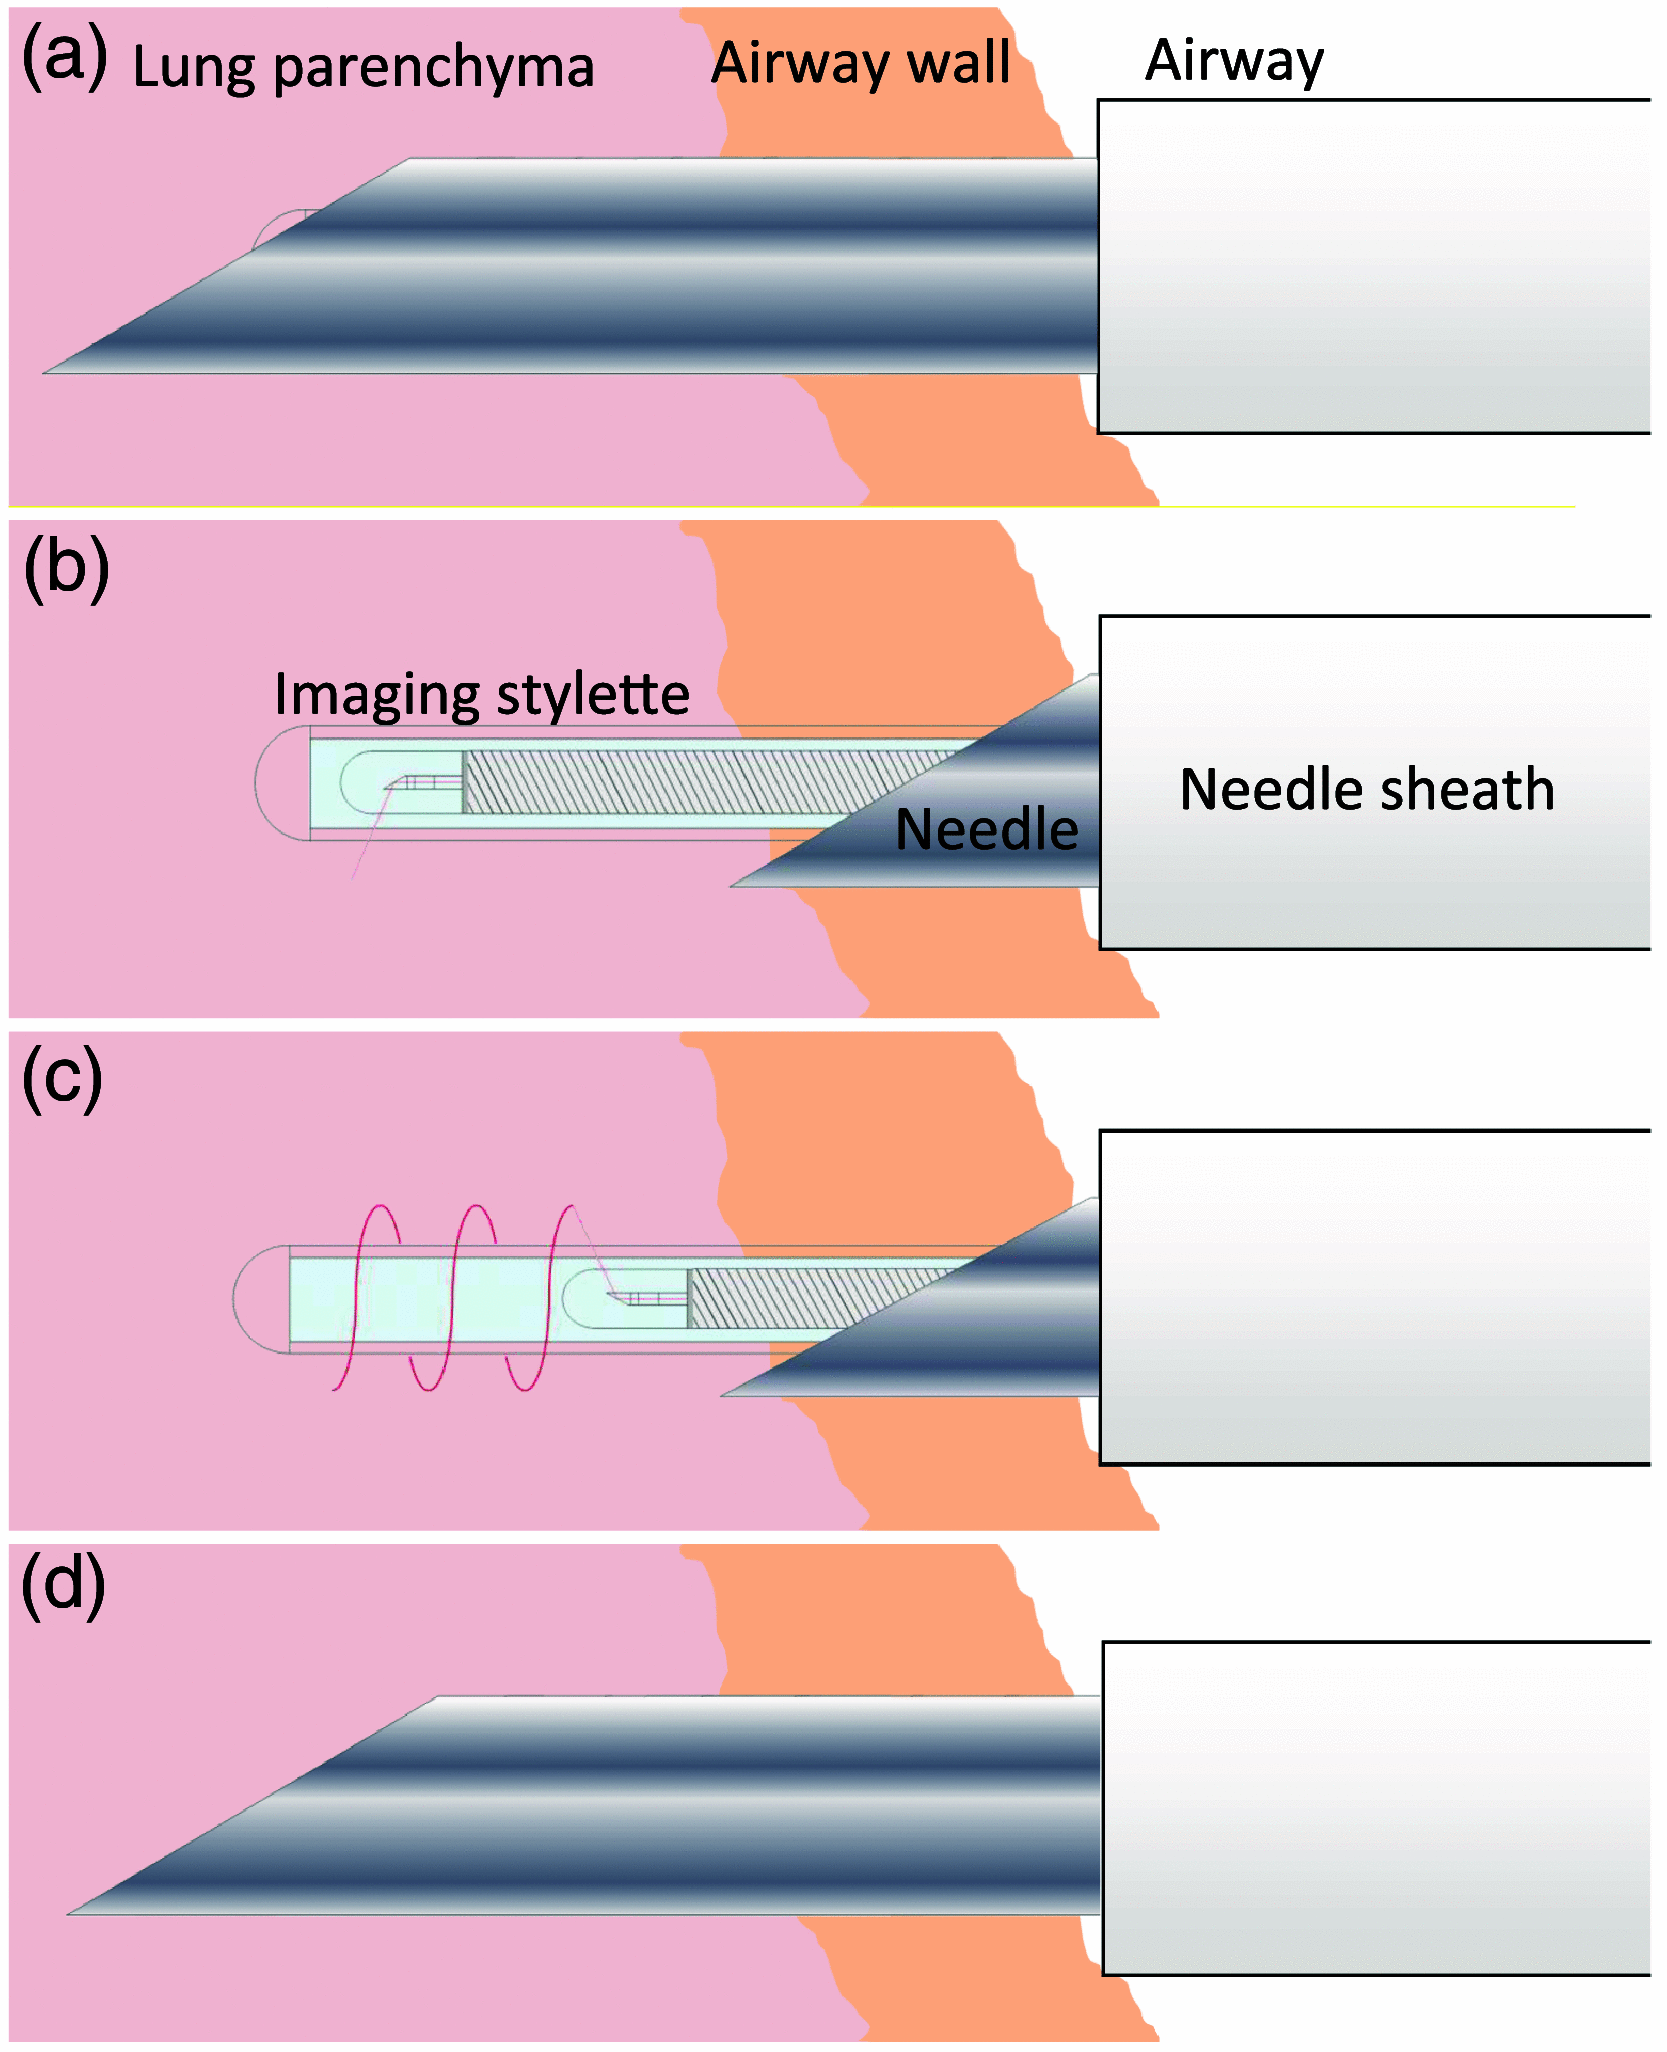
Puncture and pullback procedure. The needle and imaging stylet puncture the tissue together (a) before the needle is retracted by 10 mm while the stylet is held in place (b). The stylet is then used to capture a helical scan of the punctured tissue (c) and the needle is then re-advanced over the stylet into the tissue being scanned (d), at which point the stylet can be withdrawn from the needle for TBNA.
Fig. 5
Fig. 5
Pre and post-flush histograms of the OCT signal. Histograms were calculated from pixels in the red boxes, with the mean intensity shown at each site, and standard deviation in parentheses. There was <5 gray level difference between the mean OCT signal at site 1 and <2 gray level difference at site 2, indicating minimal improvement in penetration and contrast.
Fig. 6
Fig. 6
Example transbronchial pullback from an airway in the cranial right lobe showing a blood vessel, with the distal end of the scan on the left: (a) en-face AF projection; (b) OCT azimuthal pullback showing depth into tissue at the angle marked by the horizontal dashed line in (a); and four cross-sections (c)–(f) taken at the positions marked with vertical dashed lines. A vessel is visible in the AF projection, and in cross section in (b) and (e), marked with *. The needle outer tube is also visible at the proximal end of the scan, indicated with an arrow. The horizontal band with intense vertical streaks at the bottom of the AFI image is an artifact.
Fig. 7
Fig. 7
Cross-section comparison of OCT features observed in transbronchial and endobronchial imaging: (a) transbronchial distal scanning shows alveoli in most directions, and only a thin membrane separating the probe from alveoli; (b) transbronchial proximal scanning still shows some alveoli, but also the more solid tissue of airway wall in the upper right; (c) endobronchial distal scanning shows some alveoli, but separated from the probe by airway wall or supportive tissue; and (d) endobronchial proximal scan showing an airway much larger than the probe, with CRs concentric with the airway. CR: cartilage band.
Fig. 8
Fig. 8
Transbronchial pullback through an artificial lesion: (a) enface AFI and (b) OCT azimuthal pullback showing depth into tissue at the angle marked by the horizontal dashed line in (a). The distal (left) half of the pullback is in normal tissue, followed by the bright positive-fluorescence artificial lesion, and finally the needle (indicated with arrows in both views).

References

    1. de Koning H. J., et al. , “Reduced lung-cancer mortality with volume CT screening in a randomized trial,” N. Engl. J. Med. 382(6), 503–513 (2020).NEJMBH10.1056/NEJMoa1911793 - DOI - PubMed
    1. National Lung Screening Trial Research Team. et al. , “Reduced lung-cancer mortality with low-dose computed tomographic screening,” N. Engl. J. Med. 365(5), 395–409 (2011).NEJMBH10.1056/NEJMoa1102873 - DOI - PMC - PubMed
    1. Siegel R. L., Miller K. D., Jemal A., “Cancer statistics, 2017,” CA: Cancer J. Clin. 67(1), 7–30 (2017).10.3322/caac.21387 - DOI - PubMed
    1. McGuire A. L., et al. , “The diagnostic accuracy and sensitivity for malignancy of radial-endobronchial ultrasound and electromagnetic navigation bronchoscopy for sampling of peripheral pulmonary lesions: systematic review and meta-analysis,” J. Bronchol. Interv. Pulmonol. 27, 106–121 (2020).10.1097/LBR.0000000000000645 - DOI - PubMed
    1. Yamauchi Y., et al. , “Diagnostic performance of percutaneous core-needle lung biopsy under CT scan fluoroscopic guidance for pulmonary lesions measuring 10 mm,” Chest 140(6), 1669 (2011).CHETBF10.1378/chest.11-1821 - DOI - PubMed

Publication types