. 2020 Nov 10;16(11):6938-6949.
doi: 10.1021/acs.jctc.0c00744. Epub 2020 Oct 21.

A GPU-Accelerated Fast Multipole Method for GROMACS: Performance and Accuracy

Affiliations

A GPU-Accelerated Fast Multipole Method for GROMACS: Performance and Accuracy

Bartosz Kohnke et al. J Chem Theory Comput. .

Abstract

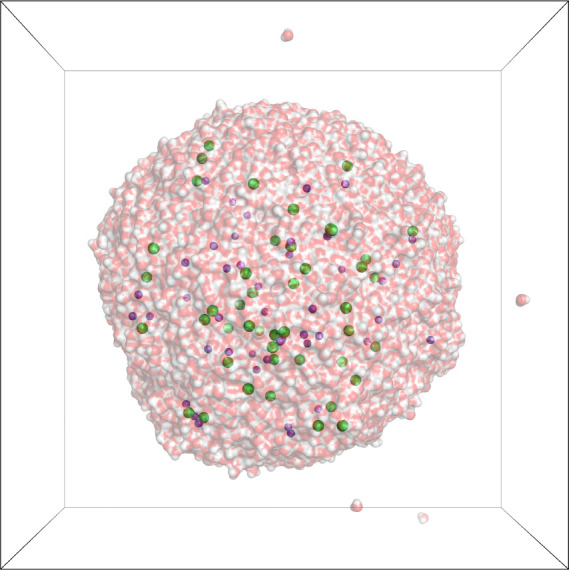
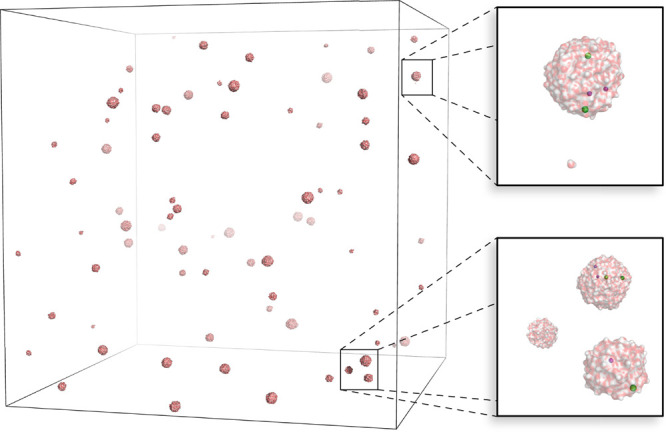
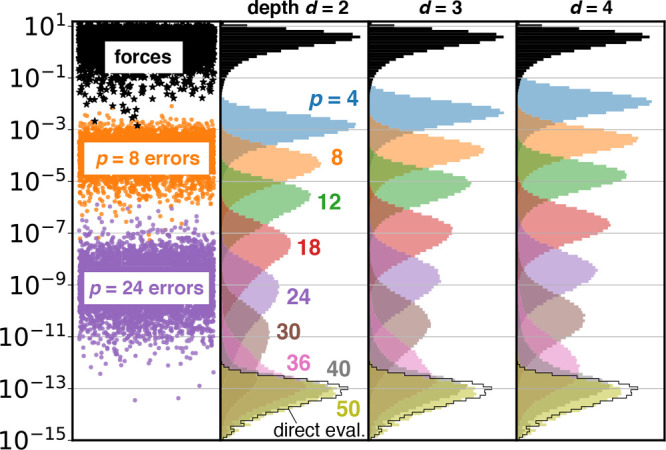
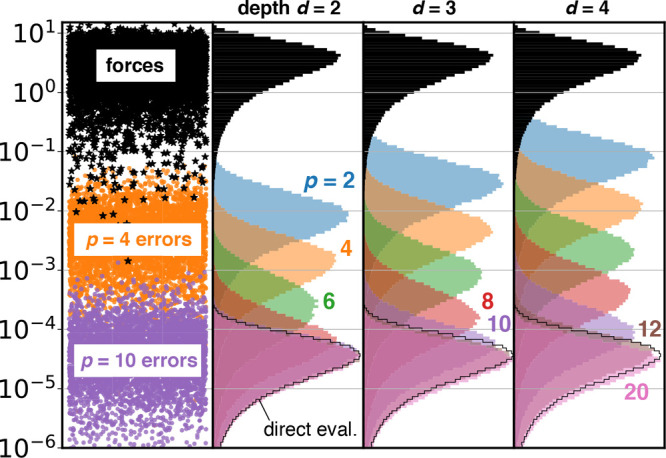
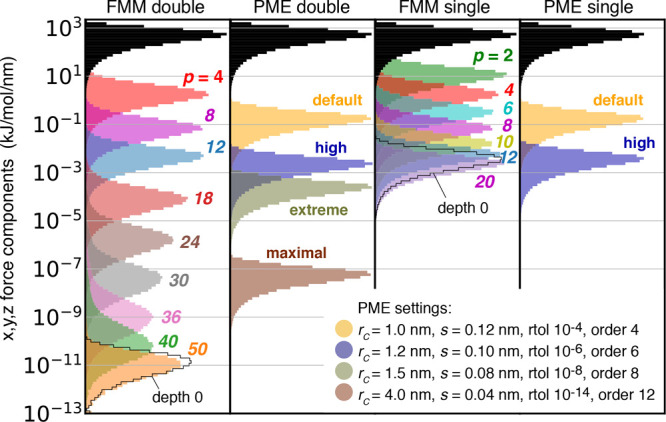
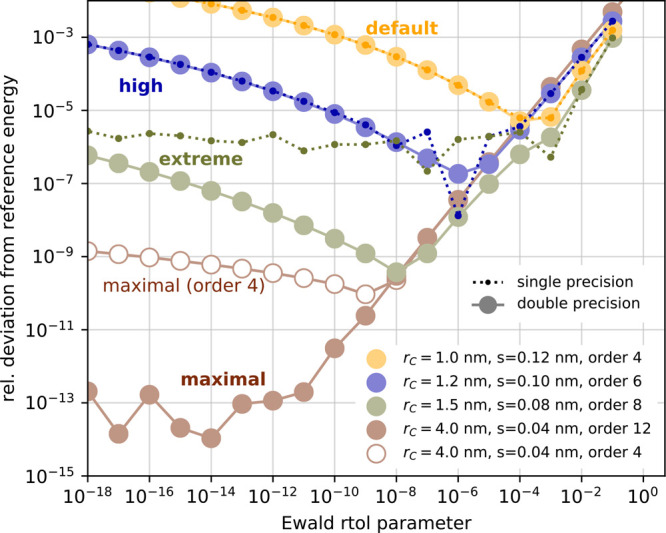
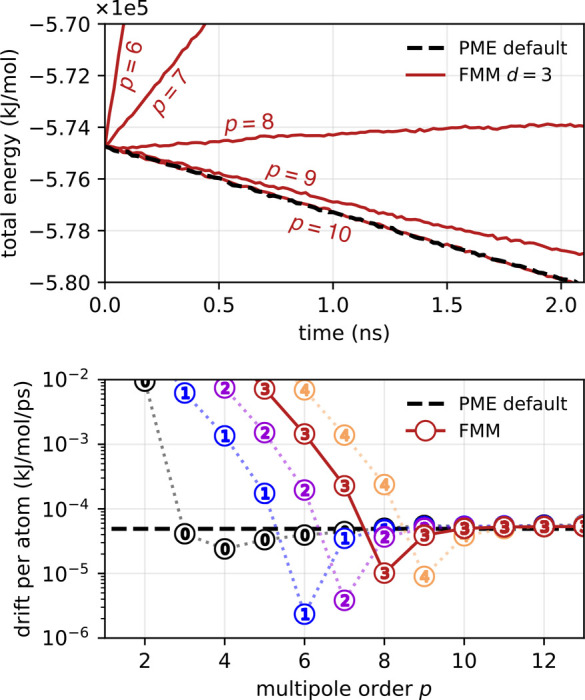
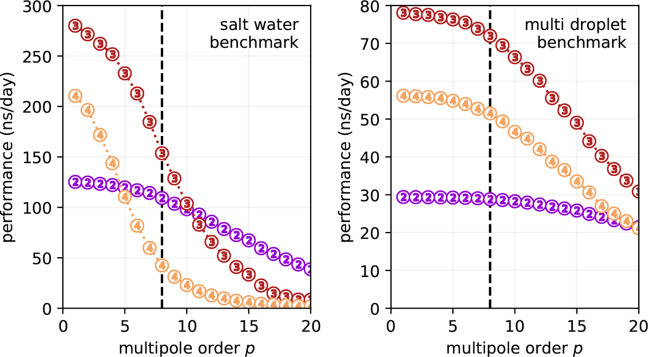
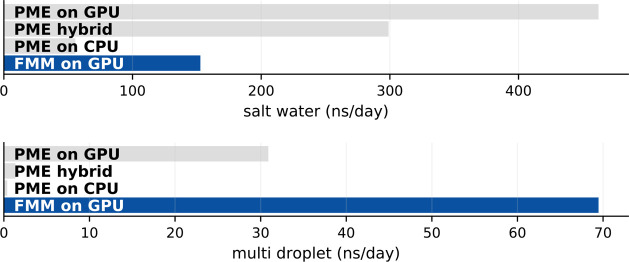
An important and computationally demanding part of molecular dynamics simulations is the calculation of long-range electrostatic interactions. Today, the prevalent method to compute these interactions is particle mesh Ewald (PME). The PME implementation in the GROMACS molecular dynamics package is extremely fast on individual GPU nodes. However, for large scale multinode parallel simulations, PME becomes the main scaling bottleneck as it requires all-to-all communication between the nodes; as a consequence, the number of exchanged messages scales quadratically with the number of involved nodes in that communication step. To enable efficient and scalable biomolecular simulations on future exascale supercomputers, clearly a method with a better scaling property is required. The fast multipole method (FMM) is such a method. As a first step on the path to exascale, we have implemented a performance-optimized, highly efficient GPU FMM and integrated it into GROMACS as an alternative to PME. For a fair performance comparison between FMM and PME, we first assessed the accuracies of the methods for various sets of input parameters. With parameters yielding similar accuracies for both methods, we determined the performance of GROMACS with FMM and compared it to PME for exemplary benchmark systems. We found that FMM with a multipole order of 8 yields electrostatic forces that are as accurate as PME with standard parameters. Further, for typical mixed-precision simulation settings, FMM does not lead to an increased energy drift with multipole orders of 8 or larger. Whereas an ≈50 000 atom simulation system with our FMM reaches only about a third of the performance with PME, for systems with large dimensions and inhomogeneous particle distribution, e.g., aerosol systems with water droplets floating in a vacuum, FMM substantially outperforms PME already on a single node.


Conflict of interest statement

The authors declare no competing financial interest.

Figures

Figure 1
Figure 1
Salt water droplet test system. Water molecules are shown in surface representation (oxygens, red; hydrogens, white), with Na+ ions in magenta, Cl ions in green, simulation box in black.
Figure 2
Figure 2
Aerosol/multidroplet system. Water surface representation as in Figure 1; close-ups to the right show individual droplets with Na+ ions in magenta and Cl ions in green.
Figure 3
Figure 3
FMM errors for the 50 675 atom salt water droplet (Figure 1) using double precision. (left) Absolute values of individual force components (black stars, index on x-axis), and deviations from reference values for exemplary cases p = 8 (orange dots) and p = 24 (purple dots). Colored histograms show distributions of absolute errors in the forces for multipole approximations p = 4–50 and tree depths d = 2, 3, and 4. For comparison, black histograms show distributions of actual forces (in absolute values). The black outline near the bottom shows the error for directly evaluating all interactions. Note that the black force histograms were scaled by 0.75 to fit in the panels.
Figure 4
Figure 4
FMM errors for 50 675 atom salt water droplet (Figure 1). Same as Figure 3, but for single-precision FMM.
Figure 5
Figure 5
Relative L2rel error norm (eq 3) of the total electrostatic energy (solid lines with circles) and of the potentials at the atomic positions (dashed lines with stars) for the salt water droplet with open boundaries (double precision).
Figure 6
Figure 6
Relative L2rel error norm (eq 3) of the total electrostatic energy (solid lines with circles) and of the potentials at the atomic positions (dashed lines with stars) for the salt water droplet with open boundaries (single precision).
Figure 7
Figure 7
FMM energy error for the ideal crystal (double precision). Circles show the relative deviation of the energy computed with FMM from its correct value as a function of multipole order p and tree depth d.
Figure 8
Figure 8
PME energy error for the ideal crystal (double precision). Circles show the relative deviation of the energy computed with PME from its correct value as a function of the ewald-rtol parameter for interpolation order 12 for four parameter sets (see legend, rc = real-space cutoff, s = PME grid spacing) For comparison, the corresponding FMM errors for p ≥ 40 are indicated by the shaded region (compare Figure 7).
Figure 9
Figure 9
Accuracy of FMM and PME Coulomb forces for a snapshot of the 50 675 atom periodic salt water system for double precision (left two panels) and single precision (right two panels). Black histograms show distributions of actual forces (in absolute values). For FMM, colored histograms show distributions of absolute errors in forces for multipole approximations p = 2–50 at d = 3. For PME, values for four representative parameter sets are shown color coded (see legend). Note that the black force histograms were multiplied by 0.9 to fit in the panels. The black outline in the FMM panels shows the error for a direct evaluation of all interactions that are in the simulation box (d = 0) combined with a p = 50 (for double precision, p = 20 for single) multipole approximation for the surrounding periodic images.
Figure 10
Figure 10
Coulomb energy error for various PME parameters, as in Figure 8but for a snapshot of the salt water system for double precision (solid lines with large circles) and single precision (dotted lines with darker small circles). For each combination of rc, s, and PME order, there is one value of the ewald-rtol parameter that minimizes the PME error. The reference energy was determined using a double-precision FMM calculation with p = 50 at d = 0. As almost all energy errors are ≥10–6 for single precision, they were omitted from the graph for the “maximal” parameter set (brown).
Figure 11
Figure 11
Chosen strict octree subdivision requires the simulation box to be approximately cubic; otherwise the convergence criterion is not fulfilled. (A) Exactly cubic box; (B) slightly noncubic box; (C) extremely noncubic box. A source particle xi and a target particle xj are positioned in a way that maximizes the ∥xi∥/∥xj∥ ratio reflecting the worst-case scenario.
Figure 12
Figure 12
Drift of total energy at typical mixed-precision settings for the periodic salt water system. Dashed black lines show the total (in this case negative) energy drift with PME (Δt = 4 fs, “default” PME parameters as given in Figure 9, default Verlet buffer tolerance of 0.005 kJ/mol/ps). (top) Evolution of total energy with FMM at depth 3 (red) compared to PME (black). (bottom) Absolute drift of total energy derived from a linear fit. At depth d = 3 (encircled numbers), which results in optimal FMM performance for this system, for p ≥ 8, the positive drift component from the FMM does not lead to an increased total drift.
Figure 13
Figure 13
GROMACS performance with FMM electrostatics for the 50 675 atom periodic salt water system (left) and for the 108 663 atom aerosol/multidroplet benchmark (right). Encircled numbers indicate FMM tree depth. With p = 8 as indicated by the dashed vertical line, FMM offers an accuracy of the electrostatic interactions that is comparable to the “default” PME parameter set (i.e., rc = 1.0 nm, PME grid spacing s = 0.12 nm, fourth order interpolation, see Figure 9). Benchmarks were run with 20 OpenMP threads on the CPU.
Figure 14
Figure 14
FMM versus PME performance in GROMACS for salt water (top) and multidroplet (bottom) benchmarks. Settings were chosen such that PME and FMM yield similar accuracies of electrostatic forces as well as comparable energy drifts. FMM used p = 8 and d = 3, whereas PME used the “default” parameter set (rc = 1.0 nm, PME grid spacing s = 0.12 nm, fourth order interpolation, see Figure 9). For the multidroplet system, for optimal PME performance, both rc and s were scaled by a factor of 2.943, which leaves the PME accuracy essentially unchanged.
Figure 15
Figure 15
FMM and PME scaling with respect to system size N for up to 268 million charges. Benchmarks were run on an NVIDIA Tesla V100 GPU with 32 GB RAM (solid lines) and on an RTX 2080Ti GPU (dashed lines). Blue (single precision) and orange (double precision) colors denote FMM standalone timings for the random charge benchmark (left scale) with depths d = 1–6 (encircled numbers) and multipole order p = 8, whereas the lower and upper boundaries of the shaded regions indicate timings for p = 7 and p = 9. Gray and dark blue lines show wall clock time per MD step (left scale) and resulting GROMACS performance (right scale) for PME (gray stars) and FMM (blue circles) for water boxes of different sizes. GROMACS benchmarks were run on a 10-core E5-2630v4 node with RTX 2080Ti GPU (dashed lines) and on a 20-core Xeon Gold 6148F with V100 GPU (solid lines) with all nonbonded interactions offloaded to the GPU.
Figure 16
Figure 16
Performance of our FMM (blue) compared to the GemsFMM implementation (red). Shown are the average runtimes for a single complete FMM evaluation (far field plus near field) at p = 8 on an NVIDIA RTX 2080 GPU. The black dashed line depicts linear scaling.

References

    1. Potter D.; Stadel J.; Teyssier R. PKDGRAV3: Beyond trillion particle cosmological simulations for the next era of galaxy surveys. Comput. Astrophys. Cosmol. 2017, 4, 2.10.1186/s40668-017-0021-1. - DOI
    1. Arnold A.; Fahrenberger F.; Holm C.; Lenz O.; Bolten M.; Dachsel H.; Halver R.; Kabadshow I.; Gähler F.; Heber F.; Iseringhausen J.; Hofmann M.; Pippig M.; Potts D.; Sutmann G. Comparison of scalable fast methods for long-range interactions. Phys. Rev. E 2013, 88, 06330810.1103/PhysRevE.88.063308. - DOI - PubMed
    1. Dawson J. M. Particle simulation of plasmas. Rev. Mod. Phys. 1983, 55, 403–447. 10.1103/RevModPhys.55.403. - DOI
    1. Bock L.; Blau C.; Schröder G.; Davydov I.; Fischer N.; Stark H.; Rodnina M.; Vaiana A.; Grubmüller H. Energy barriers and driving forces in tRNA translocation through the ribosome. Nat. Struct. Mol. Biol. 2013, 20, 1390–1396. 10.1038/nsmb.2690. - DOI - PubMed
    1. Zink M.; Grubmüller H. Mechanical properties of the icosahedral shell of southern bean mosaic virus: A molecular dynamics study. Biophys. J. 2009, 96, 1350–1363. 10.1016/j.bpj.2008.11.028. - DOI - PMC - PubMed