. 2020 Oct 21:9:e53550.
doi: 10.7554/eLife.53550.

ARID1A loss in adult hepatocytes activates β-catenin-mediated erythropoietin transcription

Affiliations

ARID1A loss in adult hepatocytes activates β-catenin-mediated erythropoietin transcription

Rozenn Riou et al. Elife. .

Abstract

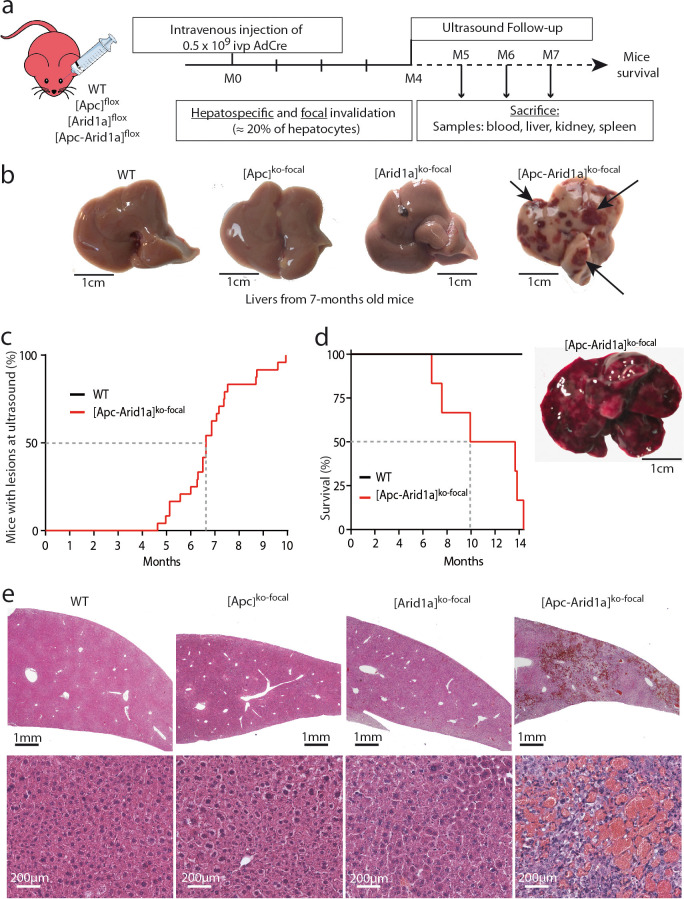
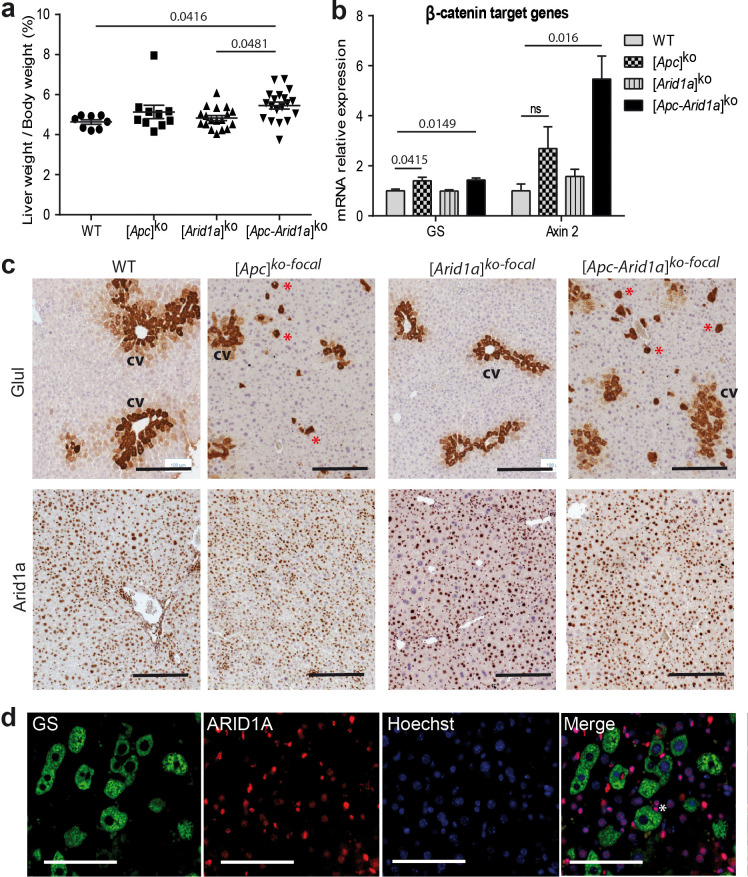
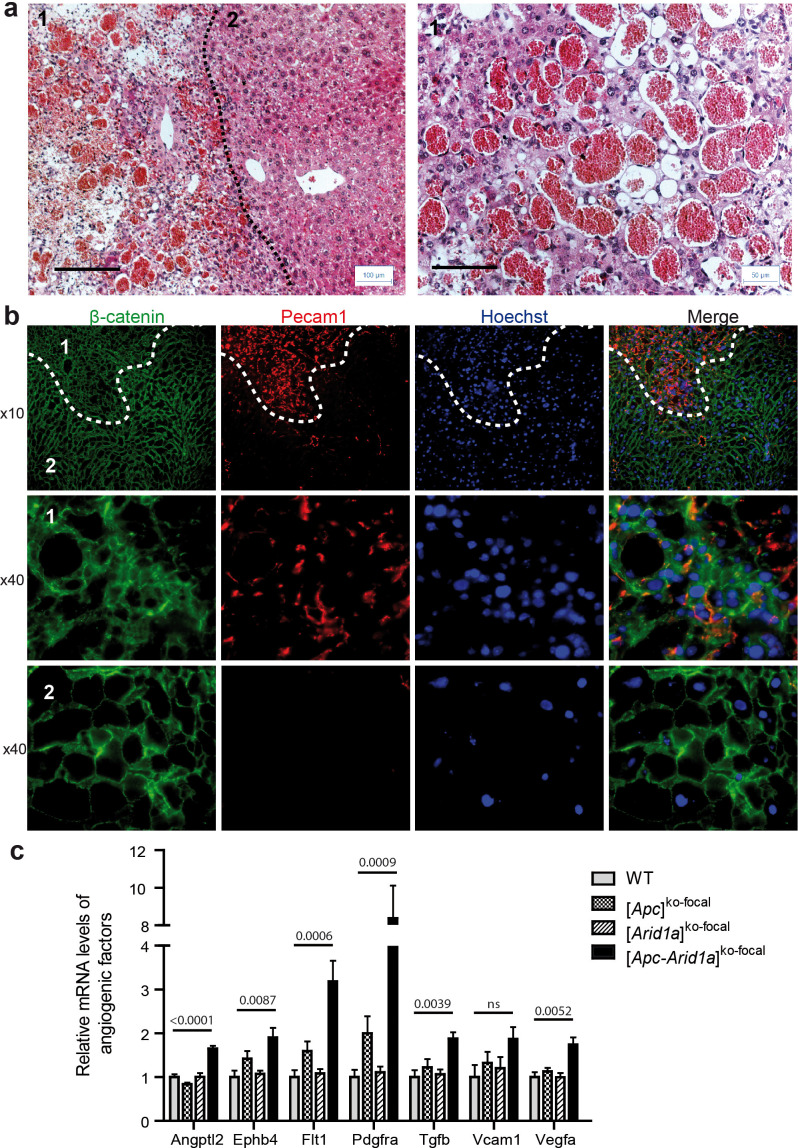
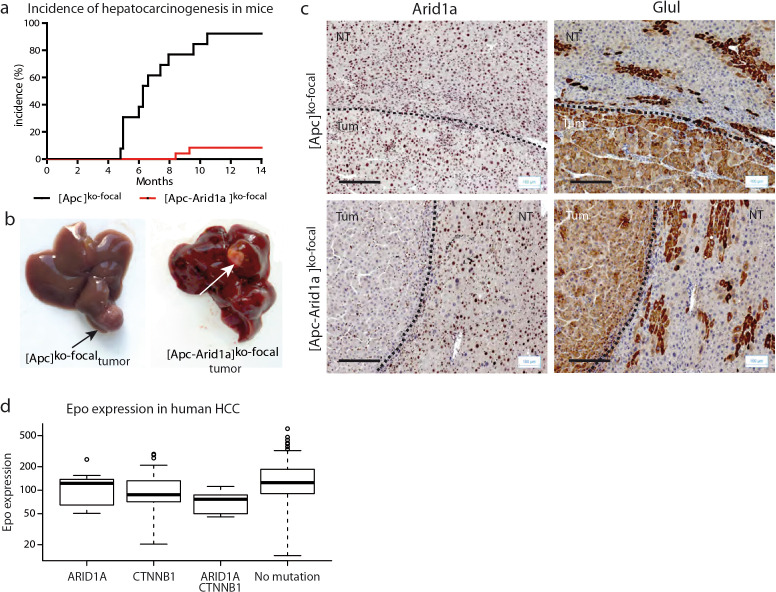
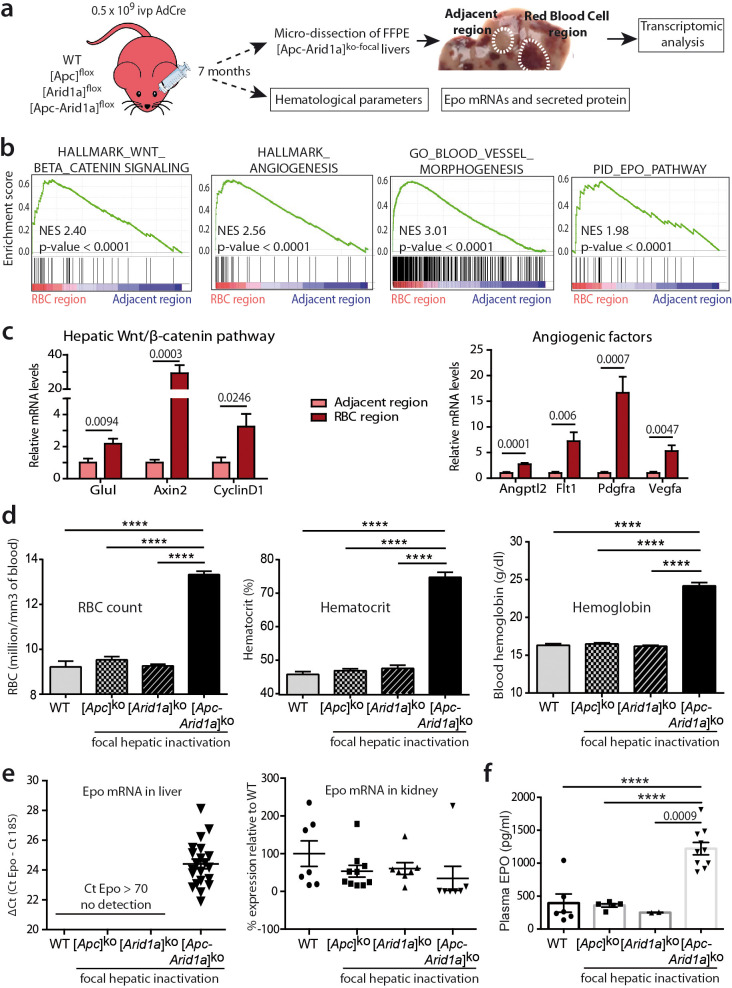
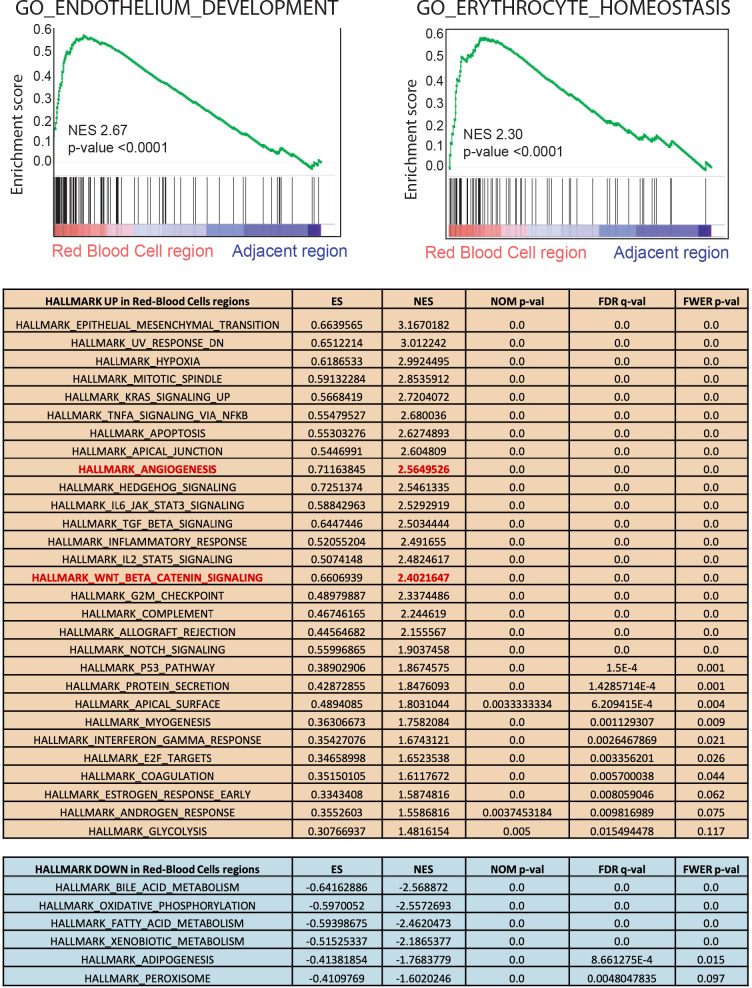
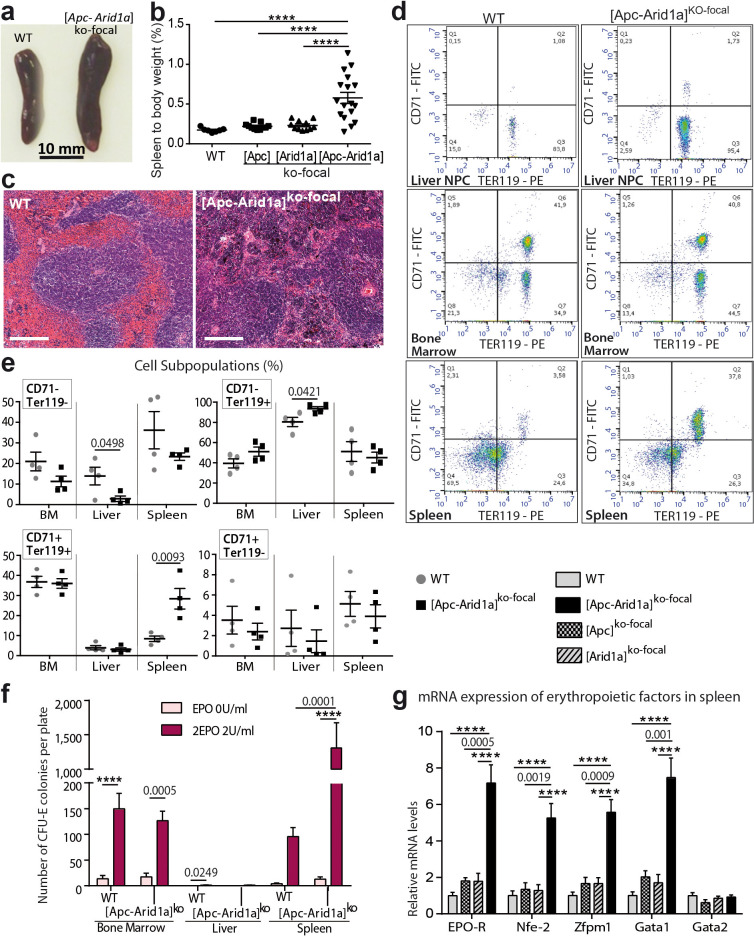
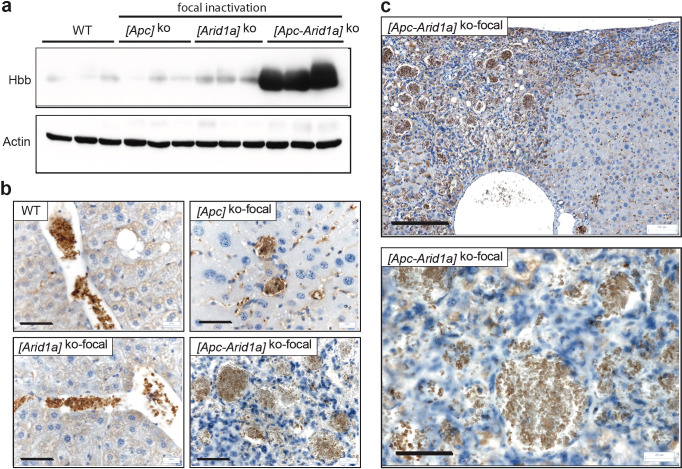
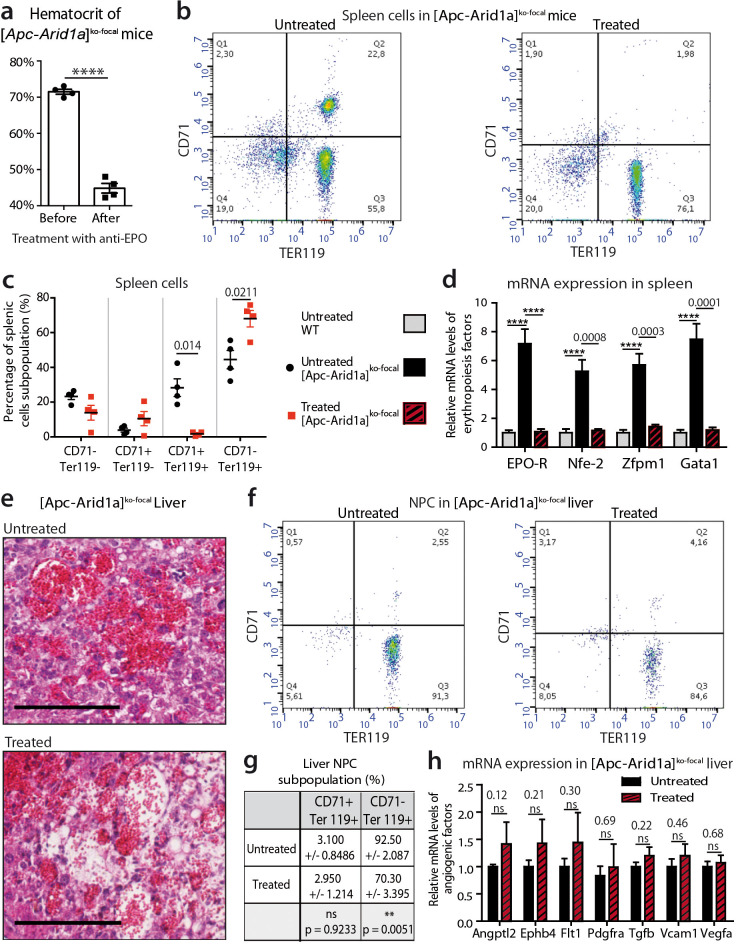
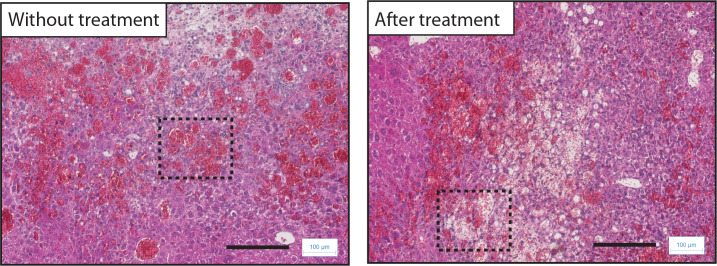
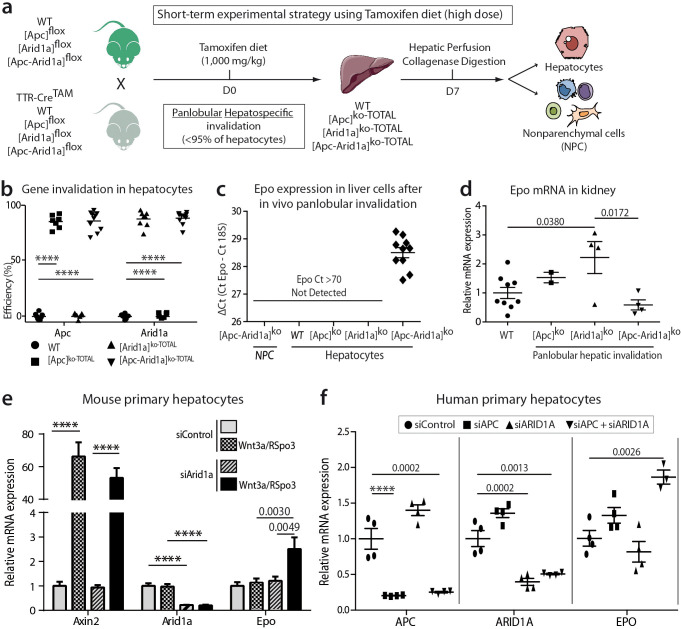
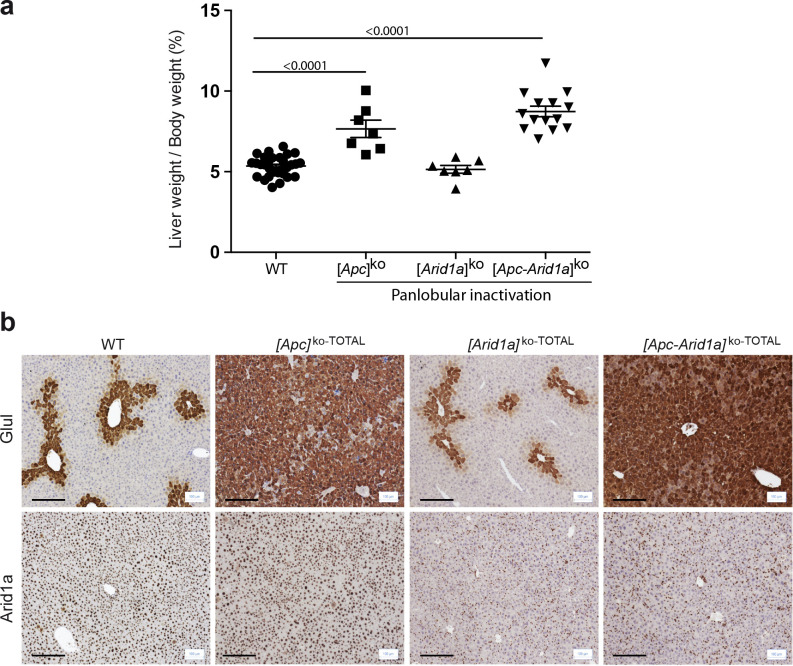
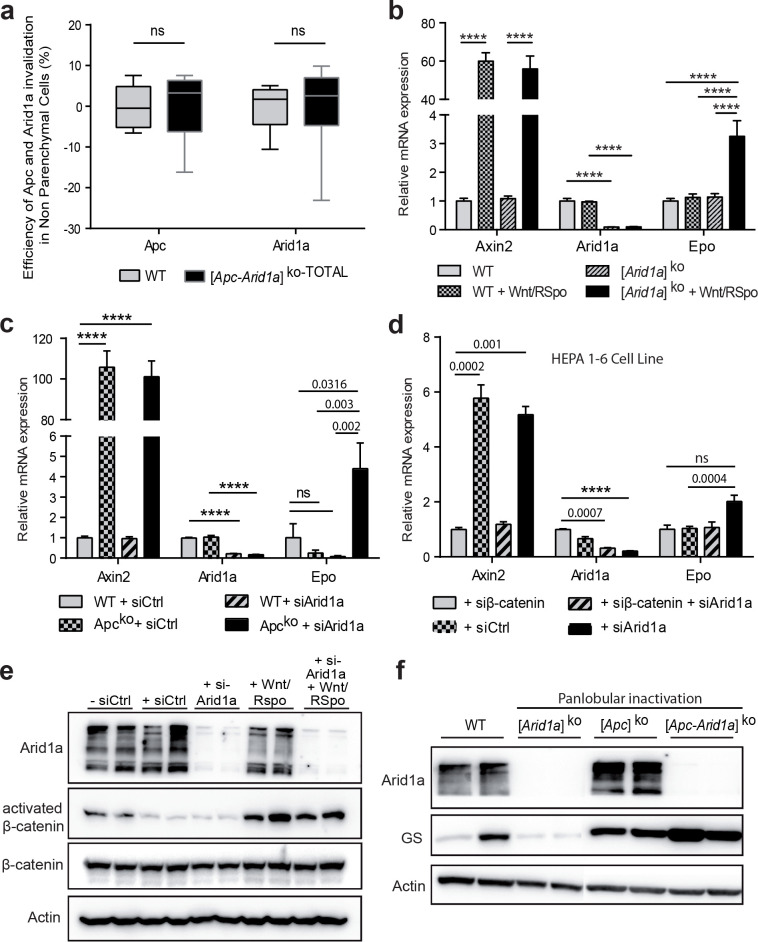
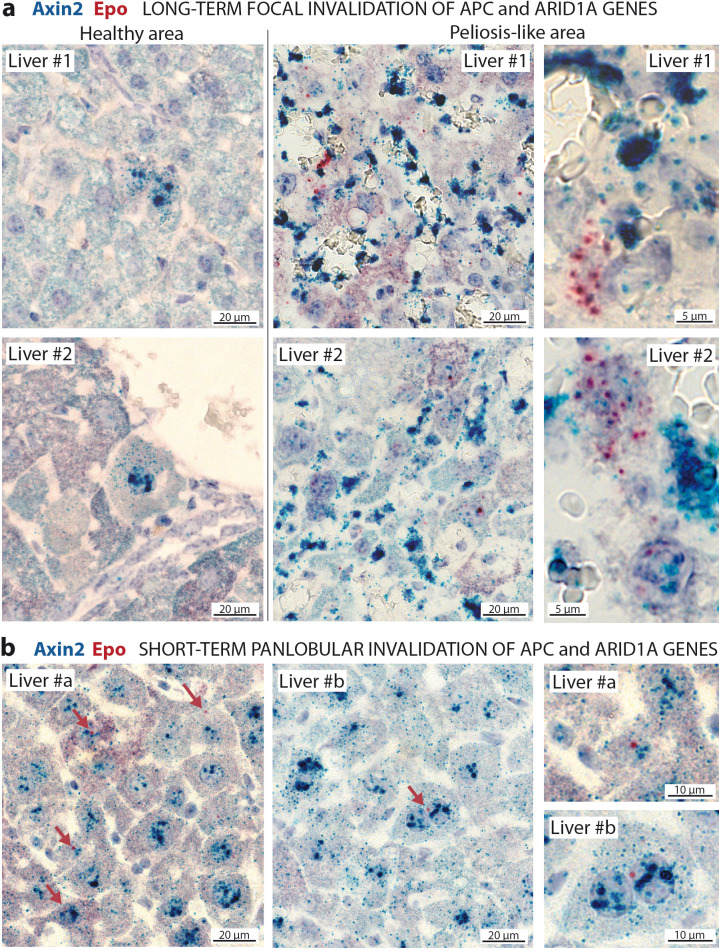
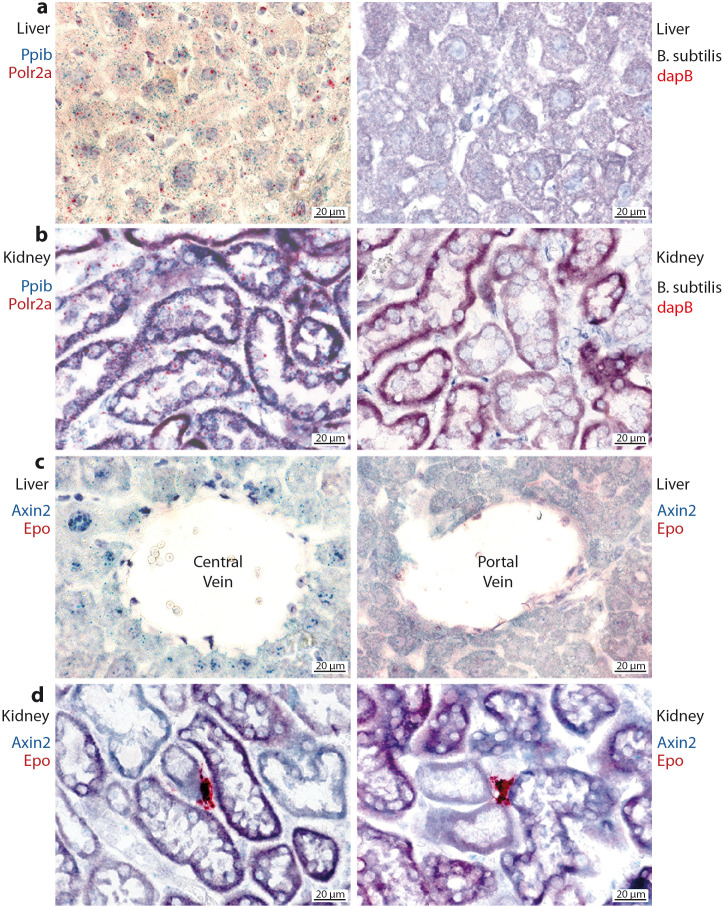
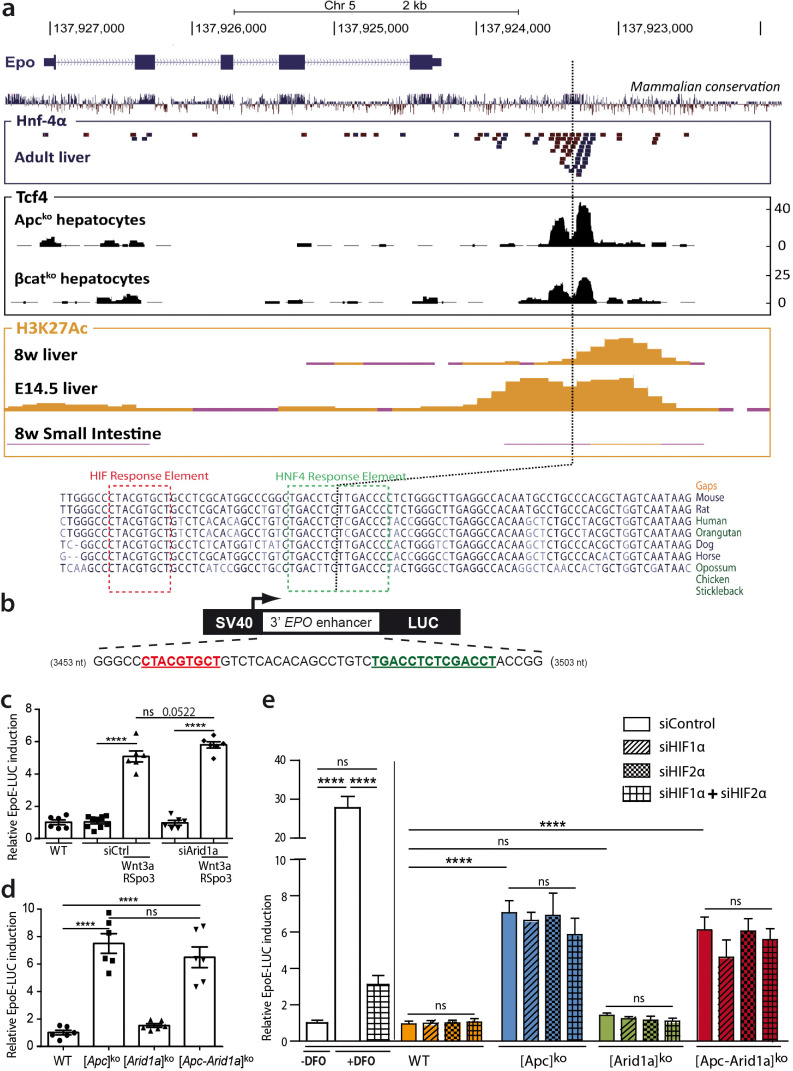
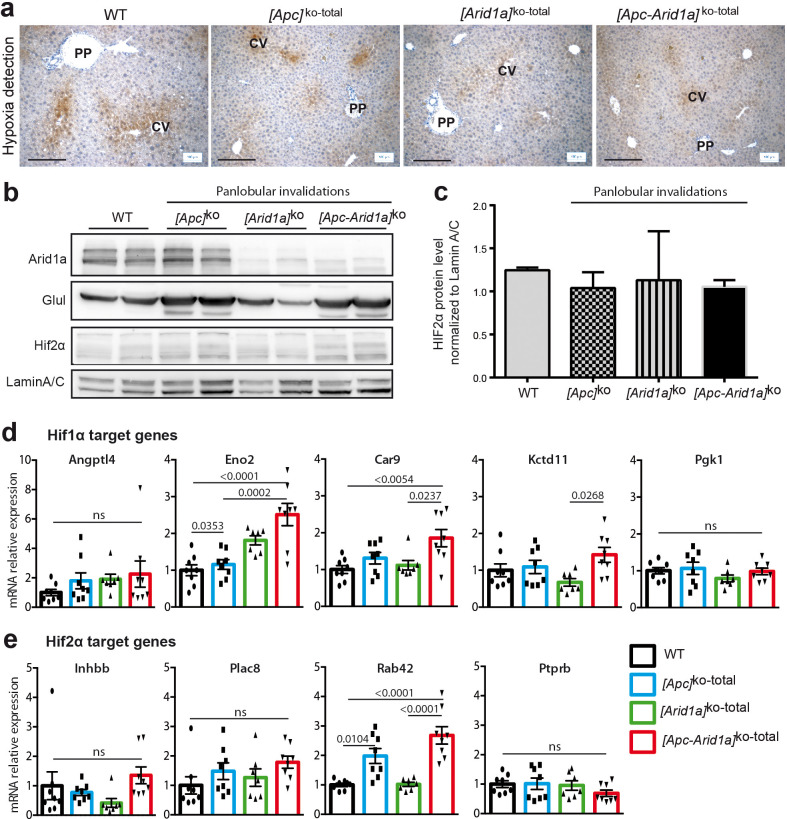
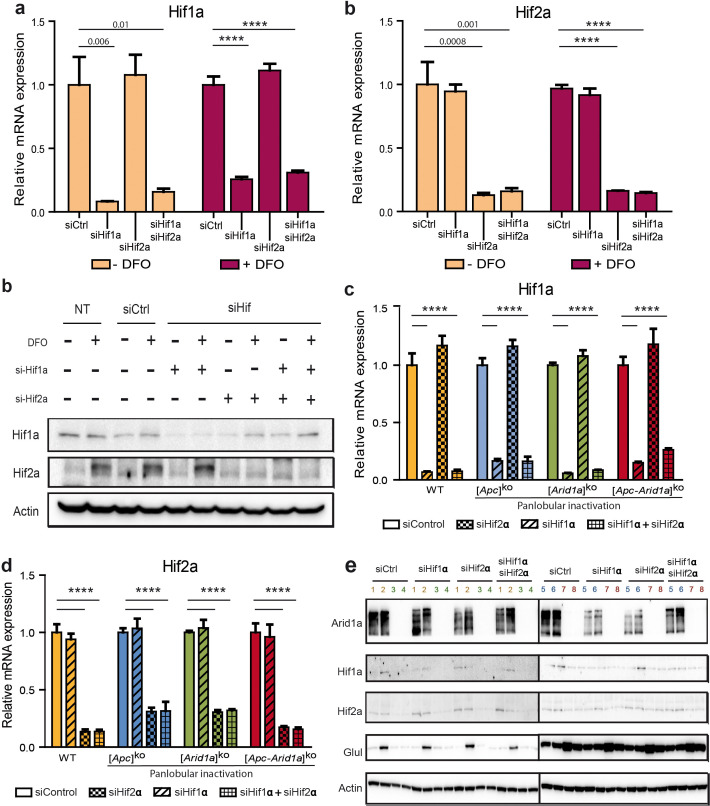
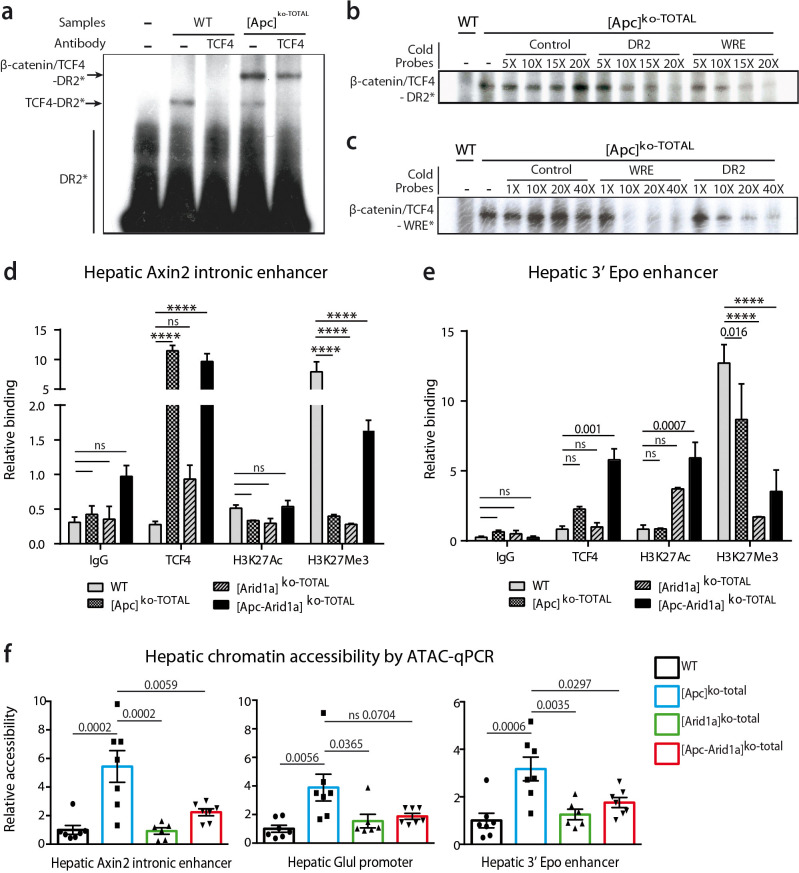
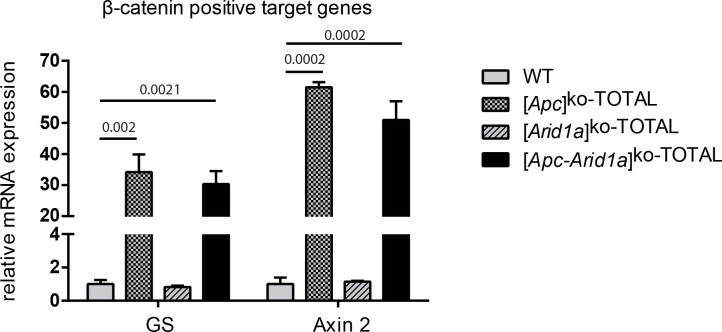
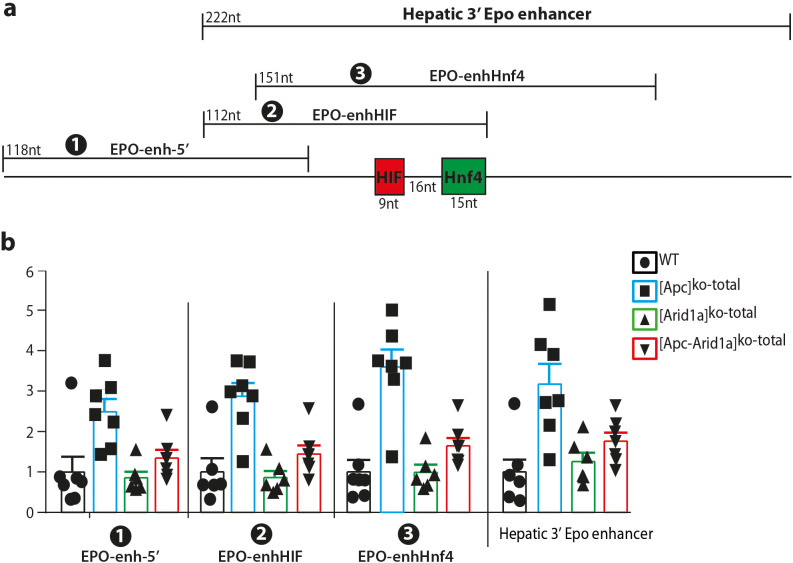
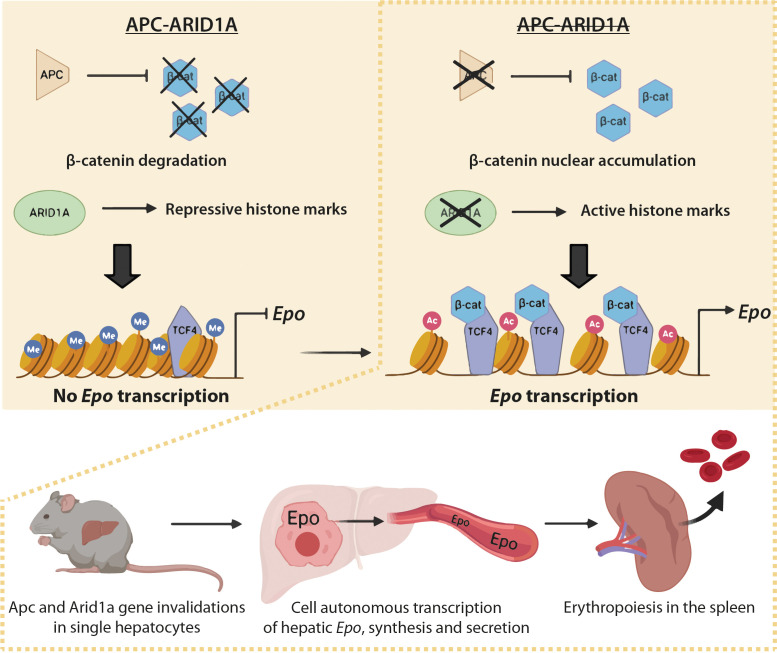
Erythropoietin (EPO) is a key regulator of erythropoiesis. The embryonic liver is the main site of erythropoietin synthesis, after which the kidney takes over. The adult liver retains the ability to express EPO, and we discovered here new players of this transcription, distinct from the classical hypoxia-inducible factor pathway. In mice, genetically invalidated in hepatocytes for the chromatin remodeler Arid1a, and for Apc, the major silencer of Wnt pathway, chromatin was more accessible and histone marks turned into active ones at the Epo downstream enhancer. Activating β-catenin signaling increased binding of Tcf4/β-catenin complex and upregulated its enhancer function. The loss of Arid1a together with β-catenin signaling, resulted in cell-autonomous EPO transcription in mouse and human hepatocytes. In mice with Apc-Arid1a gene invalidations in single hepatocytes, Epo de novo synthesis led to its secretion, to splenic erythropoiesis and to dramatic erythrocytosis. Thus, we identified new hepatic EPO regulation mechanism stimulating erythropoiesis.

Keywords: Wnt signaling; chromatin remodeling; chromosomes; developmental biology; epo transcription; gene expression; human; liver physiopathology; mouse.


Conflict of interest statement

RR, ML, SG, PB, AG, CG, RL, IL, FL, JC, AD, ZW, FV, SC No competing interests declared

Figures

Figure 1.
Figure 1.. Development of peliosis-like regions after hepato-specific and focal Arid1a and Apc inactivation.
(a) Cre-loxP-generated hepatocyte-specific and inducible inactivation of Apc and/or Arid1a in 20% of hepatocytes after retro-orbital injection of infectious viral particles (ivp) of adenovirus encoding Cre recombinase (AdCre). The resulting mice are referred to as [Apc-Arid1a]ko-focal, [Apc]ko-focal, and [Arid1a]ko-focal. (b) Gross examination of mouse livers, 7 months after AdCre injection. Livers from [Apc-Arid1a]ko-focal mice had an irregular shape and a rough surface, with multiple dark red zones (indicated by arrows). (c) Incidence of hepatic lesions detected in WT (n = 10) and [Apc-Arid1a]ko-focal (n = 24) mice by ultrasonography. (d) Kaplan-Meier estimated survival curves of WT and [Apc-Arid1a]ko-focal mice over 15 months. n = 6 for each group. Inset: Liver of one mouse at necropsy (13 months after AdCre injection, representative of the three analyzed mice). (e) Hematoxylin Eosin (HE)-stained sections of mouse livers at 7 months post-injection. Large vascular spaces filled with blood cells were observed only in [Apc-Arid1a]ko-focal livers. Related data are found in Figure 1—figure supplements 1–4, and source data in ‘Figure 1—source data 1; Figure 1—figure supplement 1—source data 1; Figure 1—figure supplement 3—source data 1’.
Figure 1—figure supplement 1.
Figure 1—figure supplement 1.. Focal inactivation of Apc and/or Arid1a genes in mouse liver.
(a) Liver to Body weight (%) in mice; WT (n = 8), [Apc]ko-focal (n = 10), [Arid1a]ko-focal (n = 18), and [Apc-Arid1a]ko-focal (n = 19) mice. (b) RT-qPCR analysis of β-catenin-positive target genes from seven-month-old-mouse livers. WT (n = 5), [Apc]ko-TOTAL (n = 7), [Arid1a]ko-TOTAL (n = 12), and [Apc-Arid1a]ko-TOTAL (n = 10) mice. The data in (a,b) are expressed as the mean ± SEM and analyzed with one-way ANOVA. (c,d) Immunostainings against glutamine synthetase (Glul) and Arid1a after focal Apc and/or Arid1a loss. (c) Note the physiological staining of Glul in hepatocytes surrounding the centrolobular vein (cv). Focal activation of β-catenin signaling in single hepatocytes leads to an immunostaining of Glul, its hepatospecific target (red asterisk). Scale bars = 200 μm. (d) Immunofluorescence for Glul in hepatocytes without Arid1a nuclear fluorescence (white asterisk), shows the efficiency and specificity of the double Apc/Arid1a inactivation in [Apc-Arid1a]ko-focal livers (white asterisk). Scale bars = 100 μm.
Figure 1—figure supplement 2.
Figure 1—figure supplement 2.. Ultrasound features of livers from seven-month-old [Apc-Arid1a]ko-focal mice.
(a) Echogenicity of peliotic areas within the [Apc-Arid1a]ko-focal liver (arrow), showing striking tissue modification. Scale bars = 2 cm. (b) Dynamic contrast-enhanced ultrasound using microbubble administration. Contrast-enhanced ultrasound imaging involves the injection of gas-filled micron-sized bubbles (microbubbles) that do not extravasate. This property makes them ideal contrast agents for imaging vascularity and blood perfusion. The protocol has been described in Snipstad et al., 2017. It revealed a decrease of hepatic vascular perfusion within echogenic areas compared to neighboring control tissue.
Figure 1—figure supplement 3.
Figure 1—figure supplement 3.. Blood vessel enrichment and angiogenesis in [Apc-Arid1a]ko-focal livers.
(a) Peliotic areas appeared as abnormal tangles of irregularly shaped, leaky, small and large blood vessels filled with red blood cells, with multiple, mottled cyst-like spaces associated with sinusoidal dilatation and liver cell dropout in the livers of [Apc-Arid1a]ko-focal mice (1), relative to neighboring tissue (2). Scale bars = 200 μm (left panel) and 100 μm (right panel). (b) Immunofluorescence, at different magnifications, against β-catenin and Pecam1 of [Apc-Arid1a]ko-focal liver. Peliosis-like area, showing strong enrichment of blood vessels (1) compared to neighboring tissue (2). (c) RT-qPCR analysis of angiogenic factors from 7-month-old-mouse livers. WT (n = 5), [Apc]ko-TOTAL (n = 7), [Arid1a]ko-TOTAL (n = 12), and [Apc-Arid1a]ko-TOTAL (n = 10) mice. Data are presented as the mean + SEM and analyzed by one-way ANOVA.
Figure 1—figure supplement 4.
Figure 1—figure supplement 4.. Hepatocarcinogenesis in β-catenin-activated and Arid1a-null context.
(a–c) HCC incidence decrease in [Apc-Arid1a]ko-focal compared to [Apc]ko-focal mice. (a) Incidence of HCC was detected by ultrasound in [Apc]ko-focal (n = 13) and [Apc-Arid1a]ko-focal (n = 24) mice. (b) Two representative livers of ten-month-old [Apc]ko-focal and [Apc-Arid1a]ko-focal mouse livers presenting tumor. (c) Immunostaining of glutamine synthetase (Glul) and Arid1a in [Apc]ko-focal and [Apc-Arid1a]ko-focal liver sections. NT: non tumoral tissue; Tum: tumor; Scale bars = 200 μm. (d) EPO expression in human HCC depending on their CTNNB1 and ARID1A mutational status. Datasets in hepatocellular carcinoma were downloaded from the Cancer Genome Atlas (TCGA) data portal (http://tcga-data.nci.nih.gov). We extracted two types of molecular data including gene expression and somatic mutation using TCGA2STAT R package. Fours groups of tumors were clusterized based on mutation status: CTNNB1-mutated (n = 46), ARID1A-mutated (n = 11), CTNNB1/ARID1A-mutated (n = 5) and no CTNNB1 nor ARID1A mutations (n = 133). Analysis of variance and post-hoc tests were performed to test the association between EPO expression and mutation status.
Figure 2.
Figure 2.. Hepatic peliosis has ‘angiogenic’ and ‘erythropoietin’ transcriptional signatures, linked to a systemic erythrocytosis and to de novo hepatic Epo expression in [Apc-Arid1a]ko-focal mice.
(a) Experimental strategy; (b) Transcriptomic gene-set enrichment analysis (GSEA) of hepatic peliosis (n = 4) relative to adjacent regions (n = 4) of [Apc-Arid1a]ko-focal mice. (c) Quantitative RT-PCR showing relative expression of mRNAs for positive targets of hepatic Wnt/β-catenin pathway and angiogenic factors in hepatic peliosis (n = 10) compared to adjacent regions (n = 10) of [Apc-Arid1a]ko-focal mice (unpaired t test analysis); (d) Hematological parameters from WT (n = 7), [Apc]ko-focal (n = 12), [Arid1a]ko-focal (n = 19), and [Apc-Arid1a]ko-focal (n = 20) mice (One-way ANOVA analysis). (e) Evaluation of erythropoietin (Epo) mRNAs by quantitative RT-PCR in the livers analyzed by the ΔCt technique and expressed relative to those for 18S RNA for the liver, and as relative levels in the kidney (One-way ANOVA analysis). (f) Plasma EPO concentrations at sacrifice (WT (n = 6), [Apc]ko-focal (n = 5), [Arid1a]ko-focal (n = 2), and [Apc-Arid1a]ko-focal (n = 10)). Exact p-values are mentioned, ****p<0.0001. Related data are found in Figure 2—figure supplements 1 and source data in ‘Figure 2—source data 1'.
Figure 2—figure supplement 1.
Figure 2—figure supplement 1.. Peliosis-like regions from [Apc-Arid1a]ko-focal livers are enriched for ‘Endothelium development’ and ‘Erythrocyte homeostasis’ transcriptional signatures.
Gene-set enrichment analysis (GSEA) was performed with the Java tool application available at the Broad Institute (Cambridge, MA, USA) in which FFPE micro-dissected RBC regions were compared with neighboring tissue. ES: enrichment score, NES: normalized enrichment score, NOM p-val: nominal p-value, FDR: false discovery rate, FWER p-val: familywise-error rate p-value. Transcriptomic gene-set enrichment analysis (GSEA) of hepatic peliosis (n = 4) relative to adjacent regions (n = 4) of [Apc-Arid1a]ko-focal mice showing endothelium and erythrocyte signatures. The table below is a GSEA using the hallmark database.
Figure 3.
Figure 3.. Erythropoiesis occurs in the spleen of [Apc-Arid1a]ko-focal mice.
(a) Gross morphology of spleens from representative control (WT) and [Apc-Arid1a]ko-focal mice; (b) Spleen/body weight ratio of WT (n = 7), [Apc]ko-focal (n = 11), [Arid1a]ko-focal (n = 11), and [Apc-Arid1a]ko-focal (n = 17) mice (one-way ANOVA). (c) Hematoxylin and Eosin staining of splenic sections. Scale bar is 200 µm. (d,e) FACS analysis of liver NPC, bone marrow, and spleens from control (WT) or [Apc-Arid1a]ko-focal mice using the erythroid markers CD71 and Ter119. (e) FACS quantification from WT (n = 4) and [Apc-Arid1a]ko-focal (n = 4) mice (multiple t-test). (f) Quantification of erythroid progenitors as erythroid colony-forming units (CFU-E) in the presence of EPO, using 2 × 10⁵ cells from bone marrow or 2 × 10⁶ cells from the liver and spleen of WT or [Apc-Arid1a]ko-focal mice (2-way ANOVA). (g) Q-PCR showing relative expression of several factors, known to be involved in stress-induced erythropoiesis, in the spleens of WT (n = 9), [Apc]ko-focal (n = 5), [Arid1a]ko-focal (n = 8), and [Apc-Arid1a]ko-focal (n = 8) mice (one-way ANOVA). ****p<0.0001. Related data are found in Figure 3—figure supplements 1 and source data in ‘Figure 3—source data 1'.
Figure 3—figure supplement 1.
Figure 3—figure supplement 1.. Hepato-specific and focal inactivation of Apc and Arid1a genes leads to sequestration of enucleated beta-globin-positive red blood cells.
Western blot (a) and immunostaining (b, c) of hemoglobin subunit beta (Hbb) showing that Hbb-positive erythroid cells accumulated in [Apc-Arid1a]ko-focal livers are not nucleated, so do not correspond to immature and proliferative erythroblasts. Scale bars = 52 μm (b, c: bottom panel) or 200 μm (c: top panel).
Figure 4.
Figure 4.. Blockade of Epo signaling with anti-EPO serum in [Apc-Arid1a]ko-focal mice eliminates aberrant erythropoiesis in the spleen, but maintains angiogenesis in the liver.
(a) Hematocrit before (n = 4) and after (n = 4) anti-EPO treatment (t-test). (b,c) FACS analysis (b) and quantification (c) of spleens with/without anti-EPO (n = 4 for each group) (t-test). (d) RT-qPCR showing relative expression of erythropoiesis factors in the spleens of WT (n = 9), treated [Apc-Arid1a]ko-focal (n = 4), untreated [Apc-Arid1a]ko-focal (n = 8) mice (one-way ANOVA). (e) Hematoxylin Eosin (HE)-stained sections of livers from representative 7-month-old mice. (f,g) FACS analysis (f) and quantification (g) of liver NPC with/without anti-EPO. (h) RT-qPCR showing relative expression of angiogenic factors in the livers with (n = 4) and without (n = 10) anti-EPO (t-test). ****p<0.0001. Related data are found in Figure 4—figure supplements 1 and source data in ‘Figure 4—source data 1'.
Figure 4—figure supplement 1.
Figure 4—figure supplement 1.. Anti-EPO blocking serum treatment in [Apc-Arid1a]ko-focal mice leads to decrease of intra-hepatic red blood cells accumulation.
Hematoxylin Eosin (HE)-stained sections of livers from untreated and treated 7-month-old [Apc-Arid1a]ko-focal mice with anti-EPO blocking serum. Scale bars = 200 μm. The dotted outlines correspond to increasing magnification showed in Figure 4f.
Figure 5.
Figure 5.. Cell-autonomous Epo expression after Arid1a inactivation and Wnt/β-catenin activation in murine and human hepatocytes.
(a) In vivo and ex vivo strategy. WT (n = 8), [Apc]ko-TOTAL (n = 7), [Arid1a]ko-TOTAL (n = 8), and [Apc-Arid1a]ko-TOTAL (n = 10) mice. (b) Inactivation efficiency of Apc and Arid1a genes in isolated hepatocytes. (c,d) RT-qPCR assessment of erythropoietin (Epo) transcription (c) in the hepatocyte and NPC compartments of the livers, (d) in the kidney (1-way ANOVA). (e) In vitro analysis of Axin2, Arid1a (Arid1a floxed-exon detection), and Epo expression by RT-qPCR of mouse hepatocytes after Wnt3a and R-Spondin3 stimulation, and si-Arid1a/si-Control treatments, showing Arid1a knockdown efficiency and Wnt/β-catenin pathway activation, as the mRNA levels of Axin2, a canonical target gene of Wnt signaling, significantly increased (2-way ANOVA). (f) In vitro analysis of Apc, Arid1a, and Epo by RT-qPCR of cryopreserved human hepatocytes after siRNA transfection (one-way ANOVA analysis). Data are presented as the mean ± SEM. ****p<0.0001. Cell culture data are representative of three independent experiments. Related data are found in Figure 5—figure supplements 1–2, and source data in ‘Figure 5—source data 1; Figure 5—figure supplement 1—source data 1; Figure 5—figure supplement 2—source data 1’.
Figure 5—figure supplement 1.
Figure 5—figure supplement 1.. Panlobular inactivation of Apc and/or Arid1a in hepatocytes.
(a) Hepatomegaly in mice after panlobular inactivations. WT (n = 30), [Apc]ko-TOTAL (n = 9), [Arid1a]ko-TOTAL (n = 9), and [Apc-Arid1a]ko-TOTAL (n = 14) mice. Data are presented as the mean + SEM and analyzed using one-way ANOVA. (b) Immunostaining of glutamine synthetase (Glul) and Arid1a after Apc and/or Arid1a loss in all hepatocytes in mouse liver. Note the physiological staining of Glul surrounding the centrilobular vein (cv) in WT and [Arid1a]ko-TOTAL livers and the remaining nonparenchymal staining of Arid1a after hepato-specific Arid1a inactivation ([Arid1a]KO-TOTAL and [Apc-Arid1a]KO-TOTAL). Apc loss leads to overactivation of the Wnt/β-catenin pathway and, consequently, increased Glul staining of hepatocytes to the whole lobule. Scale bars = 200 μm.
Figure 5—figure supplement 2.
Figure 5—figure supplement 2.. Cell-autonomous Epo expression after Arid1a invalidation and Wnt/β-catenin activation in hepatocytes.
(a) No invalidation of Apc and Arid1a genes was found in NPC from [Apc-Arid1a]ko-TOTAL mice (Student t-test). (b) In vitro analysis of Axin2, Arid1a, and Epo transcription by RT-qPCR in primary culture hepatocytes after siRNA-mediated knockdown of Arid1a (siArid1a, 20 nM) and Wnt3a and R-Spondin3 stimulation (Wnt/RSpo) relative to that of control hepatocytes. (c) In vitro expression of Axin2, Arid1a, and Epo in isolated [Apc]ko-TOTAL hepatocytes after siArid1a. (d) In vitro expression of Apc, Arid1a, and Epo in the HEPA1.6 β-catenin-mutated hepatoma murine cell line after siRNA-mediated knockdown of Arid1a and/or β-catenin. (e,f) Western blot of Arid1a and beta-catenin demonstrating effective siRNA-mediated knockdown of Arid1a (20 nM) and Wnt/Spondin stimulation in primary culture hepatocytes (e) and effective inactivation of Apc and/or Arid1a in vivo (f). Data are presented as the mean ± SEM and analyzed with one-way ANOVA. ****p<0.0001. Cell culture data are representative of three independent experiments carried out in triplicate.
Figure 6.
Figure 6.. In situ hybridization of mRNAs showing a de novo expression of Epo in a subset of β-catenin-activated hepatocytes.
(a) Seven months after Apc/Arid1a gene invalidation in single hepatocytes from two livers (#1 and #2); (b) 7 days after gene invalidation in more than 90% hepatocytes (two livers: #a and #b). Axin2 RNAScope probe stains β-catenin-activated hepatocytes (blue dots), and Epo RNAScope probe stains single Epo mRNAs as red dots. Related data are found in Figure 6—figure supplement 1.
Figure 6—figure supplement 1.
Figure 6—figure supplement 1.. Implementation of in situ Hybridization for Axin2 and Epo mRNAs using RNAScope, showing expressing mRNA as dots.
(a,b) Ppib (blue) and Polr2a (red) were successfully found expressed in liver and kidney FFPE sections of control mice. No expression of bacterial dapB was found. (c) In control livers, Axin2 mRNAs (blue) were restricted to the hepatocytes surrounding the central vein as a consequence of Wnt signaling in that area. No Epo was expressed. (d) In control kidneys, Epo mRNAs (red) were abundantly detected in rare interstitial cells.
Figure 7.
Figure 7.. Wnt/β-catenin directly controls EPO expression through 3’ Epo enhancer, in a HIF-independent manner.
(a) Genomic environment of the Epo gene (UCSC Genome Browser, mm9 database) and ChIP-seq peaks at the 3’ Epo enhancer. In blue/red: the crude reads of ChIP-Seq data performed in adult livers against HNF-4a (54). In black: ChIP-Seq under Apcko or βcatko conditions with an antibody against TCF4 (16). In yellow: ENCODE data of H3K27Ac marks in eight-week-old and E14.5 embryonic livers (Histone Mods by ChIP-Seq from ENCODE/LICR). (b) Schematic representation of the EpoE-Luc erythropoietin luciferase reporter, driven by the 3’ enhancer. (c–e) Luciferase reporter assays in mouse primary hepatocytes: (c) after in vitro overactivation of Wnt/β-catenin signaling and Arid1a knockdown (d) after in vivo Cre-loxP-mediated gene inactivation; (e) Effect of hypoxic-mimic conditions using desferrioxamine (DFO), and effect of knockdown of HIF factors (two separate experiments carried out in triplicate). Results are in relative light units, and analyzed using 1-way (d) or 2-way ANOVA (c,e). ****p<0.0001. Related data are found in Figure 7—figure supplements 1–2, and source data in ‘Figure 7—source data 1; Figure 7—figure supplement 1—source data 1; Figure 7—figure supplement 2—source data 1’.
Figure 7—figure supplement 1.
Figure 7—figure supplement 1.. Lack of hypoxia and HIF signaling in [Apc-Arid1a]ko-TOTAL livers.
(a) Immunodetection of hepatic hypoxia seven days after Apc and/or Arid1a loss in all hepatocytes in mouse liver. For hypoxia detection in tissues, mice were injected with Hypoxyprobe (NPI Inc) solution via intraperitoneal injection (60 mg/100 g body weight), and livers harvested 1 hr after. Paraffin sections were processed according to the manufacturer’s instructions (Hypoxyprobe-1 Kit). Note the physiological staining surrounding the centrilobular vein (cv) in all conditions. No pathological and extended hypoxia was detected. Scale bars = 200 μm. (b,c) Western blots of Arid1a, Glul, Hif2α, and actin (b), and Hif2α detection quantification (n = 2 for each genotype) (c) showing no Hif2α stabilization in either condition. (d) RT-qPCR analysis of Hif1α and Hif2α target gene expression in livers of 2-month-old mice, 1 week after panlobular Apc and Arid1a invalidation. WT (n = 8), [Apc]ko-TOTAL (n = 8), [Arid1a]ko-TOTAL (n = 7), and [Apc-Arid1a]ko-TOTAL (n = 8) mice. One-way ANOVA tests were done. ns = non significant.
Figure 7—figure supplement 2.
Figure 7—figure supplement 2.. Effect of HIF1α and HIF2α knock-downs in mouse primary and transgenic hepatocytes.
(a) RT-qPCR analysis of Hif1α and Hif2α expression in primary culture hepatocytes treated or not with desferrioxamine (DFO) and after siRNA mediated knockdown of Hif1α (20 nM) and/or Hif2α (20 nM). (b) Western blots of Hif1α, Hif2α, and actin showing that Hif1α and Hif2α were stabilized in presence of DFO and that siRNA-mediated knockdown against Hif1α, Hif2α were effective. (c,d) RT-qPCR analysis of Hif1α (c) and Hif2α (d) in primary culture hepatocytes from livers of 2-month-old mice. Experiments were performed 1 week after panlobular inactivation of Apc and/or Arid1a and 48 hr after siRNA mediated knockdown of Hif1α (20 nM) and/or Hif2α (20 nM). (e) Western blots of Arid1a, Hif1α, Hif2α, Glul and Actin showing that no increase of Hif1α and Hif2α was detected in primary culture hepatocytes from [Apc-Arid1a]ko-TOTAL mice compared to control ones. 1,2: WT; 3,4: [Arid1a]ko-TOTAL; 5,6: [Apc]ko-TOTAL; 7,8: [Apc-Arid1a]ko-TOTAL. Data are presented as the mean ± SEM and analyzed by one-way ANOVA ****p<0.0001. Cell culture data are representative of two independent experiments, each performed in technical triplicate.
Figure 8.
Figure 8.. β-catenin/Tcf4 complex binds to the HNF4-responsive element of Epo enhancer (Epo-HRE) after modifications of histone marks and chromatin accessibility.
(a) EMSA using nuclear proteic extracts from WT or [Apc]ko-TOTAL livers and 32P-labeled probes containing Epo-HRE (DR2). (b, c) Competitive EMSA using 32P-labeled DR2 (b) and 32P-labeled WRE (c) probes and increasing concentrations of cold probes containing HNF4, WRE or control-responsive element. WRE cold probes compete with radiolabeled DR2 motif for the Tcf4/β-catenin binding and vice versa. (d, e) Chromatin ImmunoPrecipitation (ChIP) assays of hepatocytes from WT, [Apc]ko-TOTAL, [Arid1a]ko-TOTAL, and [Apc-Arid1a]ko-TOTAL livers. ChIP-qPCR against IgG, Tcf4, Acetylation of Histone3 in Lysine27 (H3K27Ac), and Tri-methylation of Histone3 in Lysine27 (H3K27me3) for Axin2 (d) and Epo (e) enhancer regions. WT (n = 3), [Apc]ko-TOTAL (n = 2), [Arid1a]ko-TOTAL (n = 2), and [Apc-Arid1a]ko-TOTAL (n = 3) mice. Enrichment by ChIP was assessed relative to the input DNA and normalized to the level of negative controls. (f) ATAC-qPCR using frozen livers from WT (n = 7), [Apc]ko-TOTAL (n = 7), [Arid1a]ko-TOTAL (n = 6), and [Apc-Arid1a]ko-TOTAL (n = 7) mice. Data are analyzed with one-way ANOVA. ****p<0.0001. Related data are found in Figure 8—figure supplements 1–2, and source data in ‘Figure 8—source data 1; Figure 8—figure supplement 2—source data 1; Figure 8—figure supplement 2—source data 1’.
Figure 8—figure supplement 1.
Figure 8—figure supplement 1.. The expression of β-catenin-positive target genes is not modulated by Arid1a status.
RT-qPCR analysis of GS and Axin2 expression in hepatocytes from the livers of two-month-old mice, one week after panlobular Apc and Arid1a invalidation. WT (n = 3), [Apc]ko-TOTAL (n = 2), [Arid1a]ko-TOTAL (n = 2), and [Apc- Arid1a]ko-TOTAL (n = 3) mice. Data are presented as the mean + SEM and analyzed with one-way ANOVA.
Figure 8—figure supplement 2.
Figure 8—figure supplement 2.. Chromatin accessibility assessed all along the hepatic 3’Epo enhancer by ATAC-qPCR.
(a) The hepatic 3’ Epo enhancer with the 4 PCR products analyzed: the whole hepatic 3’ Epo enhancer (222nt); (1) the EPO-enh-5’ located upstream the HIF- and Hnf4- responsive elements; (2) the EPO-enhHIF centered on the HIF-responsive element; (3) the EPO-enhHnf4 centered on the Hnf4 responsive element. In any case, the chromatin from Apcko hepatocytes is more accessible compared to WT chromatin, and the highest accessibility occurs on EPO-enhHnf4 both for [Apc]ko-TOTAL and [Apc-Arid1a]ko-TOTAL chromatin. Data are analyzed with two-way ANOVA. ****p<0.0001.
Figure 9.
Figure 9.. Schematic model of the role of Arid1a in hepatic Epo expression linked to overactivation of the Wnt/β-catenin pathway.
Under physiological conditions, the presence of Arid1a is associated with histone repressive marks at the Epo enhancer and β-catenin is constantly degraded; thus, Epo is not produced. In the absence of Apc, β-catenin/Tcf4 complex binds the Epo enhancer, and enhances chromatin accessibility, but the histone marks remain repressive. The loss of Arid1a increases active histone marks, which is insufficient to induce Epo transcription. After both Wnt/β-catenin activation and Arid1a inactivation, active histone marks and binding of β-catenin/Tcf4 to the Epo enhancer drive Epo liver transcription, and subsequent secretion of Epo into the bloodstream, resulting in splenic erythropoiesis and in substantial blood and liver erythrocytosis.

References

    1. Alldredge JK, Eskander RN. EZH2 inhibition in ARID1A mutated clear cell and endometrioid ovarian and endometrioid endometrial cancers. Gynecologic Oncology Research and Practice. 2017;4:17. doi: 10.1186/s40661-017-0052-y. - DOI - PMC - PubMed
    1. Anson M, Crain-Denoyelle AM, Baud V, Chereau F, Gougelet A, Terris B, Yamagoe S, Colnot S, Viguier M, Perret C, Couty JP. Oncogenic β-catenin triggers an inflammatory response that determines the aggressiveness of hepatocellular carcinoma in mice. Journal of Clinical Investigation. 2012;122:586–599. doi: 10.1172/JCI43937. - DOI - PMC - PubMed
    1. Bahar Halpern K, Tanami S, Landen S, Chapal M, Szlak L, Hutzler A, Nizhberg A, Itzkovitz S. Bursty gene expression in the intact mammalian liver. Molecular Cell. 2015;58:147–156. doi: 10.1016/j.molcel.2015.01.027. - DOI - PMC - PubMed
    1. Barker N, Hurlstone A, Musisi H, Miles A, Bienz M, Clevers H. The chromatin remodelling factor Brg-1 interacts with beta-catenin to promote target gene activation. The EMBO Journal. 2001;20:4935–4943. doi: 10.1093/emboj/20.17.4935. - DOI - PMC - PubMed
    1. Benhamouche S, Decaens T, Godard C, Chambrey R, Rickman DS, Moinard C, Vasseur-Cognet M, Kuo CJ, Kahn A, Perret C, Colnot S. Apc tumor suppressor gene is the "zonation-keeper" of mouse liver. Developmental Cell. 2006;10:759–770. doi: 10.1016/j.devcel.2006.03.015. - DOI - PubMed

Publication types

Associated data