

An interactive meta-analysis of MRI biomarkers of myelin
- PMID: 33084576
- PMCID: PMC7647401
- DOI: 10.7554/eLife.61523
An interactive meta-analysis of MRI biomarkers of myelin
Abstract
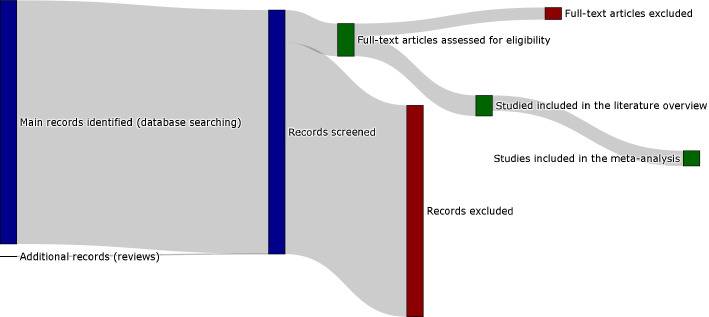
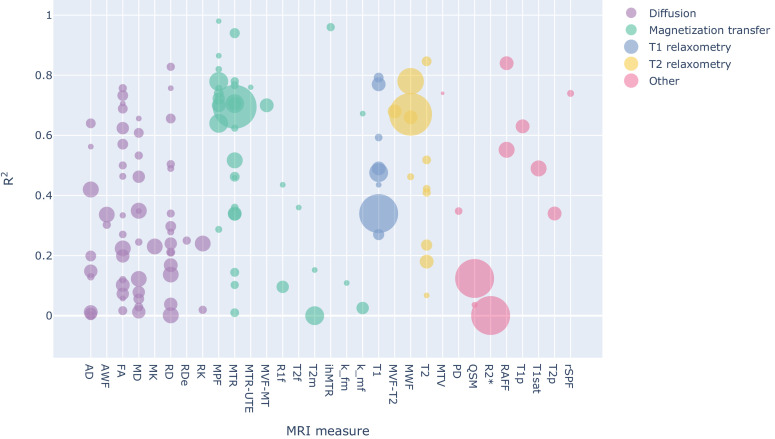
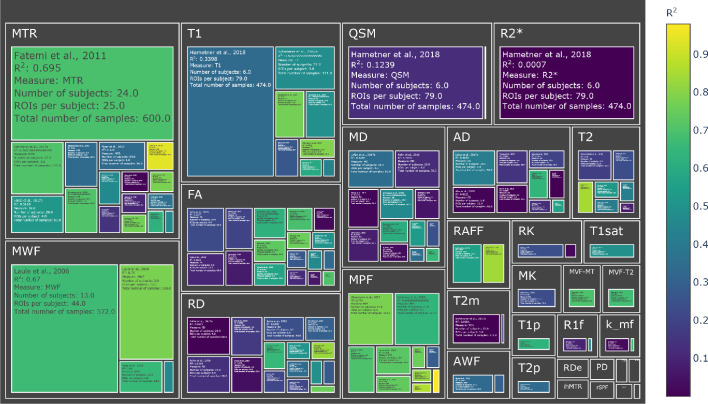
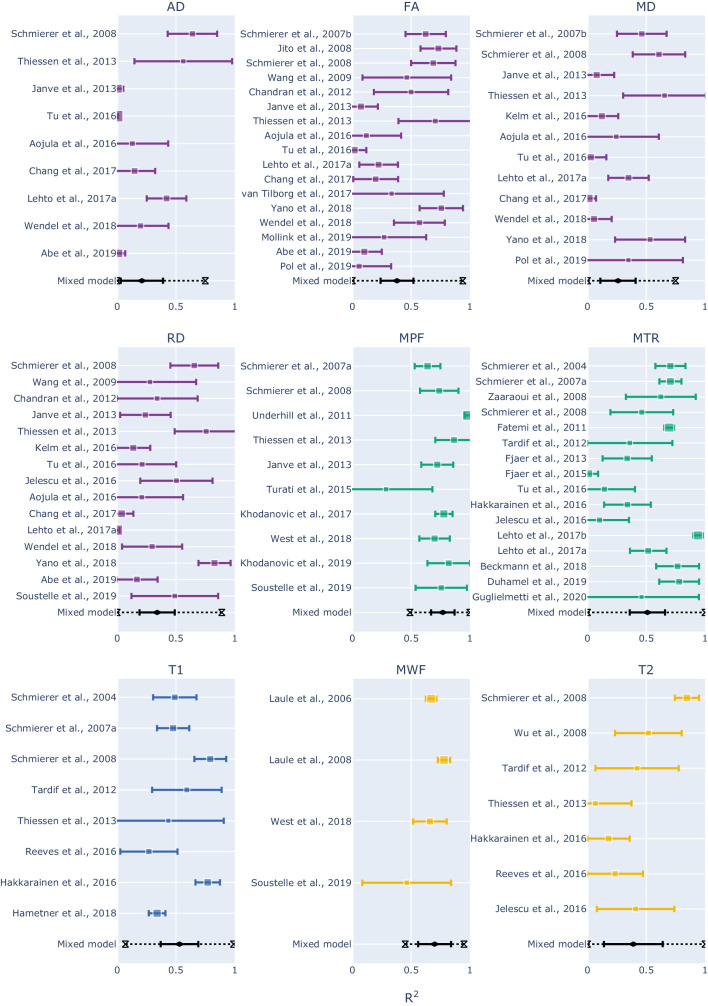
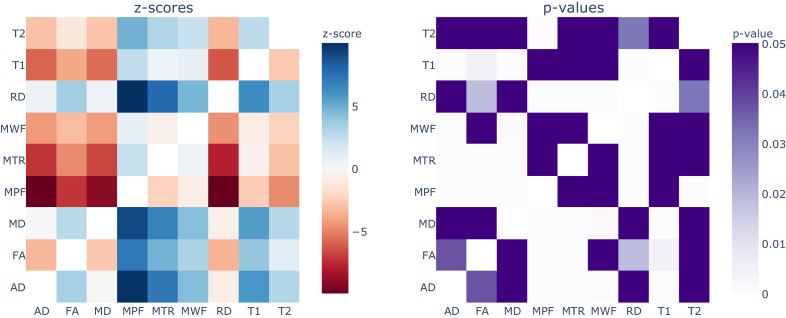
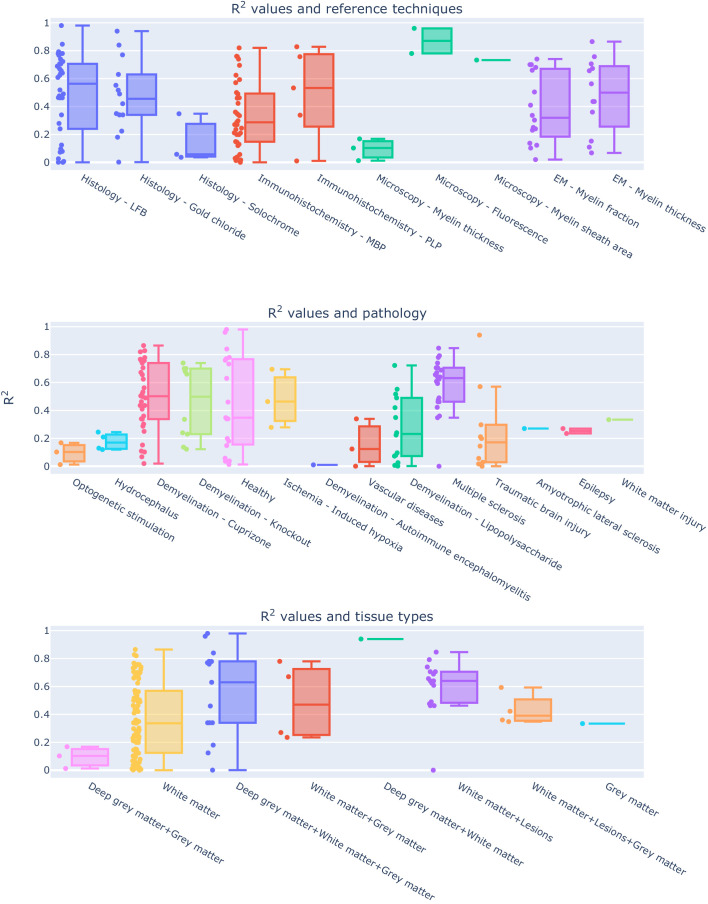
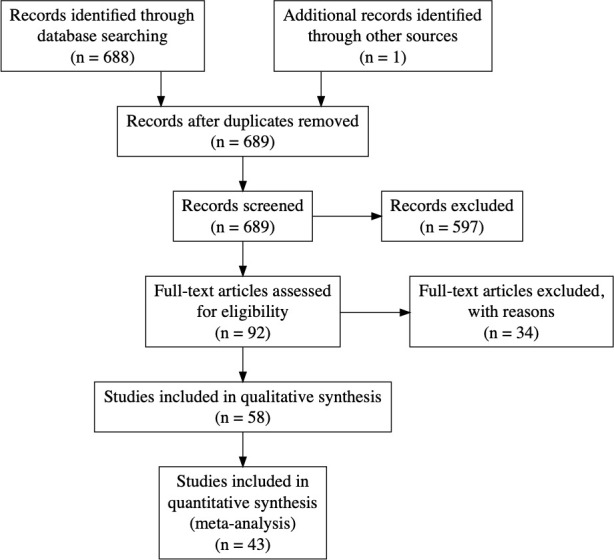
Several MRI measures have been proposed as in vivo biomarkers of myelin, each with applications ranging from plasticity to pathology. Despite the availability of these myelin-sensitive modalities, specificity and sensitivity have been a matter of discussion. Debate about which MRI measure is the most suitable for quantifying myelin is still ongoing. In this study, we performed a systematic review of published quantitative validation studies to clarify how different these measures are when compared to the underlying histology. We analyzed the results from 43 studies applying meta-analysis tools, controlling for study sample size and using interactive visualization (https://neurolibre.github.io/myelin-meta-analysis). We report the overall estimates and the prediction intervals for the coefficient of determination and find that MT and relaxometry-based measures exhibit the highest correlations with myelin content. We also show which measures are, and which measures are not statistically different regarding their relationship with histology.
Keywords: MRI; brain; central nervous system; histology; human; meta-analysis; mouse; myelin; neuroscience; rat.
© 2020, Mancini et al.
Conflict of interest statement
MM, AK, JC, MC, TN, NS No competing interests declared
Figures
References
-
- Abe Y, Komaki Y, Seki F, Shibata S, Okano H, Tanaka KF. Correlative study using structural MRI and super-resolution microscopy to detect structural alterations induced by long-term optogenetic stimulation of striatal medium spiny neurons. Neurochemistry International. 2019;125:163–174. doi: 10.1016/j.neuint.2019.02.017. - DOI - PubMed
-
- Aojula A, Botfield H, McAllister JP, Gonzalez AM, Abdullah O, Logan A, Sinclair A. Diffusion tensor imaging with direct cytopathological validation: characterisation of decorin treatment in experimental juvenile communicating hydrocephalus. Fluids and Barriers of the CNS. 2016;13:9. doi: 10.1186/s12987-016-0033-2. - DOI - PMC - PubMed
-
- Beaulieu C. CHAPTER 6 - The Biological Basis of Diffusion Anisotropy. In: Johansen-Berg H, Behrens T. E. J, editors. Diffusion MRI. Academic Press; 2009. pp. 105–126.
-
- Beckmann N, Giorgetti E, Neuhaus A, Zurbruegg S, Accart N, Smith P, Perdoux J, Perrot L, Nash M, Desrayaud S, Wipfli P, Frieauff W, Shimshek DR. Brain region-specific enhancement of remyelination and prevention of demyelination by the CSF1R kinase inhibitor BLZ945. Acta Neuropathologica Communications. 2018;6:9. doi: 10.1186/s40478-018-0510-8. - DOI - PMC - PubMed
Publication types
MeSH terms
Substances
Grants and funding
LinkOut - more resources
Full Text Sources
Medical
