. 2020 Oct 21:9:e61083.
doi: 10.7554/eLife.61083.

Drosophila hedgehog can act as a morphogen in the absence of regulated Ci processing

Affiliations

Drosophila hedgehog can act as a morphogen in the absence of regulated Ci processing

Jamie C Little et al. Elife. .

Abstract

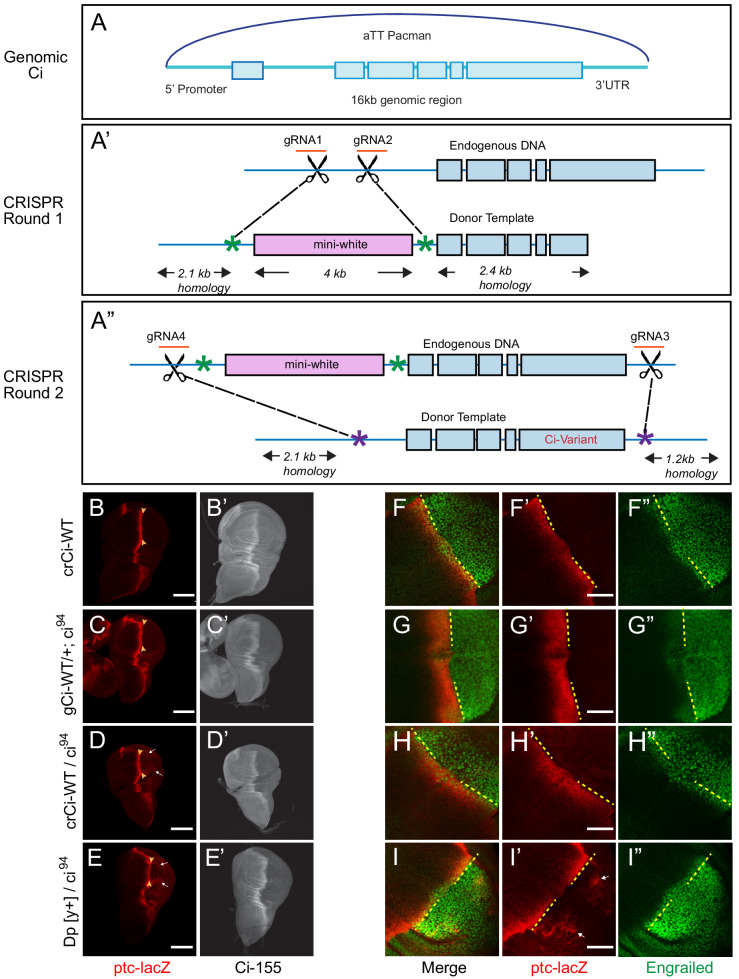
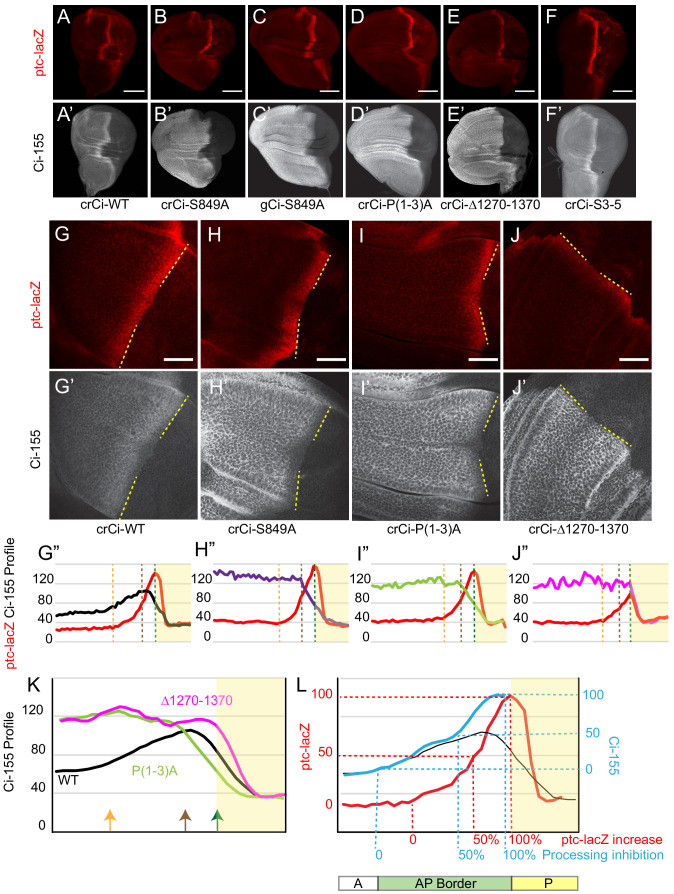
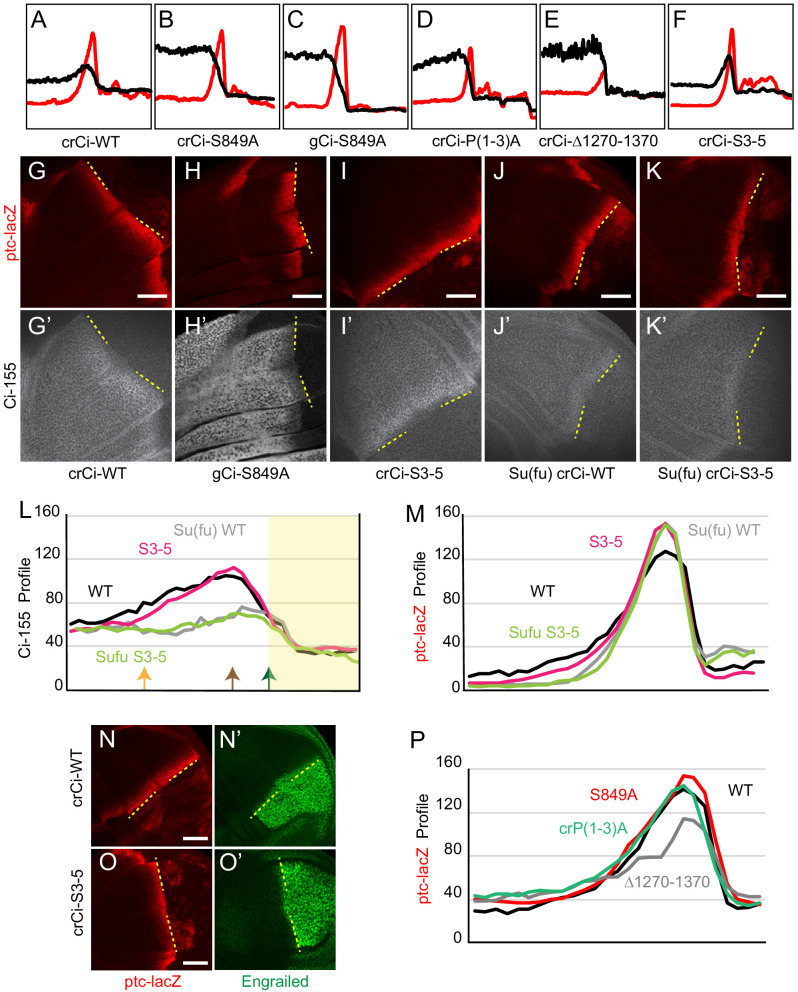
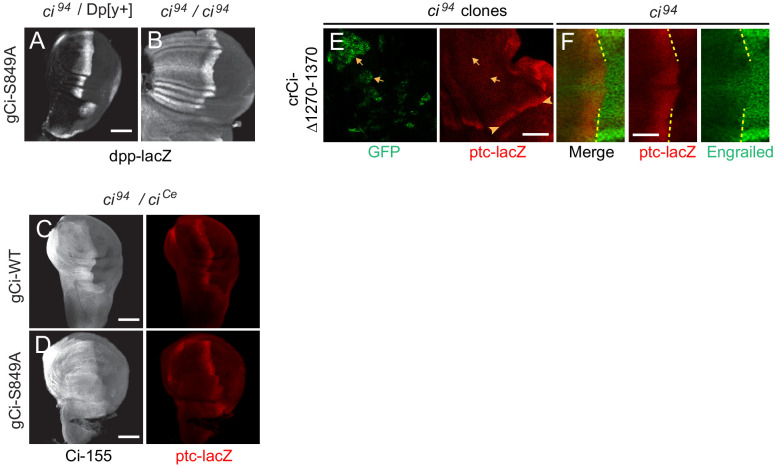
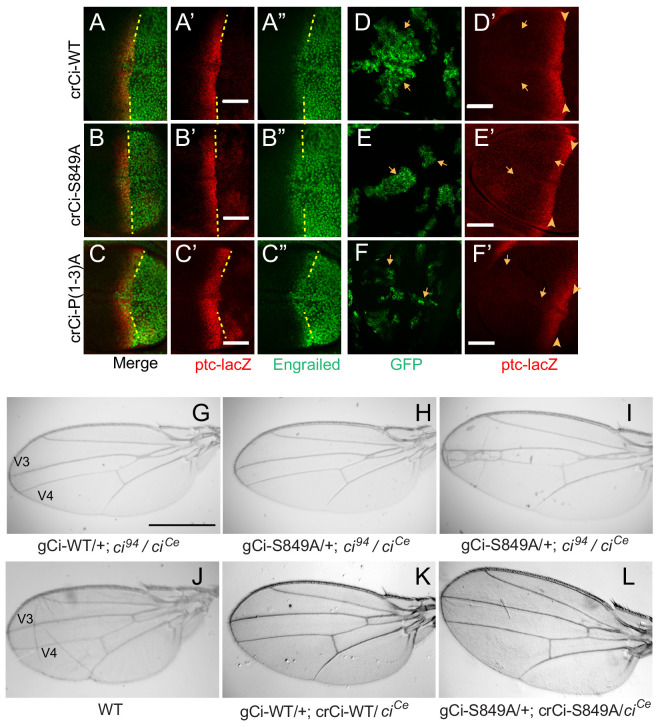
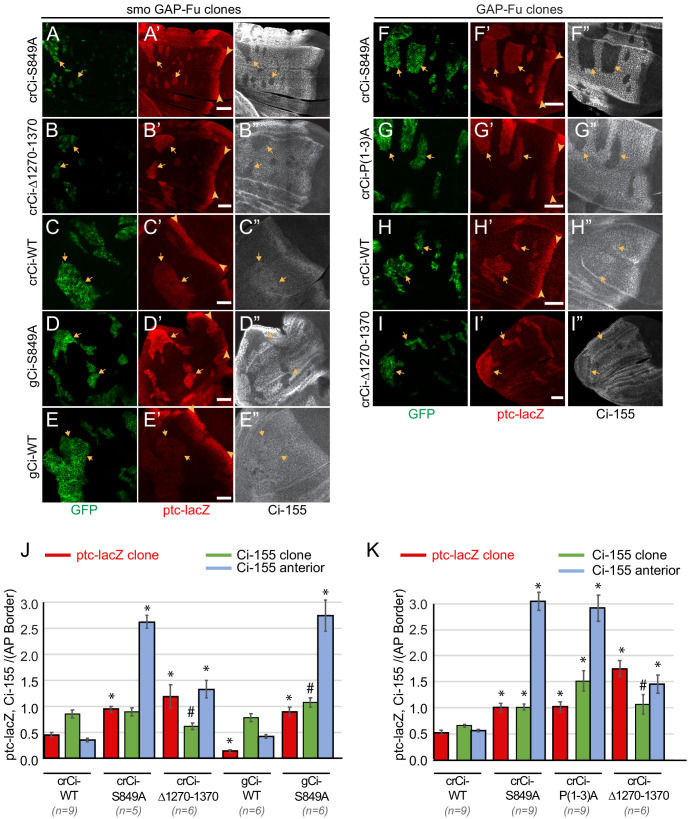
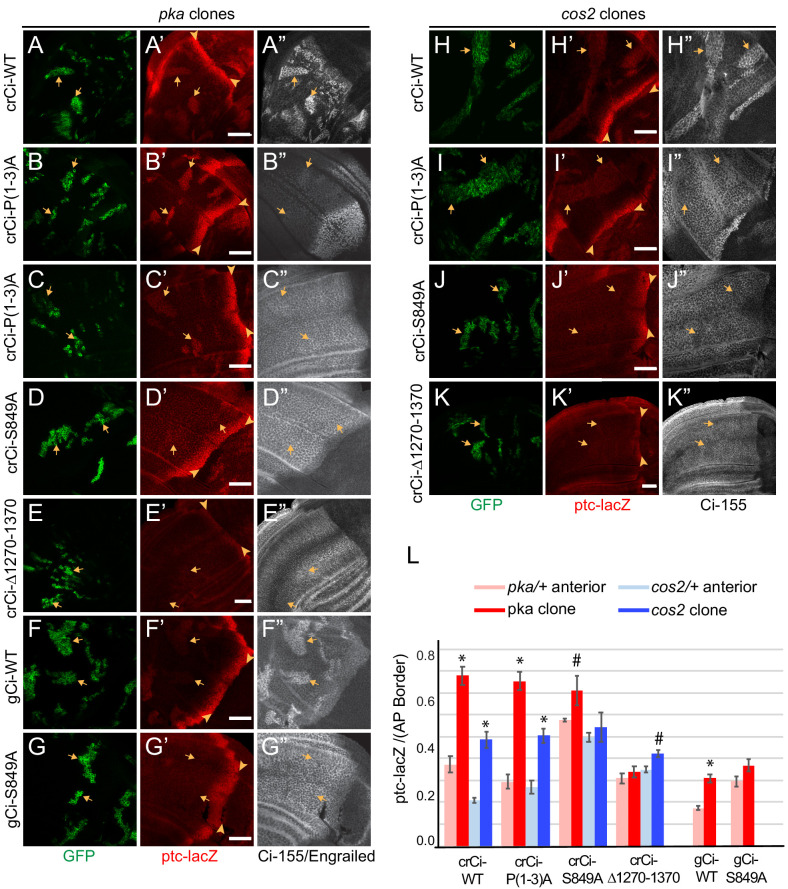
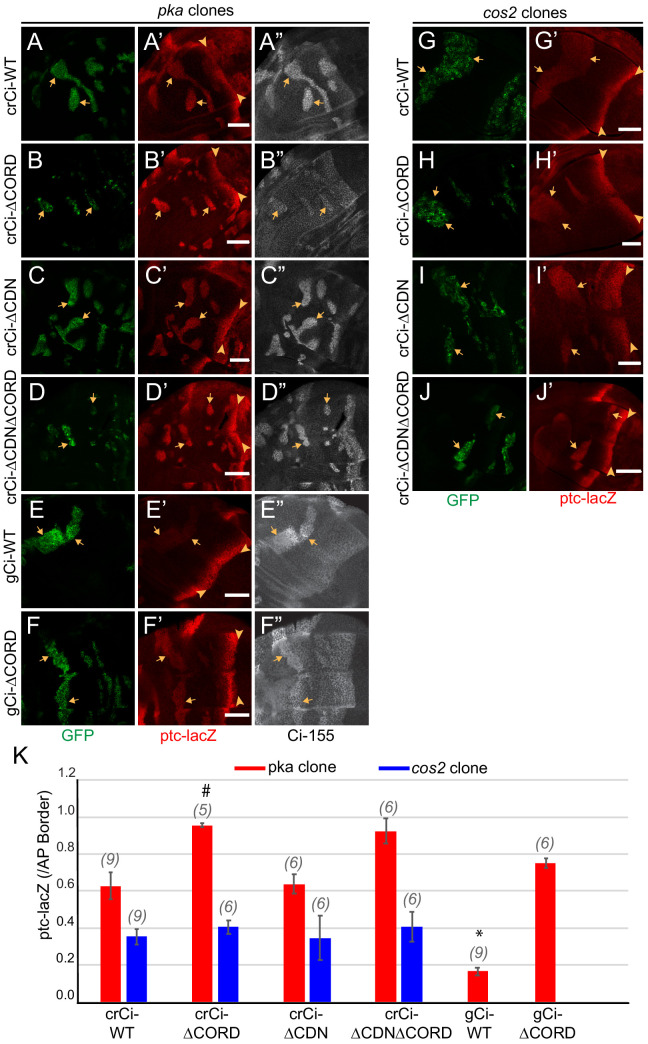
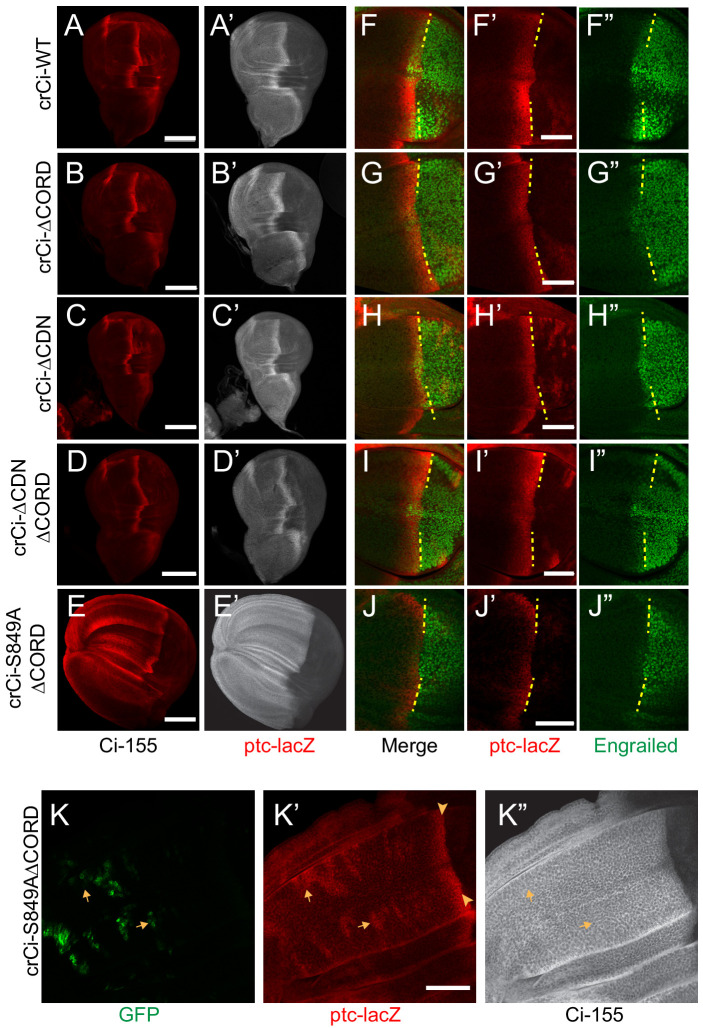
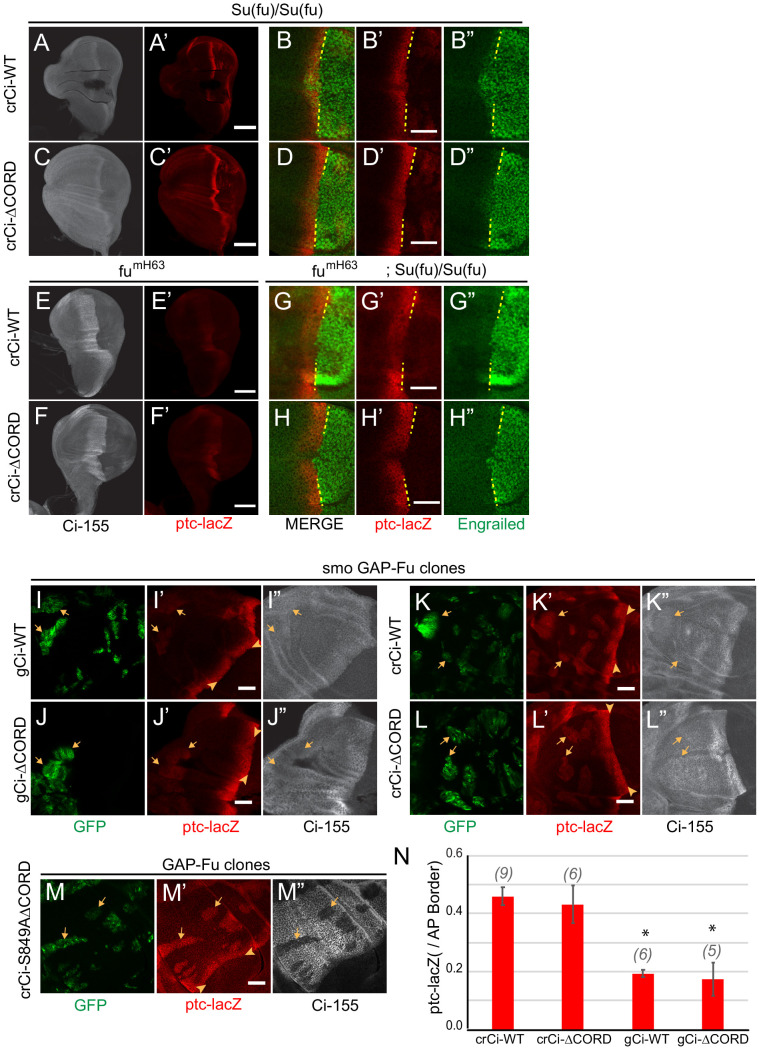
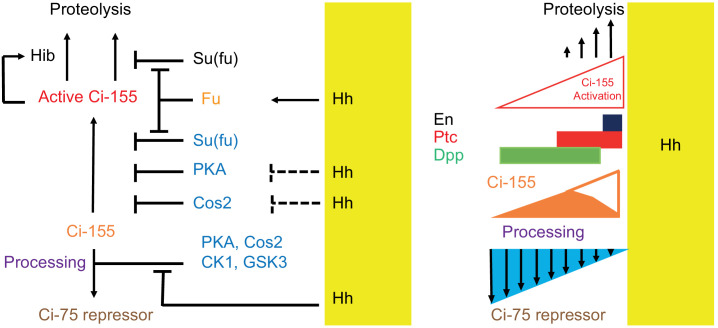
Extracellular Hedgehog (Hh) proteins induce transcriptional changes in target cells by inhibiting the proteolytic processing of full-length Drosophila Ci or mammalian Gli proteins to nuclear transcriptional repressors and by activating the full-length Ci or Gli proteins. We used Ci variants expressed at physiological levels to investigate the contributions of these mechanisms to dose-dependent Hh signaling in Drosophila wing imaginal discs. Ci variants that cannot be processed supported a normal pattern of graded target gene activation and the development of adults with normal wing morphology, when supplemented by constitutive Ci repressor, showing that Hh can signal normally in the absence of regulated processing. The processing-resistant Ci variants were also significantly activated in the absence of Hh by elimination of Cos2, likely acting through binding the CORD domain of Ci, or PKA, revealing separate inhibitory roles of these two components in addition to their well-established roles in promoting Ci processing.

Keywords: Ci; D. melanogaster; Protein Kinase A; cell biology; costal 2; developmental biology; hedgehog; morphogen; signaling.

Plain language summary

Morphogens play a crucial role in determining how cells are organized in developing organisms. These chemical signals act over a wide area, and the amount of signal each cell receives typically initiates a sequence of events that spatially pattern the multiple cells of an organ or tissue. One of the most well-studied groups of morphogens are the hedgehog proteins, which are involved in the development of many animals, ranging from flies to humans. In fruit flies, hedgehog proteins kickstart a cascade of molecular changes that switch on a set of 'target' genes. They do this by ultimately altering the activity of a protein called cubitus interruptus, which comes in two lengths: a long version called Ci-155 and a short version called Ci-75. When hedgehog is absent, Ci-155 is kept in an inactive state in the cytoplasm, where it is slowly converted into its shorter form, Ci-75: this repressor protein is then able to access the nucleus, where it switches ‘off’ the target genes. However, when a hedgehog signal is present, the processing of Ci into its shorter form is inhibited. Instead, Ci-155 becomes activated by a separate mechanism that allows the long form protein to enter the nucleus and switch ‘on’ the target genes. But it was unclear whether hedgehog requires both of these mechanisms in order to act as a morphogen and regulate the activity of developmental genes. To answer this question, Little et al. mutated the gene for Ci in the embryo of fruit flies, so that the Ci-155 protein could no longer be processed into Ci-75. Examining the developing wings of these flies revealed that the genes targeted by hedgehog are still activated in the correct pattern. In some parts of the wing, Ci-75 is required to switch off specific sets of genes. But when Little et al. blocked these genes, by adding a gene that constantly produces the Ci repressor in the presence or absence of hedgehog, the adult flies still developed normally structured wings. This suggests that hedgehog does not need to regulate the processing of Ci-155 into Ci-75 in order to perform its developmental role. Previous work showed that when one of the major mechanisms used by hedgehog to activate Ci-155 is blocked, fruit flies are still able to develop normal wings. Taken together with the findings of Little et al., this suggests that the two mechanisms induced by hedgehog can compensate for each other, and independently regulate the development of the fruit fly wing. These mechanisms, which are also found in humans, have been linked to birth defects and several common types of cancer, and understanding how they work could help the development of new treatments.


Conflict of interest statement

JL, EG, AS, DK No competing interests declared

Figures

Figure 1.
Figure 1.. Wild-type genomic ci transgene and CRISPR ci alleles are fully functional.
(A) The ‘genomic Ci’ transgene (gCi) was derived from a 16 kb genomic region of ci cloned into an att-Pacman vector and inserted at att ZH-86FB located at 86F on the third chromosome. It includes a 6.7 kb upstream promoter region, exons1-6 (blue boxes), introns (blue line), and 0.7 kb of the 3’UTR. (A’–A”) CRISPR ci (crCi) alleles were generated in two rounds. (A’) The first round inserted a mini-white gene (pink box) into the first intron of endogenous ci using two guide RNAs (orange) in the first intron and altered PAM sites on the donor template (green star). (A”) The second round replaced intron 1 and exons 2–6 (blue lines and boxes) including the mini-white gene; the donor template had mutated PAM sites (purple stars) corresponding to the gRNA4 site, approximately 30 bp outside the mutated PAM site for gRNA1, and in the 3’UTR 5 kb away from gRNA 2, labeled gRNA 3. (B–E) Third instar wing discs showing ptc-lacZ reporter gene expression, visualized by Beta-galactosidase antibody staining (red), with the posterior edge of AP border expression marked by yellow arrowheads, and (B’–E’) full-length Ci-155, visualized by 2A1 antibody staining (gray-scale). Anterior is left and ventral is up. (B) Two copies and (D) one copy of crCi-WT, or (C) one copy of gCi-WT supported normal patterns of elevated ptc-lacZ and Ci-155 at the AP border but (D, E, I’) sporadic ectopic posterior ptc-lacZ expression (white arrows) was seen whenever a single ci94 allele was present, even (E) in discs with no synthetic ci transgene or allele (Dp[y+] has wild-type ci). (F–I) Induction of En (green) at the AP border was detected by using the posterior boundary (yellow dashed line) of ptc-lacZ (red) to distinguish anterior (left) from posterior compartment cells, which express En independent of Hh signaling. En induction was normal in the presence of (F) two copies of cr-Ci-WT, (H) one copy of crCi-WT or (I) one wild-type ci allele and (G) was slightly reduced in the presence of one copy of gCi-WT. Scale bars are (B–E) 100 μm and (F–I) 40 μm.
Figure 2.
Figure 2.. Processing-resistant Ci variants reveal the gradients of Hh-stimulated Ci-155 degradation and Hh inhibition of Ci-155 processing.
(A–J) ptc-lacZ (red) and (A’–J’) Ci-155 (gray-scale) in wing discs with one copy of the indicated crCi alleles (with ci94) at (A–F) low (20x objective) and (G–J) high (63x objective) magnification, with AP boundary (dotted yellow line at posterior ptc-lacZ boundary). Scale bars are (A–F) 100 μm and (G–J) 40 μm. (G”–J”) Intensity profiles for ptc-lacZ (red) and Ci-155 (black) from anterior (left) to posterior. Vertical lines indicate ptc-lacZ peak (green), initial rise (orange) and 50% increase to peak (brown). Profiles are from two wing discs for crCi-Δ1270–1370 and three discs for all other samples, aligned and measured as described in Materials and methods. Note that the green line corresponding to maximal ptc-lacZ effectively represents the AP compartment boundary. The profile of ptc-lacZ posterior to that location does not decline precipitously but the decline is not informative (it likely results in part because the columnar cells are not uniformly shaped, so that the measured z-sections include portions of anterior and posterior cells). Territory posterior to the ptc-lacZ peak has yellow shading in (G”–J”) and (K, L) to indicate that it does not contain useful information. The profiles of ptc-lacZ and Ci-155 that report responses to Hh are in the territory anterior to the ptc-lacZ peak. (K) Normalized Ci-155 profiles for indicated crCi alleles derived from G’-J’ but with a smoothing function that calculates average intensity for five successive locations centered on each x-axis location. Arrows indicated locations of ptc-lacZ initial rise, 50% increase and peak for crCi-WT discs. (L) ptc-lacZ (red) and Ci-155 (black) smoothened profiles for crCi-WT, with red guide lines for locations of initial rise, 50% increase and peak ptc-lacZ. The difference between the average Ci-155 intensity for Ci-P(1-3)A and Ci-S849A at each point along the x-axis was subtracted from the maximum Ci-155 intensity for those genotypes (observed in cells anterior to the AP border) to calculate values for Hh-stimulated Ci-155 reduction. These values were added to the Ci-WT Ci-155 profile at each location to produce the blue curve, representing Ci-155 levels in the absence of Hh-stimulated reduction. Blue guide lines show the locations where inferred Ci-155 processing is first inhibited, 50% inhibited, and fully inhibited. See also Figure 2—figure supplement 1 and Figure 2—figure supplement 2.
Figure 2—figure supplement 1.
Figure 2—figure supplement 1.. Loss of Hib binding sites does not greatly affect Ci-155 activity or Hh-stimulated proteolysis.
(A–F) ptc-lacZ (red) and Ci-155 (black) intensity profiles for wing discs expressing one copy of the designated ci transgene or alleles from Figure 2A–F. Profiles are from three wing discs for all samples, aligned and measured as described in Materials and methods. (G–K) ptc-lacZ (red) and (G’–K’) Ci-155 (gray-scale) in wing discs with one copy of the indicated crCi alleles (with ci94) and (J, K) homozygous loss of Su(fu) at high (63x objective) magnification, with AP boundary (dashed yellow line at posterior ptc-lacZ boundary). Scale bars are (G–K) 40 μm. (L, M) Intensity profiles for (L) Ci-155 and (M) ptc-lacZ for crCi-WT and crCi-S3-5 in the presence (black and red, respectively) or absence (gray and green, respectively) of Su(fu). Arrows in (L) indicate the locations of ptc-lacZ initial rise (orange), 50% increase (brown) and peak (green) for crCi-WT discs. Note that the green arrow corresponding to maximal ptc-lacZ effectively represents the AP compartment boundary. Thus, the profiles of ptc-lacZ and Ci-155 that report responses to Hh are in the territory anterior to the ptc-lacZ peak; territory posterior to the ptc-lacZ peak has yellow shading to indicate that it does not contain useful information. (N, O) Anterior En (green) induction, revealed by ptc-lacZ (red) marking of the AP boundary (yellow line) extended further anterior for (N) crCi-WT than (O) crCi-S3-5. Scale bars 40 μm. (P) ptc-lacZ intensity profiles (from Figure 2G”–J”) for crCi-P(1-3)A (green), crCi-S849A (red) and crCi-WT (black) were overlapping, while ptc-lacZ induction was much lower for crCi-Δ1270–1370 (gray).
Figure 2—figure supplement 2.
Figure 2—figure supplement 2.. Processing-resistant Ci-155 induces ectopic dpp expression and anterior disc expansions are suppressed by adding a constitutive Ci repressor.
(A, B) Wing discs with gCi-S849A and no other source of functional Ci (B) induced ectopic anterior dpp-lacZ (gray-scale) in addition to the AP border stripe but (A) ectopic dpp-lacZ expression is suppressed by a wild-type ci allele (on the Dp[y+] chromosome). (C, D) Wing discs with one copy of (C) gCi-WT or (D) gCi-S849A have similar expression of ptc-lacZ (red) confined to the AP border (at a lower level than in wing discs without ciCe) and normal morphology in the presence of a ci allele that produces constitutive Ci repressor (ciCe). 2A1 antibody staining (gray-scale) is high throughout the anterior in both cases because the ciCe product includes the 2A1 epitope and does not undergo regulated processing. (E) Wing discs with anterior clones (GFP, green, yellow arrows) that have lost a second chromosome gCi transgene, leaving one copy of the crCi allele as a source of Ci. ptc-lacZ was not detected in clones expressing Ci∆1270–1370 (arrows), in contrast to the AP border (arrowheads). (F) Anterior En was much reduced for Ci∆1270–1370 in wing discs expressing one copy of the crCi allele as the only source of Ci. Scale bars (A–D) 100 μm and (E, F) 40 μm.
Figure 3.
Figure 3.. Processing-resistant Ci variants support normal Hh signaling and wing patterning (A–C) Wing discs with one copy of indicated crCi alleles.
ptc-lacZ (red) indicates the AP compartment boundary (yellow line) to reveal induction of the high-level Hh target gene En (green) in anterior cells at the AP border. (D–F) Wing discs with anterior clones (GFP, green, yellow arrows) that have lost a second chromosome gCi transgene, leaving one copy of the indicated crCi alleles as a source of Ci. (D’–F’) Little (E’) or no (D’, F’) ptc-lacZ induction was observed in the clones (arrows) relative to the AP border (arrowheads). Scale bars are (A–F) 40 μm. (G–L) Wings from adult flies with the indicated ci transgenes and alleles (ciCe encodes a constitutive repressor). The spacing between veins 3 and 4 is (J–L) normal for two copies of WT or S849A ci alleles and (G–I) similarly reduced for one copy of WT or S849A alleles. At least five high-quality mounted wings were examined for each genotype. Scale bars are (G–I) 500 μm.
Figure 4.
Figure 4.. Activation by Fused kinase is enhanced by blocking Ci-155 processing.
(A–I) Wing discs from animals with one copy of the designated ci transgenes and alleles (together with ci94) with clones (GFP, green, arrows) that express UAS-GAP-Fu and (A–E) lack smo activity or (F–I) are heterozygous for smo (arrowheads indicate AP border), showing (A’–I’) ptc-lacZ (red) and (A”–I”) Ci-155 (gray-scale). (A”–I”) Ci-155 levels were much reduced in clones whenever pathway activity was strongly induced (A”, B”, D”, F”, G”). Scale bars are 40 μm. (J, K) Average intensity of ptc-lacZ in clones (red), Ci-155 in clones (green) or neighboring anterior territory (blue), as a fraction of AP border levels for (J) smo GAP-Fu clones and (K) GAP-Fu clones. Mean and SEM shown. Significant differences between values for a given genotype compared to those for crCi-WT, calculated by paired t-tests, are indicated for p<0.001 (*) and p<0.05 (#). Additionally, in (J) ptc-lacZ was significantly increased for gCi-S849A versus gCi-WT (p<0.0001), as was the anterior level of Ci-155 (p<0.0001).
Figure 5.
Figure 5.. PKA and Cos2 reduce the activity of Ci-155 that is not processed.
(A–K) Wing discs from animals with one copy of the designated ci transgenes and alleles (together with ci94) with clones (GFP, green, arrows) that lack (A–G) pka activity or (H–K) cos2 activity (arrowheads indicate AP border), showing (A’–K’) ptc-lacZ (red) and (A”, C”–K”) Ci-155 (gray-scale). (B”) En (gray-scale) was weakly induced in pka clones from discs expressing Ci-P(1-3)A. Ci-155 levels were (A”, F”, H”) increased relative to neighboring anterior territory for Ci-WT but were (C”–E”, G”, I”–K”) either unchanged or slightly reduced, presumably from full proteolysis, for processing-resistant Ci variants. Scale bars are 40 μm. (L) Average intensity of ptc-lacZ in pka clones (red) or neighboring anterior territory (pink), and in cos2 clones (dark blue) or neighboring anterior territory (light blue), as a fraction of AP border levels. Mean and SEM shown. Significant differences between ptc-lacZ values in pka or cos2 mutant clones and neighboring anterior pka/+ or cos2/+ cells for a given genotype, calculated by paired t-tests, are indicated for p<0.001 (*) and p<0.05 (#).
Figure 6.
Figure 6.. Cos2 reduces Ci-155 activity by binding to the CORD region.
(A–J) Wing discs from animals with one copy of the designated ci transgenes and alleles (together with ci94) with clones (GFP, green, arrows) that lack (A–F) pka activity or (G–J) cos2 activity (arrowheads indicate AP border), showing (A’–J’) ptc-lacZ (red) and (A”–F”) Ci-155 (gray-scale). (A”–F”) Ci-155 levels were increased relative to neighboring anterior territory for all Ci proteins, but the increase was relatively small for (B”) Ci-ΔCORD, suggesting that processing outside the clones may be inefficient. By contrast, a large change was observed for Ci-ΔCDNΔCORD, suggesting very efficient processing. Scale bars are 40 μm. (K) Average intensity of ptc-lacZ in pka clones (red) and in cos2 clones (blue), as a fraction of AP border levels. Mean and SEM shown. Significant differences between values for a given genotype compared to those for crCi-WT, calculated by paired t-tests, are indicated for p<0.001 (*) and p<0.05 (#). Additionally, ptc-lacZ was significantly increased for gCi-ΔCORD versus gCi-WT in pka mutant clones (p<0.0001).
Figure 7.
Figure 7.. Loss of both Cos2 inhibition and processing combine to activate Ci-155.
(A–J) Wing discs from animals with one copy of the designated ci alleles (together with ci94), have (A–D) no ectopic anterior ptc-lacZ (red) unless (E) both the CORD domain is removed and processing blocked (by the S849A alteration). (A’–E’) Ci-155 (gray-scale) in the same wing discs. (F–J) Anterior En (green) induction, revealed by marking the AP compartment boundary (yellow lines) with the posterior extent of ptc-lacZ (red), was reduced for Ci variants (G, J) lacking the CORD domain, (J) especially together with the S849A alteration. (K) Wing disc with anterior clones (GFP, green, yellow arrows) that have lost a second chromosome gCi transgene, leaving one copy of crCi-S849AΔCORD as the only source of Ci, showing (K’) ptc-lacZ induction in the clones (arrows) to levels similar to the AP border (arrowheads); (K”) Ci-155 (gray-scale) is uniformly high because of blocked processing. Scale bars are (A–J) 40 μm. See also Figure 7—figure supplement 1.
Figure 7—figure supplement 1.
Figure 7—figure supplement 1.. Reduced AP border activity of Ci lacking the CORD domain.
(A–H) Wing discs expressing one copy of crCi-WT or crCi-ΔCORD as the only source of Ci, showing (A, C, E, F) Ci-155 (gray-scale), (B, D, G, H, A’–H’) ptc-lacZ (red) or (B, D, G, H, B”, D”, G”, H”) En (green) and AP compartment boundary (yellow line). Reduced En induction by Ci-ΔCORD was (B, D) not restored to normal by loss of Su(fu). (E–H) Loss of Fu kinase activity in fumH63 wing discs produced (E, F) similarly strong, broad Ci-155 at the AP border and (E’, F’) drastic reduction of ptc-lacZ for Ci-WT and Ci-ΔCORD, while (G, H) additional loss of Su(fu) restored ptc-lacZ without anterior En in both cases. (I–L) induction of ptc-lacZ (red) in smo mutant clones (green, arrows) expressing GAP-Fu was similar for Ci-WT and Ci-ΔCORD encoded by either (I, J) gCi transgenes or (K, L) crCi alleles and was much lower than at the AP border (arrowheads) in all cases, as presented graphically in (N). (M, M’) Much higher ptc-lacZ (red), matching AP border levels (arrowheads) were observed in GAP-Fu clones (green, arrows) expressing processing-resistant Ci-S849AΔCORD, accompanied by (M”) significant Ci-155 (gray-scale) proteolysis. (N) Average intensity of ptc-lacZ in clones as a fraction of AP border levels. Significant differences between values for a given genotype compared to those for crCi-WT, calculated by paired t-tests, are indicated for p<0.001 (*). There was no significant difference (p<0.05) for gCi-ΔCORD versus gCi-WT. Scale bars are (A, C, E, F) 100 μm and (D, G, H, I–M) 40 μm.
Figure 8.
Figure 8.. Summary of graded processing, activation, and proteolysis of Ci-155 and underlying mechanisms at the AP border.
At the AP border, Hh (emanating from posterior, mustard yellow, territory) inhibits Ci-155 processing stimulated by Cos2, PKA, CK1, and GSK3, and activates Fu protein kinase activity to activate Ci-155, overcoming inhibition by Su(fu) and other factors. Hh also promotes a reduction of Ci-155 levels, most likely by promoting full Ci-155 proteolysis through induction of Rdx/Hib or reducing Su(fu) association. Here we used processing-resistant Ci variants to show that PKA and Cos2 (through binding the CORD domain on Ci-155) limit Ci-155 activity in anterior cells (left) and (right) to deduce the spatial profiles of Hh-stimulated Ci-155 reduction (‘proteolysis’, upward arrows) and inhibition of Ci-155 processing (downward arrows, blue triangle) at the AP border that underlie steady-state Ci-155 levels (brown). Graded target gene (En, Ptc, Dpp) activation is normally elicited by a combination of activated Ci-155 and Ci-75 repressor but was still observed when there was no regulation of Ci-155 processing, indicating that Ci-155 activation must be graded. Although graded Hh signaling was observed when Ci-155 processing is not regulated, Ci-75 repressor must be present in anterior cells to prevent ectopic dpp expression and inhibition of processing was shown to be important for activated Fu to induce high levels of ptc expression. Thus, Hh normally elicits graded inhibition of Ci-155 processing and graded activation of full-length Ci-155 but the activation gradient can suffice provided there is some repressor in anterior cells and Ci-155 is substantially spared from processing at the AP border.

Similar articles

Cited by

References

    1. Alves G, Limbourg-Bouchon B, Tricoire H, Brissard-Zahraoui J, Lamour-Isnard C, Busson D. Modulation of hedgehog target gene expression by the fused serine-threonine kinase in wing imaginal discs. Mechanisms of Development. 1998;78:17–31. doi: 10.1016/S0925-4773(98)00130-0. - DOI - PubMed
    1. Anderson E, Peluso S, Lettice LA, Hill RE. Human limb abnormalities caused by disruption of hedgehog signaling. Trends in Genetics. 2012;28:364–373. doi: 10.1016/j.tig.2012.03.012. - DOI - PubMed
    1. Aza-Blanc P, Ramírez-Weber FA, Laget MP, Schwartz C, Kornberg TB. Proteolysis that is inhibited by hedgehog targets cubitus interruptus protein to the nucleus and converts it to a repressor. Cell. 1997;89:1043–1053. doi: 10.1016/S0092-8674(00)80292-5. - DOI - PubMed
    1. Biehs B, Kechris K, Liu S, Kornberg TB. Hedgehog targets in the Drosophila embryo and the mechanisms that generate tissue-specific outputs of hedgehog signaling. Development. 2010;137:3887–3898. doi: 10.1242/dev.055871. - DOI - PMC - PubMed
    1. Blair SS. Engrailed expression in the anterior lineage compartment of the developing wing blade of Drosophila. Development. 1992;115:21–33. - PubMed

Publication types

MeSH terms

LinkOut - more resources