

Hospitalization Rates and Causes Among Persons With HIV in the United States and Canada, 2005-2015
- PMID: 33084891
- PMCID: PMC8205637
- DOI: 10.1093/infdis/jiaa661
Hospitalization Rates and Causes Among Persons With HIV in the United States and Canada, 2005-2015
Abstract
Background: To assess the possible impact of antiretroviral therapy improvements, aging, and comorbidities, we examined trends in all-cause and cause-specific hospitalization rates among persons with HIV (PWH) from 2005 to 2015.
Methods: In 6 clinical cohorts, we followed PWH in care (≥1 outpatient CD4 count or HIV load [VL] every 12 months) and categorized ICD codes of primary discharge diagnoses using modified Clinical Classifications Software. Poisson regression estimated hospitalization rate ratios for calendar time trends, adjusted for demographics, HIV risk factor, and annually updated age, CD4, and VL.
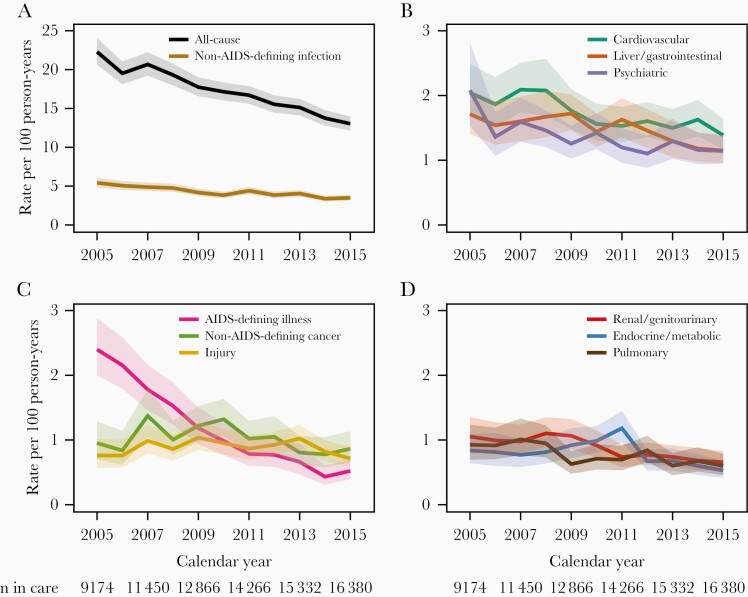
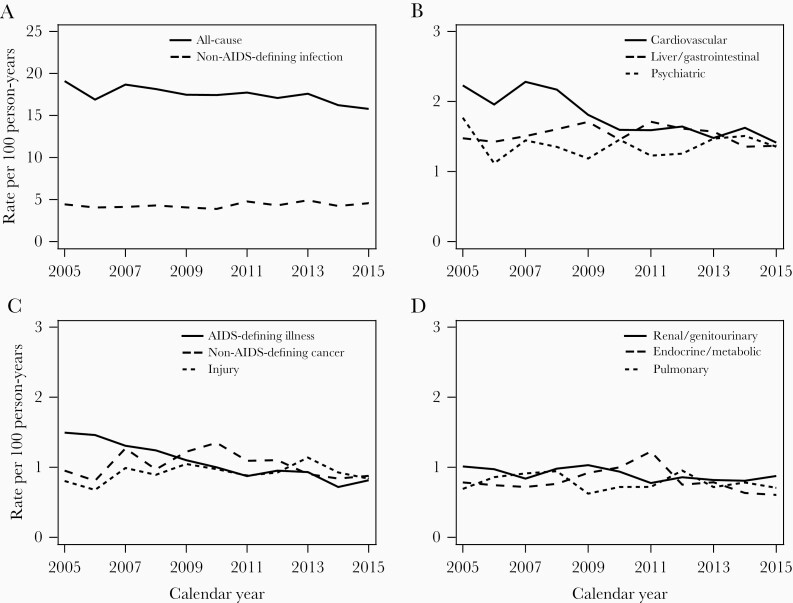
Results: Among 28 057 patients (125 724 person-years), from 2005 to 2015, the median CD4 increased from 389 to 580 cells/µL and virologic suppression from 55% to 85% of patients. Unadjusted all-cause hospitalization rates decreased from 22.3 per 100 person-years in 2005 (95% confidence interval [CI], 20.6-24.1) to 13.0 in 2015 (95% CI, 12.2-14.0). Unadjusted rates decreased for almost all diagnostic categories. Adjusted rates decreased for all-cause, cardiovascular, and AIDS-defining conditions, increased for non-AIDS-defining infection, and were stable for most other categories.
Conclusions: Among PWH with increasing CD4 counts and viral suppression, unadjusted hospitalization rates decreased for all-cause and most cause-specific hospitalizations, despite the potential effects of aging, comorbidities, and cumulative exposure to HIV and antiretrovirals.
Keywords: HIV; cohort studies; hospitalization.
Published by Oxford University Press for the Infectious Diseases Society of America 2020.
Figures
References
-
- Thompson MA, Aberg JA, Hoy JF, et al. Antiretroviral treatment of adult HIV infection: 2012 recommendations of the International Antiviral Society-USA panel. JAMA 2012; 308:387–402. - PubMed
-
- Centers for Disease Control and Prevention. HIV among people aged 50 and over. https://www.cdc.gov/hiv/group/age/olderamericans/index.html. Accessed 12 June 2019.
Publication types
MeSH terms
Substances
Grants and funding
- F31 DA037788/DA/NIDA NIH HHS/United States
- K24 DA000432/DA/NIDA NIH HHS/United States
- CBR-94036/CIHR/Canada
- HCP-97105/CIHR/Canada
- U01 HL146241/HL/NHLBI NIH HHS/United States
- TGF-96118/CIHR/Canada
- U01 HL146193/HL/NHLBI NIH HHS/United States
- P30 AI050409/AI/NIAID NIH HHS/United States
- N01 CP001004/CP/NCI NIH HHS/United States
- KL2 TR000421/TR/NCATS NIH HHS/United States
- R01 DA012568/DA/NIDA NIH HHS/United States
- U01 AA020790/AA/NIAAA NIH HHS/United States
- U01 AI068636/AI/NIAID NIH HHS/United States
- P30 MH062246/MH/NIMH NIH HHS/United States
- U10 EY008057/EY/NEI NIH HHS/United States
- U01 DA036935/DA/NIDA NIH HHS/United States
- Z01 CP010176/ImNIH/Intramural NIH HHS/United States
- U01 AI038855/AI/NIAID NIH HHS/United States
- U01 HL146194/HL/NHLBI NIH HHS/United States
- U01 AI069432/AI/NIAID NIH HHS/United States
- R01 AG053100/AG/NIA NIH HHS/United States
- F31 AI124794/AI/NIAID NIH HHS/United States
- U01 HL146202/HL/NHLBI NIH HHS/United States
- U24 AA020794/AA/NIAAA NIH HHS/United States
- G12 MD007583/MD/NIMHD NIH HHS/United States
- UL1 TR001863/TR/NCATS NIH HHS/United States
- U10 EY008052/EY/NEI NIH HHS/United States
- U01 HL146245/HL/NHLBI NIH HHS/United States
- U01 AA013566/AA/NIAAA NIH HHS/United States
- U01 HL146205/HL/NHLBI NIH HHS/United States
- U10 EY008067/EY/NEI NIH HHS/United States
- K01 AI093197/AI/NIAID NIH HHS/United States
- U54 MD007587/MD/NIMHD NIH HHS/United States
- P30 AI027767/AI/NIAID NIH HHS/United States
- U01 HL146333/HL/NHLBI NIH HHS/United States
- U01 HL146240/HL/NHLBI NIH HHS/United States
- U01 AI038858/AI/NIAID NIH HHS/United States
- R01 DA011602/DA/NIDA NIH HHS/United States
- K24 AI065298/AI/NIAID NIH HHS/United States
- U01 HL146242/HL/NHLBI NIH HHS/United States
- P30 AI027757/AI/NIAID NIH HHS/United States
- UM1 AI068634/AI/NIAID NIH HHS/United States
- K24 AI118591/AI/NIAID NIH HHS/United States
- P30 AI110527/AI/NIAID NIH HHS/United States
- T32 AI007001/AI/NIAID NIH HHS/United States
- U01 HL146204/HL/NHLBI NIH HHS/United States
- U01 AI069434/AI/NIAID NIH HHS/United States
- U01 HL146192/HL/NHLBI NIH HHS/United States
- UL1 TR000083/TR/NCATS NIH HHS/United States
- P30 AI027763/AI/NIAID NIH HHS/United States
- R01 AA016893/AA/NIAAA NIH HHS/United States
- CBR-86906/CIHR/Canada
- U01 HL146208/HL/NHLBI NIH HHS/United States
- T32 DA007250/DA/NIDA NIH HHS/United States
- KL2 TR002317/TR/NCATS NIH HHS/United States
- U01 HL146201/HL/NHLBI NIH HHS/United States
- K01 AI131895/AI/NIAID NIH HHS/United States
- U01 AI069918/AI/NIAID NIH HHS/United States
- U01 HL146203/HL/NHLBI NIH HHS/United States
- K23 EY013707/EY/NEI NIH HHS/United States
- P30 AI094189/AI/NIAID NIH HHS/United States
- UL1 TR000004/TR/NCATS NIH HHS/United States
- P30 AI036219/AI/NIAID NIH HHS/United States
- P30 AI050410/AI/NIAID NIH HHS/United States
- U01 AI068634/AI/NIAID NIH HHS/United States
- R24 AI067039/AI/NIAID NIH HHS/United States
