. 2020 Nov 18;48(20):11408-11420.
doi: 10.1093/nar/gkaa852.

Mechanisms coordinating ribosomal protein gene transcription in response to stress

Affiliations

Mechanisms coordinating ribosomal protein gene transcription in response to stress

Sevil Zencir et al. Nucleic Acids Res. .

Abstract

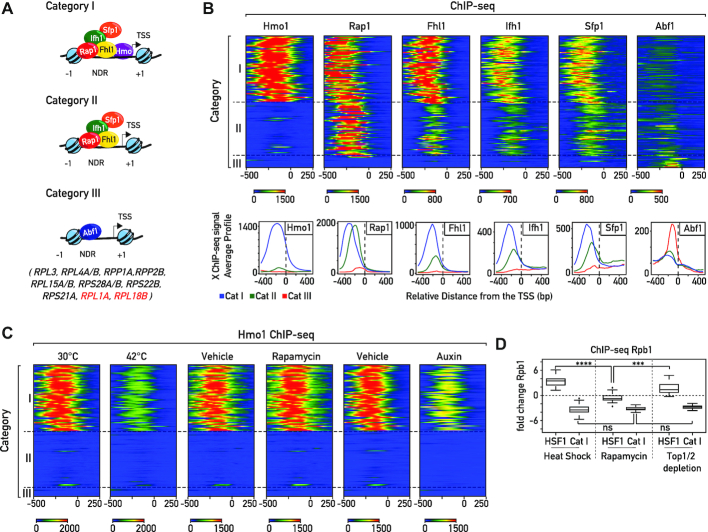
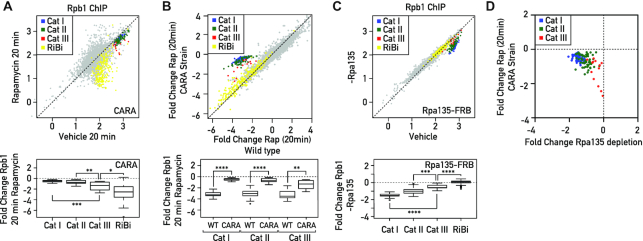
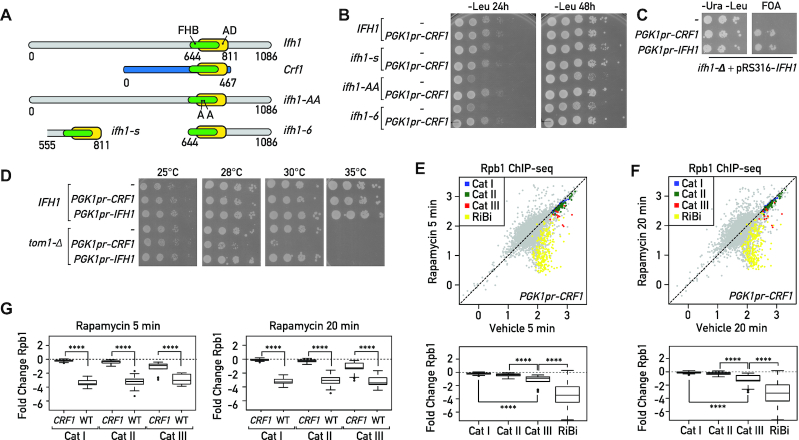
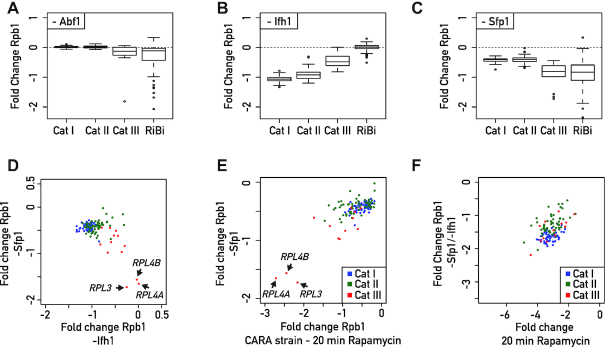
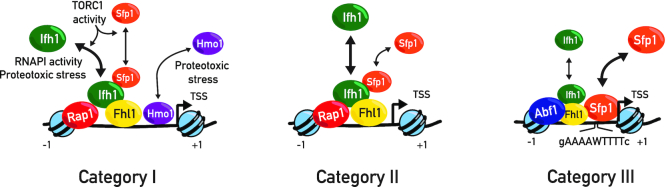
While expression of ribosomal protein genes (RPGs) in the budding yeast has been extensively studied, a longstanding enigma persists regarding their co-regulation under fluctuating growth conditions. Most RPG promoters display one of two distinct arrangements of a core set of transcription factors (TFs) and are further differentiated by the presence or absence of the HMGB protein Hmo1. However, a third group of promoters appears not to be bound by any of these proteins, raising the question of how the whole suite of genes is co-regulated. We demonstrate here that all RPGs are regulated by two distinct, but complementary mechanisms driven by the TFs Ifh1 and Sfp1, both of which are required for maximal expression in optimal conditions and coordinated downregulation upon stress. At the majority of RPG promoters, Ifh1-dependent regulation predominates, whereas Sfp1 plays the major role at all other genes. We also uncovered an unexpected protein homeostasis-dependent binding property of Hmo1 at RPG promoters. Finally, we show that the Ifh1 paralog Crf1, previously described as a transcriptional repressor, can act as a constitutive RPG activator. Our study provides a more complete picture of RPG regulation and may serve as a paradigm for unravelling RPG regulation in multicellular eukaryotes.


Figures

Figure 1.
Figure 1.
Heterogeneous organization of RPG promoters. (A) Schematic representation of RPG categories according to their promoter nucleosome and transcription factor architecture. In each schema the left-most nucleosome represents the first stable -1 nucleosome, the right-most nucleosome represents the +1 nucleosome, black arrows represent the Transcription Start Site (TSS), and NDR corresponds to the nucleosome-depleted region (21,22,25–28). Genes included in Cat III (27) are reported. RPL1A and RPL18B are two peculiar cases in this group since Rap1 is detected at their promoters, though not Ifh1 and Fhl1. (B) Heat maps showing ChIP-seq signals for transcription factors Hmo1, Rap1, Fhl1, Ifh1, Sfp1 and Abf1 (from left panel to right panel) at RPG Categories I, II and III. Signals for a window of −500 to +250 bp relative to the TSS (bp) (0) are displayed (X-axis). Average Hmo1, Rap1, Fhl1, Ifh1, Sfp1, Abf1 binding profiles. Each profile is color-coded according to functional groups: Cat I (blue), Cat II (green) and Cat III (red). (C) Heat maps showing Hmo1 ChIP-seq signals at RPG promoters in cells following either 5 min of heat shock at 42°C, 20 min treatment with or without rapamycin, or rapid depletion of Top1/2 by 20 min of auxin treatment. Signals for a window of −500 to +250 bp relative to the TSS (bp) (0) are displayed (x-axis). (D) Box plots of log2 RNAPII (Rpb1) ChIP-seq change at Hsf1 target genes and Category I RPG promoters following 5 min of heat shock at 42°C (left panel), 20 min of rapamycin treatment (middle panel), or Top1/2 depletion (right panel). Asterisks show significant difference according to the Mann–Whitney test (*P< 0.05, **P< 0.01, ***P< 0.001, ns: not significant).
Figure 2.
Figure 2.
The three distinct categories of RPGs are co-regulated according to growth conditions. (A) Scatter plots (top panels) comparing RNAPII binding (as measured by Rpb1 ChIP-seq) in WT cells treated with rapamycin (Y-axis) or vehicle (X-axis) for 5 min (left panel), 20 min (middle panel) and 60 min (right panel). Each dot represents a gene (5041 in total) and genes are color-coded according to functional groups as Cat I (blue), Cat II (green) and Cat III (red) RPGs; RiBi genes (yellow); all other genes (grey). For RNAPII, the average signal was quantified from the TSS to the transcription termination site (TTS). The scale for both the X-axis and the Y-axis is log10. Bottom panels display the corresponding box plots for the four indicated gene categories. (B) Box plots showing RNAPII (Rpb1) ChIP-seq change for RPGs and RiBi genes in different growth conditions; upper panel shows the result of treatment with tunicamycin (30 min, left panel), diamide (20 min, middle panel) and glucose pulse (5 min, right panel); bottom panel shows the result of treatment with heat shock (5 min, left panel), diazaborine (20 min, middle panel) and cycloheximide (CHX, 20 min, right panel). Asterisks show significant difference according to the Mann–Whitney test (*P< 0.05, **P< 0.01, ***P< 0.001, ns: not significant).
Figure 3.
Figure 3.
Coordinated downregulation of RPGs expression is carried out by Ifh1-dependent or Ifh1-independent processes. (A) RNAPII ChIP-seq in CARA strain cells (Y-axis) versus WT cells (X-axis) following to treatment with Rapamycin for 20 min. Bottom panels display the corresponding box plots for the four indicated gene categories. (B) Fold change of RNAPII binding following 20 minutes of rapamycin treatment in CARA strain cells (Y-axis) versus fold change of RNAPII binding following 20 minutes of rapamycin treatment in WT cells (X-axis). Bottom panels display the corresponding box plots for the three indicated gene categories. (C) RNAPII ChIP-seq in Rpa135 nuclear-depleted cells (−Rpa135; Y-axis) versus non-depleted cells (Vehicle; X-axis). Bottom panels display the corresponding box plots for the four indicated gene categories. (D) Scatter plots comparing RNAPII (Rpb1) binding fold change at RPGs categories in CARA strain cells treated with Rapamycin for 20 min (Y-axis) versus Rpa135 nuclear-depleted cells. Genes are color-coded according to functional groups: Cat I (blue), Cat II (green) and Cat III (red) RPGs.
Figure 4.
Figure 4.
Crf1 is a non-regulatable activator of RPGs. (A) Schematic representation of conserved domains in full length Ifh1 and Crf1 proteins, and a series of Ifh1 point mutations S680A/S681A (ifh1-AA) or truncated alleles: an Ifh1 mutant that removes all sequences upstream of the FHB and linked activation domain (ifh1–6); an extremely short version of Ifh1 (ifh1-s) containing essentially the FHB and downstream activation domain (from top to bottom). FHB: Fork Head Binding domain, AD: Activation domain. (B) 10-fold serial dilution of wild-type (IFH1) or hypomorphic alleles of Ifh1 (ifh1-s, ifh1-AA, Ifh1–6), transformed with a plasmid bearing the CRF1 coding region under the control of the PGK promoter (pPGK1pr-CRF1) or with the empty pPGK1pr vector (−). Cells were spotted onto the indicated selective media and the plates were incubated at 30°C for 24 or 48 h. (C) A null allele (ifh1-Δ) present at the endogenous genomic locus of the haploid tester strain is complemented by the wild-type gene borne on a URA3-containing plasmid (pRS316-IFH1). Complementation is tested by examining whether plasmids expressing Crf1 (PGK1pr-CRF1) or Ifh1 (PGK1pr-CRF1) from a strong promoter bypass the lethal phenotype, as monitored by growth on FOA. The empty pPGK1pr vector (−) is used as negative control. Plates without FOA (-Ura, -Leu) are used as control to confirm that the same number of cells were spotted. Plates were incubated at 30°C for 48 h. (D) 10-fold serial dilution of wild-type (IFH1) or TOM1 deleted cells (tom1-Δ), transformed with a plasmid bearing CRF1 or IFH1 coding regions under the control of PGK promoter (pPGK1pr-CRF1 or pPGK1pr-IFH1, respectively) or with the empty pPGK1pr vector (−). Cells were spotted onto the indicated selective media and the plates were incubated at the indicated temperatures for 48 h. (E, F) Scatter plots comparing RNAPII (Rpb1) ChIP-seq in Crf1 expressing cells after 5 min (Y-axis, E) or 20 min (Y-axis, F) Rapamycin treatment to non-treated cells (Vehicle; X-axis). Bottom panels display the corresponding box plots for the four indicated gene categories. Gene groups are color-coded as indicated above. (G) Box plots comparing RNAPII (Rpb1) binding fold change at RPGs categories in CRF1 expressing and WT cells treated with rapamycin for 5 min (left panel) or 20 min (right panel). Asterisks show significant difference according to Mann-Whitney test.
Figure 5.
Figure 5.
Sfp1 and Ifh1 are directly recruited at Cat III promoters. (A) Heat maps showing MNase digestion patterns (left panel) and G/C content (right panel) at RPGs promoters. Signals for a window of −500 to +250 bp relative to the +1 nucleosome (0) are displayed (X-axis). (B) Average plots of MNase digestion patterns (upper panel) and G/C content (lower panel) at three categories of RPGs. Signals for a window of −500 to +250 bp relative to the TSS (bp) (0) are displayed (X-axis). (C) Heat maps showing Sfp1-binding motif and Sfp1 ChEC-seq signal for 150 s of Ca+2 treatment, or Ifh1 ChEC-seq signal after 150 sec of Ca+2 treatment at the indicated RPGs promoters. Control for ChEC-seq signal (free-MNase, 20 min following Ca+2 addition) is used as background control. Average plots of Ifh1, Sfp1, Free-MNase ChEC-seq signal at three categories of RPGs is also shown (lower panel). Signals for a window of −500 to +250 bp relative to the TSS (bp) (0) are displayed (X-axis). (D) Genome browser tracks comparing Sfp1-MNase, Ifh1-MNase and free MNase ChEC-seq signals (blue background) to Sfp1-TAP, Ifh1-Myc and untagged ChIP-seq read counts (yellow background) at RPS28A (Cat III) and RPS30B (Cat II) RPGs. The position of indicated RPGs promoters are shown above of the tracks. (E) Box plots of log2 ChEC-seq or ChIP-seq signal related to ChEC or ChIP control (free MNase or untagged strains) at promoters of different groups of genes (Cat I, II, III, ribosome biogenesis [RiBi] genes, others [200 randomly chosen protein-coding genes]) for Sfp1-MNase and Ifh1-MNase (ChEC-seq, blue background) or Sfp1-TAP and Ifh1-Myc (ChIP-seq, yellow background), respectively.
Figure 6.
Figure 6.
Coordinated regulation of RPGs expression is accomplished by the complementary actions of Sfp1 and Ifh1. (A–C) Box plots showing RNAPII binding change measured by Rpb1 ChIP-seq in Abf1 (A), Ifh1 (B) or Sfp1 (C) nuclear-depleted cells (calculated as log2 ratio of nuclear-depleted versus non-depleted cells) for RPGs and RiBi genes. (D–F) Scatter plots comparing RNAPII (Rpb1) binding fold change for Sfp1 nuclear-depleted cells (-Sfp1; Y-axis) versus Ifh1 nuclear-depleted cells (-Ifh1; X-axis) (D); in Sfp1 nuclear-depleted cells (-Sfp1; Y-axis) versus CARA strain cells treated with Rapamycin for 20 min (CARA; x-axis) (E); in double depletion of Ifh1 and Sfp1 (-Sfp1-Ifh1; Y-axis) versus WT cells treated with Rapamycin for 20 min (X-axis) (F). Each dot represents a gene color-coded according to functional group as above (blue: Cat I, green: Cat II, red: Cat III).
Figure 7.
Figure 7.
Schematic representation of proposed model of heterogeneous organization of RPGs promoters and their regulatory factors. All RPGs are regulated by two distinct, but complementary mechanisms driven by Sfp1 and Ifh1 that are required to coordinate RPG transcription upon stress. Category I and Category II RPG promoters contain the general regulatory factor Rap1 and the transcription factors Ifh1, Fhl1, Sfp1 at their promoters. Category I genes are in addition bound by the HMGB protein Hmo1. Category III promoters are bound by Abf1 (except for RPL1A and RPL18B) and are also regulated by Sfp1 and Ifh1. Ifh1 and Sfp1 release under various stress conditions downregulates RPG transcription. Ifh1 is specifically sensitive to proteotoxic stress, RNAPI activity, and TORC1 inactivation. Category III promoters are bound by the general regulatory factor Abf1 and at these RPGs Sfp1 is the key regulator. Ifh1 is the main regulator of Cat I and II but can also influence Cat III, whereas Sfp1 modestly affects Cat I and II but strongly regulates Cat III genes. The coordinated action of these two stress sensitive transcription factors are required to coordinate RPG promoter activity upon stress.

Similar articles

Cited by

References

    1. Lempiainen H., Shore D.. Growth control and ribosome biogenesis. Curr. Opin. Cell Biol. 2009; 21:855–863. - PubMed
    1. Warner J.R. The economics of ribosome biosynthesis in yeast. Trends Biochem. Sci. 1999; 24:437–440. - PubMed
    1. Albert B., Kos-Braun I.C., Henras A.K., Dez C., Rueda M.P., Zhang X., Gadal O., Kos M., Shore D.. A ribosome assembly stress response regulates transcription to maintain proteome homeostasis. Elife. 2019; 8:e45002. - PMC - PubMed
    1. Lam Y.W., Lamond A.I., Mann M., Andersen J.S.. Analysis of nucleolar protein dynamics reveals the nuclear degradation of ribosomal proteins. Curr. Biol. 2007; 17:749–760. - PMC - PubMed
    1. Sung M.K., Porras-Yakushi T.R., Reitsma J.M., Huber F.M., Sweredoski M.J., Hoelz A., Hess S., Deshaies R.J.. A conserved quality-control pathway that mediates degradation of unassembled ribosomal proteins. Elife. 2016; 5:e19105. - PMC - PubMed

Publication types

MeSH terms