. 2020 Nov;19(11):e13244.
doi: 10.1111/acel.13244. Epub 2020 Oct 21.

microRNA-146a controls age-related bone loss

Affiliations

microRNA-146a controls age-related bone loss

Victoria Saferding et al. Aging Cell. 2020 Nov.

Abstract

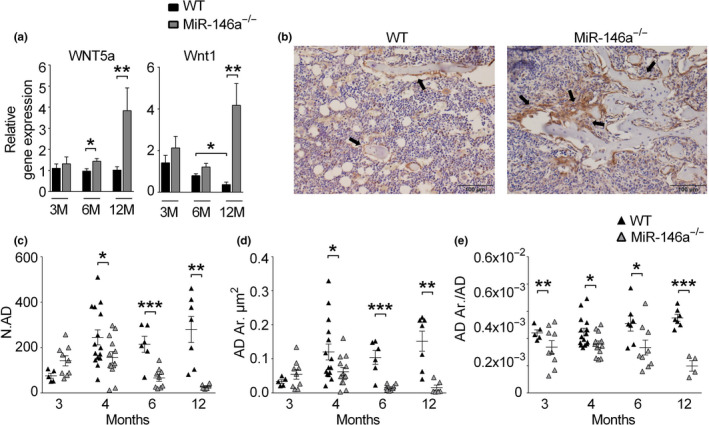
Bone loss is one of the consequences of aging, leading to diseases such as osteoporosis and increased susceptibility to fragility fractures and therefore considerable morbidity and mortality in humans. Here, we identify microRNA-146a (miR-146a) as an essential epigenetic switch controlling bone loss with age. Mice deficient in miR-146a show regular development of their skeleton. However, while WT mice start to lose bone with age, animals deficient in miR-146a continue to accrue bone throughout their life span. Increased bone mass is due to increased generation and activity of osteoblasts in miR-146a-deficient mice as a result of sustained activation of bone anabolic Wnt signaling during aging. Deregulation of the miR-146a target genes Wnt1 and Wnt5a parallels bone accrual and osteoblast generation, which is accompanied by reduced development of bone marrow adiposity. Furthermore, miR-146a-deficient mice are protected from ovariectomy-induced bone loss. In humans, the levels of miR-146a are increased in patients suffering fragility fractures in comparison with those who do not. These data identify miR-146a as a crucial epigenetic temporal regulator which essentially controls bone homeostasis during aging by regulating bone anabolic Wnt signaling. Therefore, miR-146a might be a powerful therapeutic target to prevent age-related bone dysfunctions such as the development of bone marrow adiposity and osteoporosis.

Keywords: aging; bone metabolism; microRNA; osteopetrosis; osteoporosis.


Conflict of interest statement

MH and JG are co‐founders and shareholders of TAmiRNA GmbH, and MH and MW are employed by TAmiRNA GmbH. All other authors have declared that no conflict of interest exists.

Figures

Figure 1
Figure 1
miR‐146a‐deficient mice continuously accumulate bone during aging. (a) Representative µCT images of trabecular bones from tibial WT and miR‐146a−/− animals aged 3–16 months (bar 200 µm). (b–g) Three‐dimensional reconstruction and quantitation of the indicated parameters of trabecular bone from proximal tibias of WT and miR‐146a‐deficient animals aged 3–16 months, using µCT (n ≥ 4). (h) Representative images of cortical bone from WT and miR‐146a−/− animals aged 3–16 months (bar 200 µm). (i, j) Bone morphometric analysis of the indicated parameters of cortical bone at the diaphysis of the tibia, close to the site of the intersecting fibula using µCT (n ≥ 4). (k) Von Kossa staining of histological sections, obtained from the proximal region of tibias from 6‐month‐old WT and miR‐146a−/− mice, and representative images are shown (bars 1 mm, magnification ×2.5). (l and m) Maximal torque at the femoral shaft assessed by three‐point bending and collagen mg/bone mg analyzed in femoral bone in 6‐month‐old WT and miR‐146a−/− animals (n ≥ 4). Tb.BV/TV, trabecular bone volume per tissue volume; Conn.D, connectivity density; SMI, structural model index; Tb.N, trabecular number; Tb.Th, trabecular thickness; Tb.Sp, trabecular separation; Ct.Th, cortical thickness; Ct.BV/TV, cortical bone volume per tissue volume; all data shown were obtained from female animals. *p < 0.05; **p < 0.01; ***p < 0.001. Results are shown as mean ± SEM
Figure 2
Figure 2
Osteoclast activity is not responsible for high bone mass in miR‐146a‐deficient animals. (a) Expression level of miR‐146a in femoral bone of WT animals aged from 2 to 12 months using quantitative real‐time PCR (qPCR) analysis (n ≥ 4). (b) Levels of CTX, RANKL, OPG, estradiol, P1NP, and RANKL/OPG ratio were measured in sera of 6‐month‐old WT and miR‐146a−/− mice using ELISA (n ≥ 4). (c–e) Histomorphometric analysis of tartrate‐resistant acid phosphatase (TRAP)‐stained tibial sections, N.OC, N.OC/B.Pm, and OC.S/BS of WT and miR‐146a−/− mice aged 3 to 12 months were assessed (n ≥ 5). (f) Bone marrow‐derived osteoclasts were generated and stained for TRAP 6, 7, and 8 days after bone marrow isolation, RANKL was added on days 3 and 6 (n ≥ 3). (g) Expression level of miR‐146a, RANK, and TRAF6 in bone marrow‐derived osteoclasts from 3‐month‐old WT and miR‐146a−/− animals was analyzed using qPCR. Bone marrow was isolated on day 0, and cells were cultured with MCSF over 8 days and stimulated with RANKL on days 3 and 6 (n = 4). (h) Quantification of osteoclast resorption capacity (left) of WT and miR‐146a‐deficient animals. Representative images of in vitro bone resorption assays are shown (right, bar 1 mm) (n = 8). (i) Representative µCT images of trabecular and cortical bone of 6‐month‐old WT, miR‐146a−/−, and miR‐146a−/− TRAF6+/− animals are shown (bar 200 µm). (j–p) Bone morphometric analysis of trabecular bone from proximal tibias and cortical bone at the diaphysis of the tibia (close to the site of the intersecting fibula) of 3‐ and 6‐month‐old WT, miR‐146a−/−, and miR‐146a−/− TRAF6+/− mice (n ≥ 3). N.OC, numbers of osteoclasts; N.OC/B.Pm, numbers of osteoclasts per bone perimeter; OC.S/BS, osteoclast surface per bone surface; CTX, C‐terminal telopeptide of type I collagen; RANKL, receptor activator of NF‐κB ligand; OPG, osteoprotegerin; P1NP, procollagen type 1 N‐terminal propeptide; Tb.BV/TV, trabecular bone volume per tissue volume; Conn.D, connectivity density; SMI, structural model index; Ct.Th, cortical thickness; BMD, bone mineral density; Ct.BV/TV, cortical bone volume per tissue volume; Ct. Porosity; cortical porosity; all analyses were performed in female animals. *p < 0.05; **p < 0.01; ***p < 0.001. Results are shown as mean ± SEM
Figure 3
Figure 3
Increased activity of osteoblasts in vivo in aged miR‐146a‐deficient mice. (a–c) Histomorphometric analysis of N.OB, N.OB/B.Pm, and OB.S/BS of WT and miR‐146a−/− mice aged 3–12 months of TRAP‐stained tibial sections (n ≥ 5). (d) Representative images of alkaline phosphatase (left) and Alizarin Red (right) staining of WT and miR‐146a−/− osteoblasts after 15, 21, and 26 days of osteogenic differentiation (bars 1 cm, n = 4). (e) Gene expression of OSX, RUNX2, ALP, RANKL, and OPG was measured in osteoblasts of WT and miR‐146a−/− mice after 21 days of osteogenic differentiation using qPCR (n ≥ 3). (f) Numbers of osteoclasts were analyzed in co‐cultures of either WT or miR‐146a−/− osteoblasts cultured with WT or miR‐146a‐deficient bone marrow cells, stimulated with vitamin D3 and dexamethasone for 7 days (n = 3). (g–i) WT and miR‐146a−/− animals aged 4–12 months were labeled with calcein at two time points (6 and 1 days before sacrifice), and histological sections of the proximal tibia were analyzed for S.L., Cal.A, and Cal.A/Bone A. (n ≥ 4). (j) Representative images of on Kossa (left, bars 1 mm magnification ×2,5) and calcein labeled (right, bars 100 µm magnification ×20) tibial sections of WT and miR‐146a−/− animals 6 months of age. N.OB, number of osteoblasts; N.OB/B.Pm, number of osteoblasts per bone perimeter; OB.S/BS, osteoblast surface per bone surface; OSX, osterix; ALP; alkaline phosphatase; RANKL, receptor activator of NF‐κB; OPG, osteoprotegerin; S.L, single label; Cal.A, calcein area; Cal.A/Bone A, calcein area per bone area; all data shown were generated from female animals. *p < 0.05; **p < 0.01; ***p < 0.001. Results are shown as mean ± SEM
Figure 4
Figure 4
Loss of miR‐146a increases Wnt signaling and prevents bone marrow adiposity with age. (a) Gene expression analysis of Wnt5a and Wnt1 in femoral bones of 3‐ to 12‐month‐old WT and miR‐146a−/− mice using qPCR (n ≥ 6). (b) Representative pictures of immunohistochemically stained tibial sections of 6‐month‐old WT and miR‐146a‐deficient animals using β‐catenin antibody (bars 100 µm, magnification ×20). Black arrows indicate positively stained osteoblasts at sites of bone formation. (c–e) Histomorphometric analysis of N.AD, AD. Ar, and AD. Ar/AD from histological sections of 3–12 months aged WT and miR‐146a−/− animals (n ≥ 4). N.AD, number of adipocytes; AD.Ar, adipocyte area; AD.Ar/AD, adipocyte area per adipocyte; all analyses shown were obtained from female animals. *p < 0.05; **p < 0.01; ***p < 0.001. Results are shown as mean ± SEM
Figure 5
Figure 5
Loss of miR‐146a protects from ovariectomy‐induced bone loss and is increased in patients with fragility fractures. (a) Schematic illustration of the ovariectomy‐induced bone loss experiment performed in 3‐month‐old WT and miR‐146a−/− animals. (b) Representative µCT images of tibial trabecular bones from ovariectomized WT and miR‐146a‐deficient mice (bar 200 µm). (c–e) Three‐dimensional reconstruction and quantitation of Tb.BV/TV, Conn.D., and SMI of the trabecular tibial bone from sham as well as ovariectomized WT and miR‐146a−/− mice using µCT (n ≥ 7). (f–j) Histomorphometric analysis of N.OC/B.Pm, OC.S/BS, N.OB/B.Pm, OB.S/BS, N.OB, and N.AD from TRAP‐stained sections of tibial bone (n ≥ 5). (k) miR‐146a levels were analyzed in sera of 6‐month‐old sham‐operated or ovariectomized rats treated with either vehicle, TPD, or ZOL starting 8 weeks after ovariectomy for 12 weeks, using qPCR (n ≥ 3). (l) Serum levels of miR‐146a were measured in female postmenopausal and pre‐menopausal and in male patients, control or low traumatic, using qPCR (n ≥ 10). Tb.BV/TV, trabecular bone volume per tissue volume; Conn.D., connectivity density; SMI, structural model index; N.OC/B.Pm, numbers of osteoclasts per bone perimeter; OC.S/BS, osteoclast surface per bone surface; N.OB/B.Pm, numbers of osteoblasts per bone perimeter; OB.S/BS, osteoblast surface per bone surface; N. Ad, number of adipocytes TPD, teriparatide; ZOL, zoledronate; TPM, total count per million; FX, fracture; GM, global mean (mean Cq value). All analyses shown, except I, were obtained from female animals. *p < 0.05; **p < 0.01; ***p < 0.001. Results are shown as mean ± SEM

References

    1. Bakker, E. R. M. , Raghoebir, L. , Franken, P. F. , Helvensteijn, W. , van Gurp, L. , Meijlink, F. , van der Valk, M. A. , Rottier, R. J. , Kuipers, E. J. , van Veelen, W. , & Smits, R. (2012). Induced Wnt5a expression perturbs embryonic outgrowth and intestinal elongation, but is well‐tolerated in adult mice. Developmental Biology, 369(1), 91–100. 10.1016/j.ydbio.2012.06.007 - DOI - PubMed
    1. Baron, R. , & Kneissel, M. (2013). WNT signaling in bone homeostasis and disease: From human mutations to treatments. Nature Medicine, 19(2), 179–192. 10.1038/nm.3074 - DOI - PubMed
    1. Beamer, W. G. , Donahue, L. R. , Rosen, C. J. , & Baylink, D. J. (1996). Genetic variability in adult bone density among inbred strains of mice. Bone, 18(5), 397–403. 10.1016/8756-3282(96)00047-6 - DOI - PubMed
    1. Bernstein, J. , American Academy of Orthopaedic Surgeons , American Academy of Family Physicians , & American Academy of Pediatrics (2003). Musculoskeletal medicine (1st ed.). American Academy of Orthopaedic Surgeons.
    1. Bilkovski, R. , Schulte, D. M. , Oberhauser, F. , Gomolka, M. , Udelhoven, M. , Hettich, M. M. , Roth, B. , Heidenreich, A. , Gutschow, C. , Krone, W. , & Laudes, M. (2010). Role of WNT‐5a in the determination of human mesenchymal stem cells into preadipocytes. Journal of Biological Chemistry, 285(9), 6170–6178. 10.1074/jbc.M109.054338 - DOI - PMC - PubMed

Publication types

LinkOut - more resources