. 2020 Nov 3;54(21):13690-13700.
doi: 10.1021/acs.est.0c03984. Epub 2020 Oct 21.

Comparison of Machine Learning Models for the Androgen Receptor

Affiliations

Comparison of Machine Learning Models for the Androgen Receptor

Kimberley M Zorn et al. Environ Sci Technol. .

Abstract

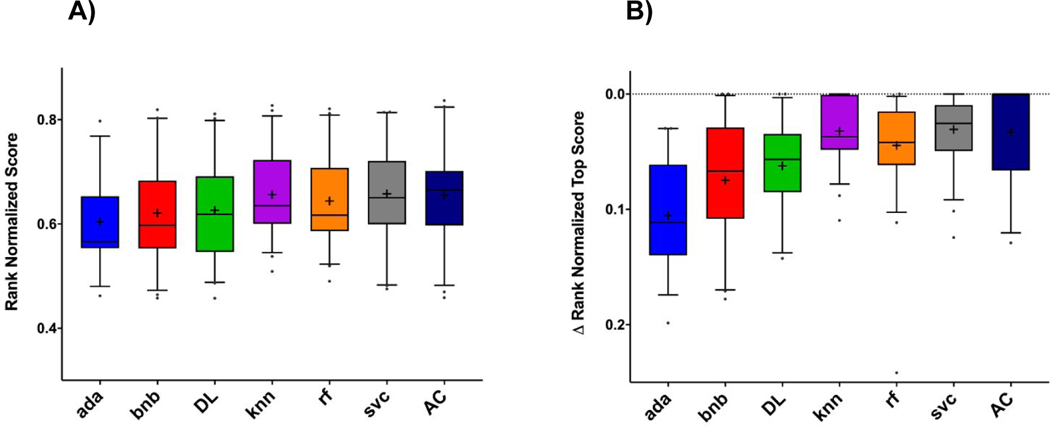
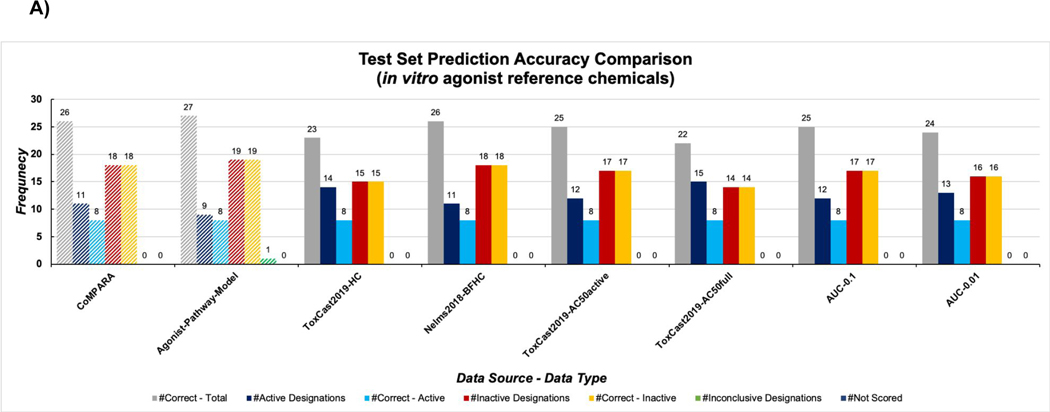
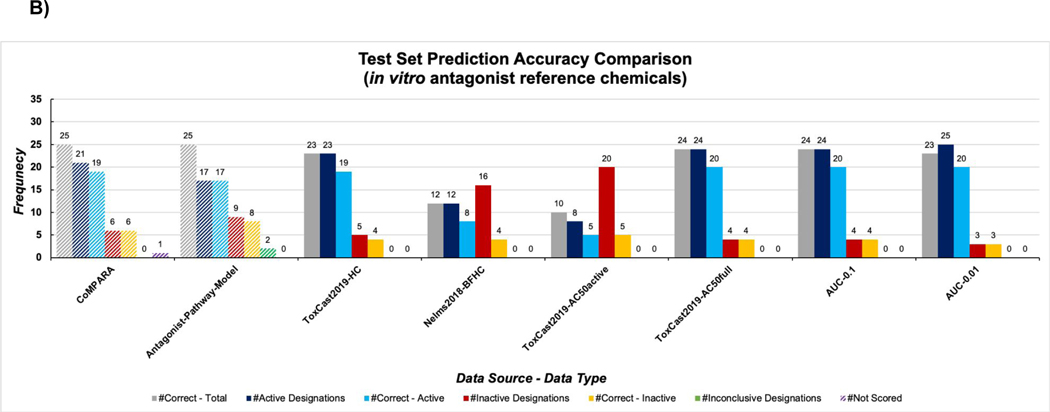
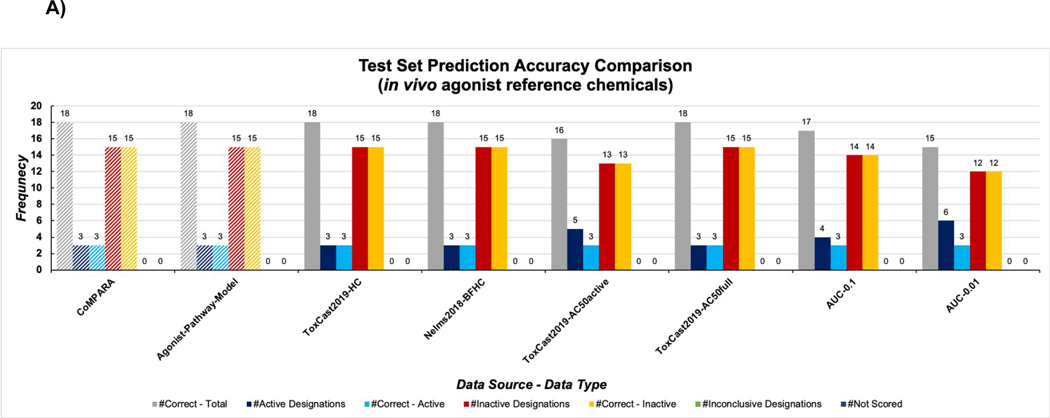
The androgen receptor (AR) is a target of interest for endocrine disruption research, as altered signaling can affect normal reproductive and neurological development for generations. In an effort to prioritize compounds with alternative methodologies, the U.S. Environmental Protection Agency (EPA) used in vitro data from 11 assays to construct models of AR agonist and antagonist signaling pathways. While these EPA ToxCast AR models require in vitro data to assign a bioactivity score, Bayesian machine learning methods can be used for prospective prediction from molecule structure alone. This approach was applied to multiple types of data corresponding to the EPA's AR signaling pathway with proprietary software, Assay Central. The training performance of all machine learning models, including six other algorithms, was evaluated by internal 5-fold cross-validation statistics. Bayesian machine learning models were also evaluated with external predictions of reference chemicals to compare prediction accuracies to published results from the EPA. The machine learning model group selected for further studies of endocrine disruption consisted of continuous AC50 data from the February 2019 release of ToxCast/Tox21. These efforts demonstrate how machine learning can be used to predict AR-mediated bioactivity and can also be applied to other targets of endocrine disruption.

Keywords: Bayesian; androgen receptor; endocrine disruption; machine learning.


Figures

Figure 1.
Figure 1.
Machine learning algorithm comparisons across multiple five-fold cross-validation metrics. A) Rank normalized scores and B) ΔRNS. Box and whisker plots show individual points for those values that fall outside of the 5–95 percentile. Abbreviations: AC = Assay Central® (Bayesian), rf = Random Forest, knn = k-Nearest Neighbors, svc = Support Vector Classification, bnb = Naïve Bayesian, ada = AdaBoosted Decision Trees, DL = Deep Learning Architecture.
Figure 2:
Figure 2:
Results for the in vitro agonist (A) and antagonist (B) test set across all machine learning model groups, in comparison to Kleinstreuer et al. and CoMPARA consensus classifications . Navy bars indicate number of chemicals classified as active by the model group, blue bars indicate the number of correctly classified active chemicals, red bars indicate the number of chemicals classified as inactive by the model group, orange bars indicate the number of correctly classified inactive chemicals, and green bar represents inconclusive scores.
Figure 2:
Figure 2:
Results for the in vitro agonist (A) and antagonist (B) test set across all machine learning model groups, in comparison to Kleinstreuer et al. and CoMPARA consensus classifications . Navy bars indicate number of chemicals classified as active by the model group, blue bars indicate the number of correctly classified active chemicals, red bars indicate the number of chemicals classified as inactive by the model group, orange bars indicate the number of correctly classified inactive chemicals, and green bar represents inconclusive scores.
Figure 3:
Figure 3:
Results for the in vivo agonist (A) and antagonist (B) test set across all machine learning model groups, in comparison to Kleinstreuer et al. and CoMPARA consensus classifications . Navy bars indicate number of chemicals classified as active by the model group, blue bars indicate the number of correctly classified active chemicals, red bars indicate the number of chemicals classified as inactive by the model group, orange bars indicate the number of correctly classified inactive chemicals, and green bar represents inconclusive scores.
Figure 3:
Figure 3:
Results for the in vivo agonist (A) and antagonist (B) test set across all machine learning model groups, in comparison to Kleinstreuer et al. and CoMPARA consensus classifications . Navy bars indicate number of chemicals classified as active by the model group, blue bars indicate the number of correctly classified active chemicals, red bars indicate the number of chemicals classified as inactive by the model group, orange bars indicate the number of correctly classified inactive chemicals, and green bar represents inconclusive scores.

References

    1. EPA, U., Use of High Throughput Assays and Computational Tools: Endocrine Disruptor Screening Program; Notice of Availability and Opportunity for Comment, 80 Fed. Reg. 118. In 2015.
    1. Mooradian AD; Morley JE; Korenman SG, Biological actions of androgens. Endocr Rev 1987, 8, (1), 1–28. - PubMed
    1. NORD National Organization for Rare Diseases. https://rarediseases.org
    1. Manolagas SC; O’Brien CA; Almeida M, The role of estrogen and androgen receptors in bone health and disease. Nat Rev Endocrinol 2013, 9, (12), 699–712. - PMC - PubMed
    1. Schug TT; Janesick A; Blumberg B; Heindel JJ, Endocrine disrupting chemicals and disease susceptibility. J Steroid Biochem Mol Biol 2011, 127, (3–5), 204–15. - PMC - PubMed

Publication types