. 2021 Jan 1;125(1):23-42.
doi: 10.1152/jn.00734.2019. Epub 2020 Oct 21.

Local glutamate-mediated dendritic plateau potentials change the state of the cortical pyramidal neuron

Affiliations

Local glutamate-mediated dendritic plateau potentials change the state of the cortical pyramidal neuron

Peng P Gao et al. J Neurophysiol. .

Abstract

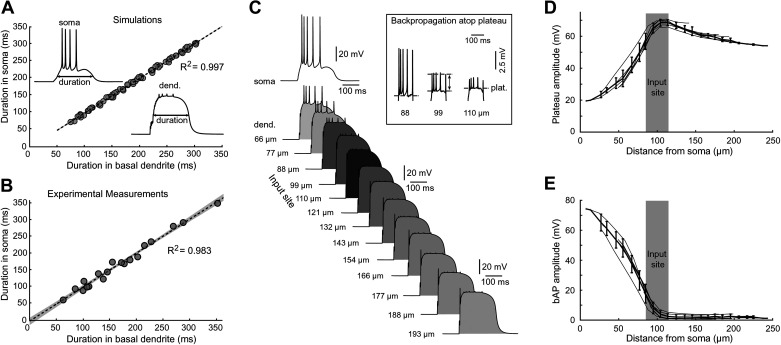
Dendritic spikes in thin dendritic branches (basal and oblique dendrites) are traditionally inferred from spikelets measured in the cell body. Here, we used laser-spot voltage-sensitive dye imaging in cortical pyramidal neurons (rat brain slices) to investigate the voltage waveforms of dendritic potentials occurring in response to spatially restricted glutamatergic inputs. Local dendritic potentials lasted 200-500 ms and propagated to the cell body, where they caused sustained 10- to 20-mV depolarizations. Plateau potentials propagating from dendrite to soma and action potentials propagating from soma to dendrite created complex voltage waveforms in the middle of the thin basal dendrite, comprised of local sodium spikelets, local plateau potentials, and backpropagating action potentials, superimposed on each other. Our model replicated these voltage waveforms across a gradient of glutamatergic stimulation intensities. The model then predicted that somatic input resistance (Rin) and membrane time constant (tau) may be reduced during dendritic plateau potential. We then tested these model predictions in real neurons and found that the model correctly predicted the direction of Rin and tau change but not the magnitude. In summary, dendritic plateau potentials occurring in basal and oblique branches put pyramidal neurons into an activated neuronal state ("prepared state"), characterized by depolarized membrane potential and smaller but faster membrane responses. The prepared state provides a time window of 200-500 ms, during which cortical neurons are particularly excitable and capable of following afferent inputs. At the network level, this predicts that sets of cells with simultaneous plateaus would provide cellular substrate for the formation of functional neuronal ensembles.NEW & NOTEWORTHY In cortical pyramidal neurons, we recorded glutamate-mediated dendritic plateau potentials with voltage imaging and created a computer model that recreated experimental measures from dendrite and cell body. Our model made new predictions, which were then tested in experiments. Plateau potentials profoundly change neuronal state: a plateau potential triggered in one basal dendrite depolarizes the soma and shortens membrane time constant, making the cell more susceptible to firing triggered by other afferent inputs.

Keywords: NMDA spike; ensembles; integration; membrane time constant; nonlinear.


Conflict of interest statement

No conflicts of interest, financial or otherwise, are declared by the authors.

Figures

None
Graphical abstract
Figure 1.
Figure 1.
Voltage waveforms of the glutamate-evoked dendritic plateau potentials. A1, bottom: pyramidal neuron filled with JPW-3028. Image was acquired by standard camera used for patching (camera 1). Top: laser spot illumination technique imaging 1 individual dendrite at low resolution (80 × 80 pixels), fast (2.7 kHz), voltage-imaging camera (camera 2). A2: glutamate was applied iontophoretically (5 ms) at location indicated in A1, bottom. The intensity of the glutamatergic stimulation was increased in equal steps through 9 recording trials (trials 1–9), and optical signals were recorded in the dendritic region of interest (ROI 1) marked by rectangle in A1, top. “soma” marks the somatic whole cell recordings obtained simultaneously with the optical signals. B: additional cell; same experimental paradigm as in A. C: glutamatergic stimulation of an oblique dendrite (duration 5 ms) triggers a local plateau potential. r, Fast rise; s, initial sodium spikelet; p, plateau phase; c, collapse, of the somatic plateau potential. D1: pyramidal neuron filled with JPW-3028. The position of the glutamate-filled sharp electrode is marked by drawing. D2: in trial 1, glutamate-induced membrane potential changes were recorded simultaneously at 2 ROIs on the same dendrite and in the cell body (whole cell). D3: in trial 2, the glutamatergic stimulus was increased by 20%, causing a longer-lasting plateau phase. The initial spikelet in the dendritic recording (blue arrow) produced no action potential (AP) in soma, only producing rapid inflection with kink preceding the plateau phase (red arrowhead). Three backpropagating APs (bAPs) recorded in the dendrite are marked by black arrows. D4: blowup of D2 on a faster timescale, to show that initial spikelet (init. s.) precedes the somatic kink.
Figure 2.
Figure 2.
Model outline. A1: reconstructed pyramidal neuron. A2: 6 basal dendrites, mostly used in data quantifications, are labeled by bracketed numbers. B1: the backpropagating action potential (bAP) amplitude, peak latency, and response to TTX and 4-aminopyridine (4-AP) match the experimental measurements obtained in basal dendrites with voltage-sensitive dyes. B2 and B3: quantification of the model results. C1: glutamate stimulations activate the AMPA receptors and NMDA receptors (NMDARs) on dendritic spines (red) and the NMDARs on extrasynaptic surfaces, including the spine head, spine neck, and dendritic shaft (yellow). C2, top: the comparison of simulated traces with and without extrasynaptic NMDARs. Green, somatic response evoked by synaptic NMDARs only; black, somatic response evoked by conjugate activation of both synaptic and extrasynaptic NMDARs. Bottom: same traces as at top but with the application of TTX to block all voltage-activated sodium channels. D1: membrane potential (Vm) change in basal dendrite during a plateau potential obtained in model cell shown in A. D2: same as in D1, except that sodium conductance (gNa) increased by 25%. D3: membrane potential change in basal dendrite obtained by voltage-sensitive dye imaging (from Fig. 1D3). E1: temporal organization of the glutamatergic inputs: uniform random within time window of 65 ms. Presynaptic axons (green) impinging on dendritic spines (brown). Ticks indicate APs in axon. E2: temporal organization of inputs: alpha random function. E3: dendritic plateau potential with alpha distribution of inputs. r, Fast rise; s, initial sodium spikelet; p, plateau phase; c, collapse, of the somatic plateau potential.
Figure 3.
Figure 3.
Varying levels of glutamatergic input in experiments and model. A: somatic whole cell recordings in a layer 5 pyramidal neuron. Glutamate microiontophoresis was applied on 1 basal branch ∼90 µm away from the soma. The intensity of the glutamate iontophoretic current was increased gradually in equal steps (subthreshold membrane responses in blue). p, Somatic plateau amplitude. B: computational model of simultaneous somatic (soma) and dendritic (dend) voltage recordings in response to glutamate application on 1 basal dendrite. Inset: blowup during arrival of glutamatergic inputs on dendrite. Distance from the soma = 110 µm. The NMDA receptor (NMDAR) mechanism here is based on Destexhe et al. (1994) (our model 1). The model 2 data [employing the Major et al. (2008) NMDAR mechanism] are shown in Supplemental Fig. S1B. C1–C3: numerical analysis of experimental data obtained in 3 real neurons and 2 model neurons.
Figure 4.
Figure 4.
Voltage waveforms in soma and dendrite are strongly correlated. A: comparisons between dendritic and somatic voltage transients obtained in the model simulations. n = 70 sweeps in 6 model basal branches. Insets depict the method used for measuring plateau amplitude and duration in dendrite and soma. B: experimental measurements in rat brain slices using simultaneous recordings of voltage waveforms in dendrite (voltage imaging) and soma (whole cell). n = 19 sweeps from 5 pyramidal neurons. Linear fitting by ordinary least squares regression. The 95% confidence interval is marked by gray shading. C: computer simulation. Dendritic voltage waveforms obtained simultaneously from 13 locations along basal dendrite and cell body (soma). Inset: backpropagating action potentials (bAPs) emerge from the plateau phase. Horizontal dashed line marks the amplitude of the plateau phase. Two-sided arrow indicates method used for measuring AP amplitude above plateau. D: dendritic plateau amplitude as function of distance from cell body. E: amplitude of bAPs above plateau level, as function of distance from cell body.
Figure 5.
Figure 5.
The impact of the input location. A: Major et al. (2008) delivered glutamate microiontophoresis on the basal branches at various distances from the cell body, and they measured membrane potential (Vm) changes in the soma. The amplitude of the plateau potential in the soma is plotted against the distance from the cell body; recreated from Major et al. (2008). B: computer simulation of the experiment described in A. Results obtained with our model 2 (Major et al. 2008) are displayed: simultaneous voltage waveforms in dendrite (at input location) and soma. The precise locations of the glutamate inputs on basal dendrite are indicated above each dendritic trace and expressed as distance from the cell body in micrometers. Blue traces, subthreshold depolarizations; red, first suprathreshold, local regenerative potentials. Vertical dashed lines mark 4 different plateau durations obtained by stimulating basal dendrite at 4 locations; fixed glutamate input intensity. The results of model 1 [utilizing the Destexhe et al. (1994) membrane mechanism for NMDA receptor (NMDAR) channels] are shown in Supplemental Fig. S2B. C: same experimental outline as in A except that experiment was performed in simulations. Data quantifications of these simulation experiments are plotted. D: in model neuron, the local amplitude of the dendritic plateau, measured at each glutamate stimulation site, is plotted vs. the distance of that stimulation site from the cell body. E: the local duration (half-width) of the dendritic plateau at the glutamate stimulation site is plotted as a function of distance from the cell body. Blue data points depict local dendritic input resistance (Rin). F: distal glutamatergic inputs (distal pool) generate dendritic plateau potentials, which fail to trigger somatic action potentials (APs).
Figure 6.
Figure 6.
The cell body membrane time constant (tau) and input resistance (Rin) are affected by dendritic plateau potentials. A1: basilar dendritic tree of the model cell. Dendritic segment (66–132 µm) is receiving glutamate inputs. Computer simulation of dendritic plateau potential measured at soma. An identical depolarizing current pulse was injected into the soma before and during the plateau potential (current injection, c.i.). A2: A1 responses superimposed before (blue) and during (red) plateau; amplitude during plateau (ΔVm-d) is smaller than before plateau (ΔVm-b). A3: A1 responses superimposed and normalized to ΔVm-b. B1: whole cell recordings in TTX with 5-ms glutamate pulse at dendritic location 90 µm from soma. Test pulses for testing Rin and tau were attained by somatic current injection, “before” and “during” plateau, as in the model (5 sweeps average for each trace). In trial ii test pulses were omitted to reveal the waveform of the underlying plateau. Subtraction iii at bottom shows responses to test pulses, free from plateau induced wobbles in the baseline. B2: comparisons of evoked responses before and during plateau. Six cells are displayed to show cell-to-cell variability. Scaling was used to allow comparison of time constants. C: raw values. Rin and tau both decrease during plateau potential (mean ± standard deviation, n = 294 trials in 18 dendrites of 8 neurons; ***P < 0.0001). D: relative values (during/before). Comparison of model (n = 16 trials obtained by stimulation of 16 dendrites, in 2 model neurons) with experiment from C using relative values (*P < 0.01).
Figure 7.
Figure 7.
Position of glutamatergic input on basal dendrite determines the magnitude of the plateau-induced changes in the somatic membrane time constant (tau). A1: experimental outline in model and experiment: in the presence of TTX, glutamate input of fixed intensity delivered at 2 different locations along a basal dendrite. c.i., Current injection. A2: in model, plateau amplitude at cell body has greater amplitude and faster rise when triggered from proximal location (prox) compared with distal location. Inset: comparison of charging curves. Vm-t marks the membrane voltage at which the test pulse “during plateau” begins. A3: experiment verifies model prediction. B1: schematic of input location shifting on a basal branch with input intensity fixed. Multiple dendrites are examined. B2: tau increased with increased distance of the glutamate input site for all 6 dendrites tested. C1: in real neurons, multiple traces from 1 glutamate stimulation site were recorded with glutamatergic stimulation ON (brown) or OFF (black). A blowup of membrane responses before and during plateau; multiple repetitions. C2: comparison of tau between distally and proximally delivered fixed-intensity glutamatergic input on the same dendrite (distal site 40–110 µm away from proximal). Error bars are standard deviations. ***P < 0.01, *P < 0.05. n.s., Not significant.
Figure 8.
Figure 8.
Dendritic plateau potential alteration of somatic membrane time constant (tau) and input resistance (Rin) is not fully explained by effect on membrane potential (Vm). Experiments in TTX. A1: Vm with current injection (inset: voltage setting pulse). Additional current pulse (inset: test pulse) was used to measure Rin and tau. Vm-t is value at start of test pulse. A2: soma Rin normalized by Rin at resting membrane potential (RMP) plotted against Vm-t. A3: soma tau normalized by tau at RMP plotted against Vm-t. B1: glutamate-evoked plateau potential with test pulse. B2: soma Rin normalized by Rin at RMP plotted against Vm-t. B3: soma tau normalized by tau at RMP plotted against Vm-t. Second-order polynomial fits without intercept. The 2 conditions (A and B) differ markedly from −50 to −30 mV (light gray).
Figure 9.
Figure 9.
A dendritic plateau potential occurring in 1 basal dendrite influences the somatic integration of excitatory postsynaptic potentials (EPSPs) arriving on other dendrites. A: basilar dendritic tree of the model cell. Plateau was produced in 1 branch (Plateau). Individual EPSPs were received at 5 locations marked by arrows. B: spikeless plateau is paired with EPSPs. Top (EPSP only): an identical barrage of EPSPs was delivered twice, causing 2 EPSP events. Middle (Plateau only): glutamatergic stimulation of 1 basal dendrite produced a somatic plateau subthreshold for axonal action potential (AP) initiation (spikeless plateau). Bottom: pairing of the stimulation paradigms used in top and middle traces. C: spiking plateau (plateau accompanied by somatic APs) is paired with EPSPs. Intercalated spike is marked by black dot labeled “EPSP-evoked AP.” D: the same modeling experiment as in C except that an even stronger plateau, with more accompanying APs, was used for pairing. E, top: strong EPSP barrage, capable of triggering AP in the absence of plateau. Bottom: pairing of the EPSP barrage with a spikeless plateau. Solid vertical line marks the onset of the EPSP barrage. Dashed vertical line marks the peak of the EPSP-evoked AP. Gray box marks a time delay between the onset of EPSP barrage and the AP peak (dT). Vm-t, voltage just before arrival of EPSPs. F: dT is reduced during plateau. G: voltage controlled by current injection; compare with E. A more depolarized Vm-t produces AP sooner. H: the voltage dependence of dT is similar with and without dendritic plateau potential.

Similar articles

Cited by

References

    1. Acker CD, Antic SD. Quantitative assessment of the distributions of membrane conductances involved in action potential backpropagation along basal dendrites. J Neurophysiol 101: 1524–1541, 2009. doi:10.1152/jn.00651.2007. - DOI - PMC - PubMed
    1. Antic SD. Action potentials in basal and oblique dendrites of rat neocortical pyramidal neurons. J Physiol 550: 35–50, 2003. doi:10.1113/jphysiol.2002.033746. - DOI - PMC - PubMed
    1. Antic SD, Hines M, Lytton WW. Embedded ensemble encoding hypothesis: the role of the “prepared” cell. J Neurosci Res 96: 1543–1559, 2018. doi:10.1002/jnr.24240. - DOI - PMC - PubMed
    1. Arnth-Jensen N, Jabaudon D, Scanziani M. Cooperation between independent hippocampal synapses is controlled by glutamate uptake. Nat Neurosci 5: 325–331, 2002. [Erratum in Nat Neurosci 5: 500, 2002]. doi:10.1038/nn825. - DOI - PubMed
    1. Augustinaite S, Kuhn B, Helm PJ, Heggelund P. NMDA spike/plateau potentials in dendrites of thalamocortical neurons. J Neurosci 34: 10892–10905, 2014. doi:10.1523/JNEUROSCI.1205-13.2014. - DOI - PMC - PubMed

Publication types

LinkOut - more resources