. 2021 Feb;15(2):596-622.
doi: 10.1002/1878-0261.12830. Epub 2020 Dec 16.

CircRNA EPHB4 modulates stem properties and proliferation of gliomas via sponging miR-637 and up-regulating SOX10

Affiliations

CircRNA EPHB4 modulates stem properties and proliferation of gliomas via sponging miR-637 and up-regulating SOX10

Chen Jin et al. Mol Oncol. 2021 Feb.

Retraction in

Abstract

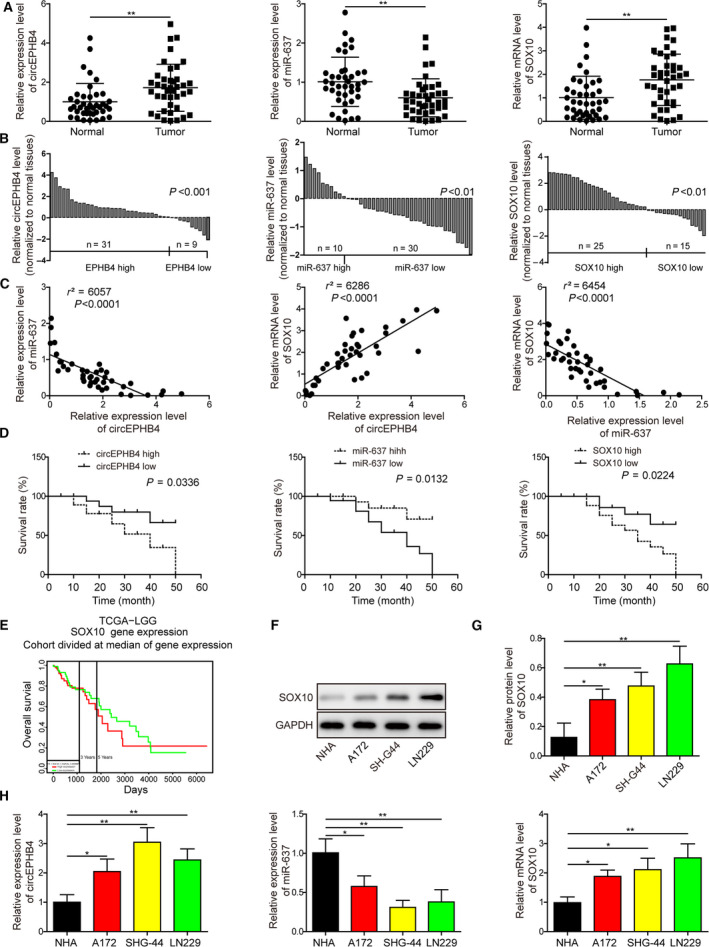
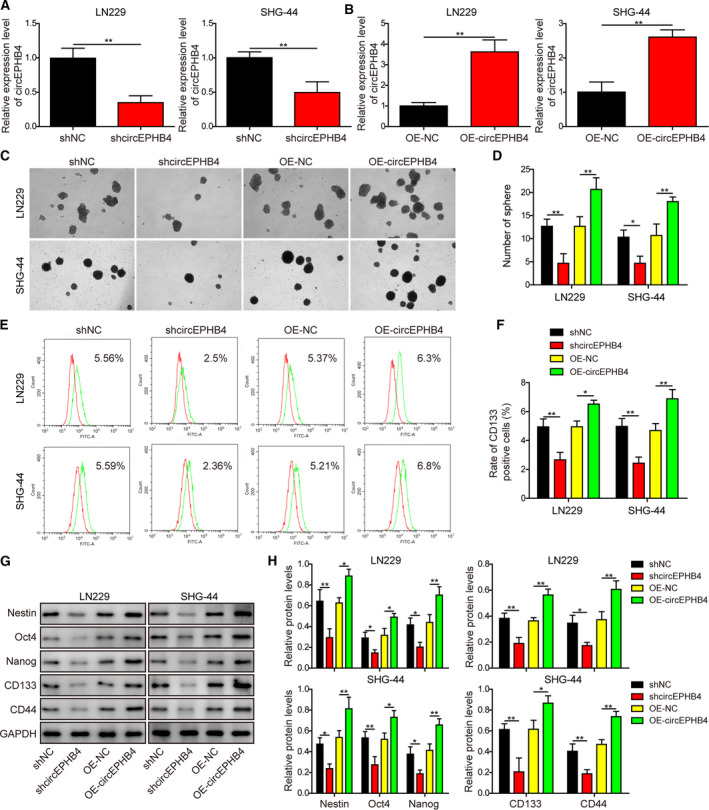
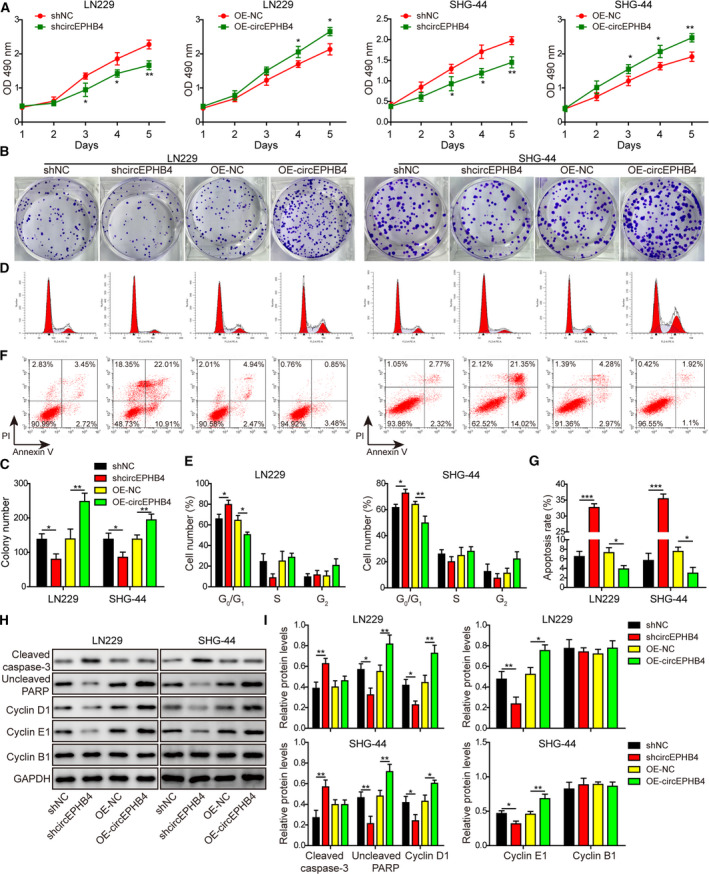
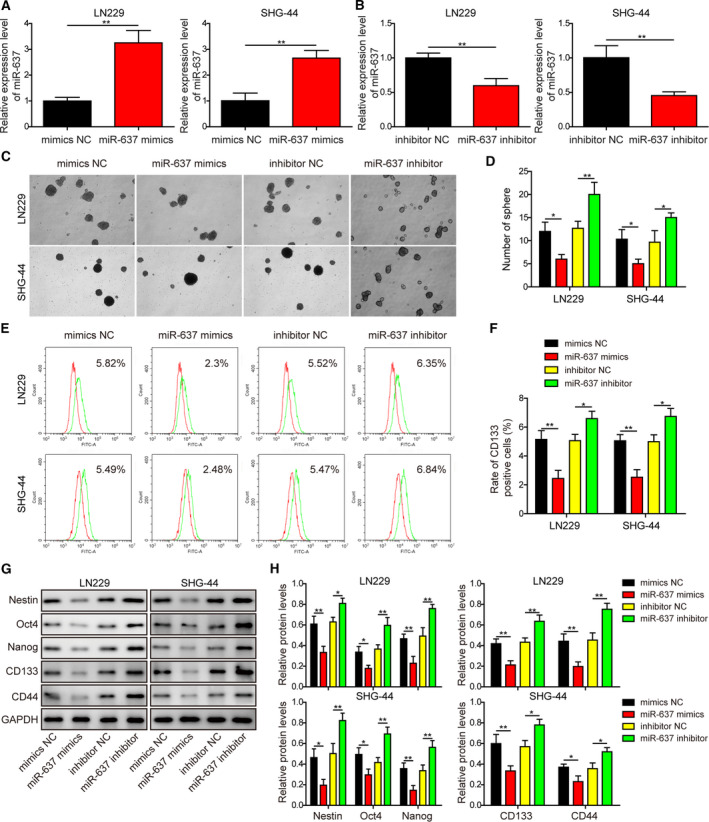
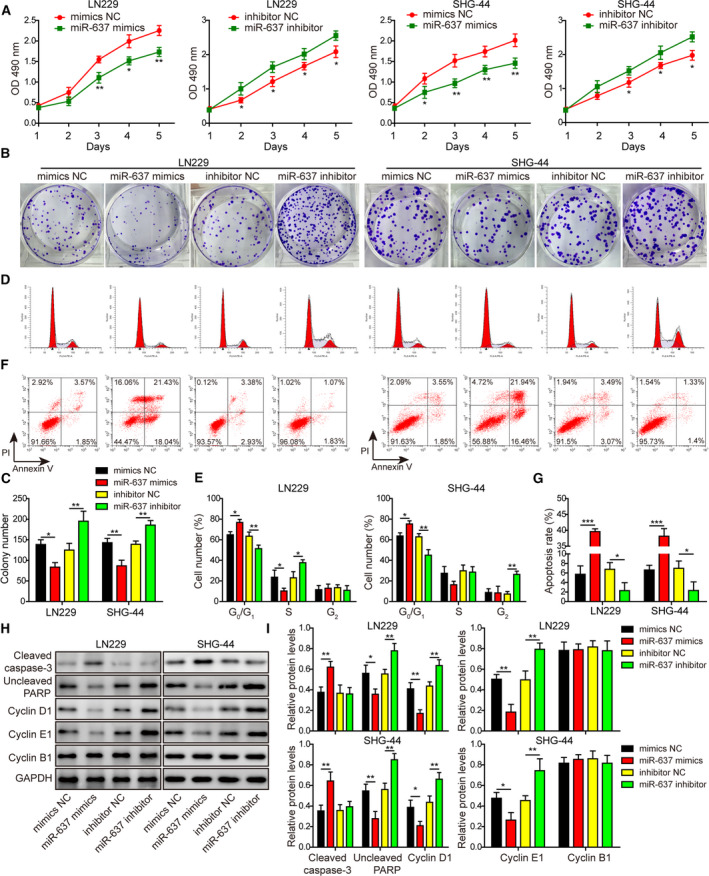
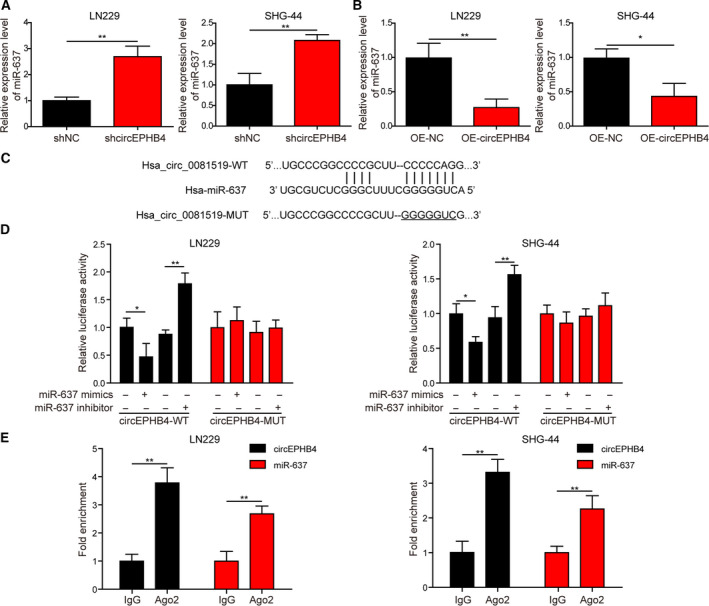
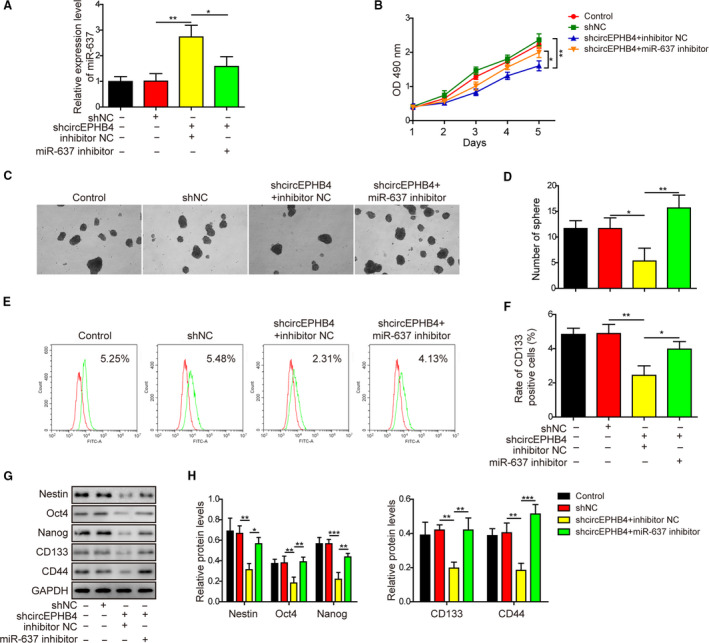
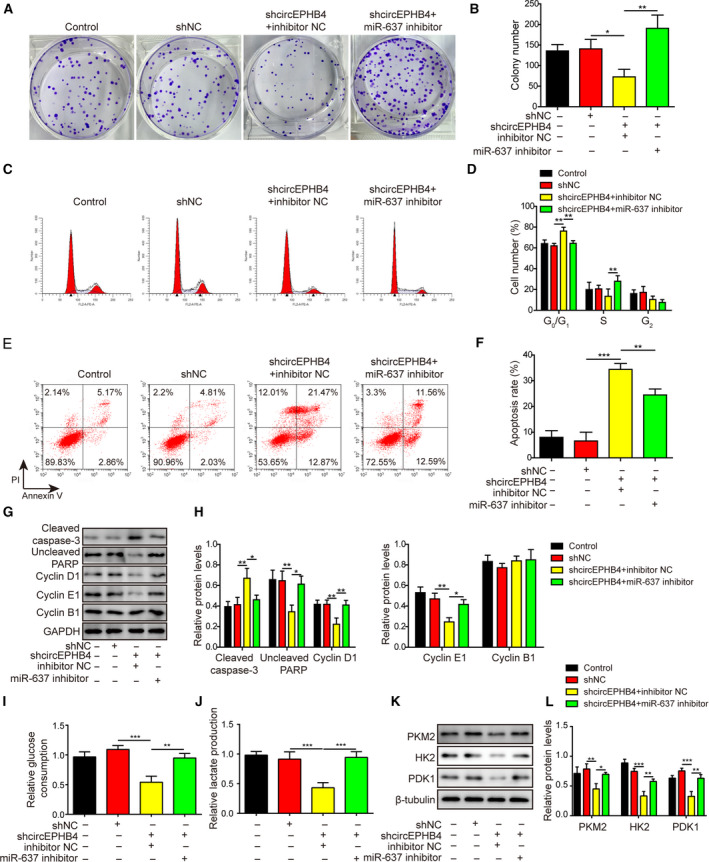
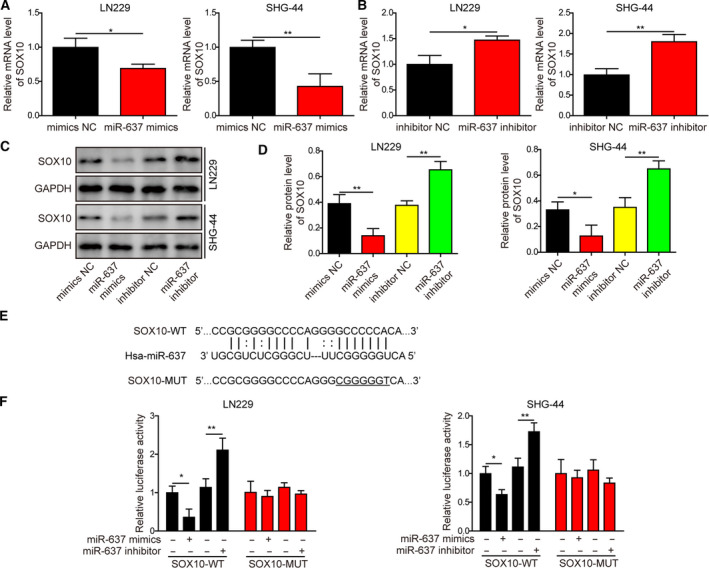
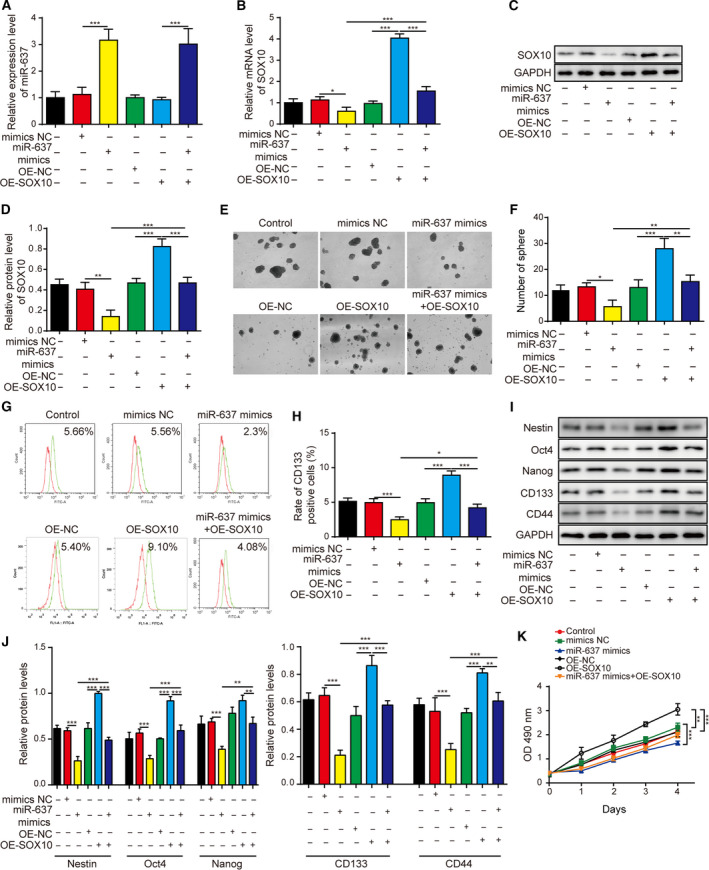
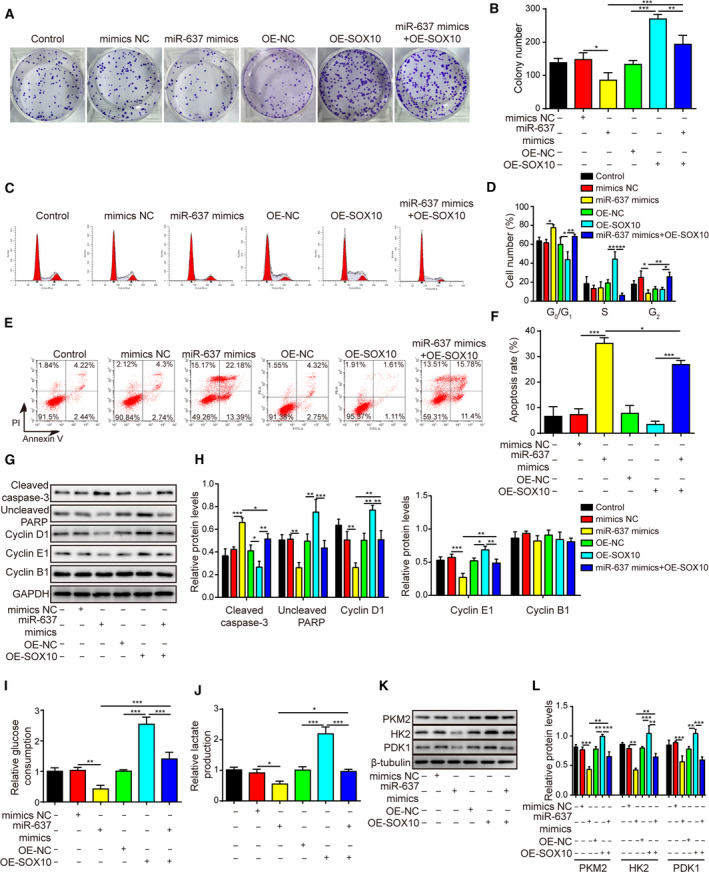
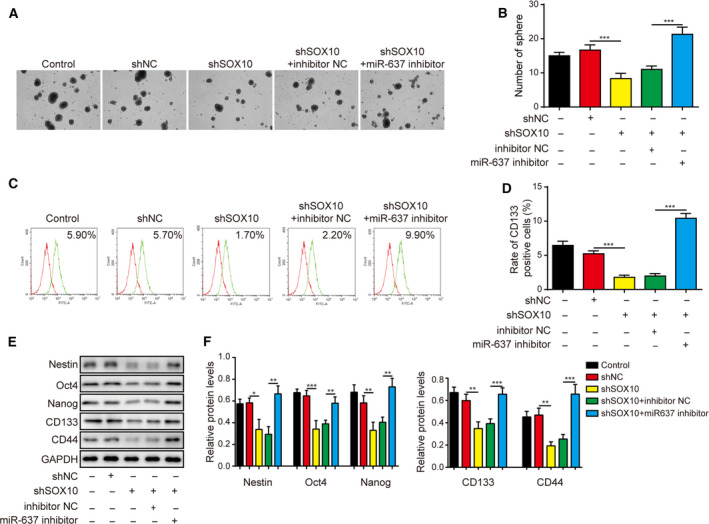
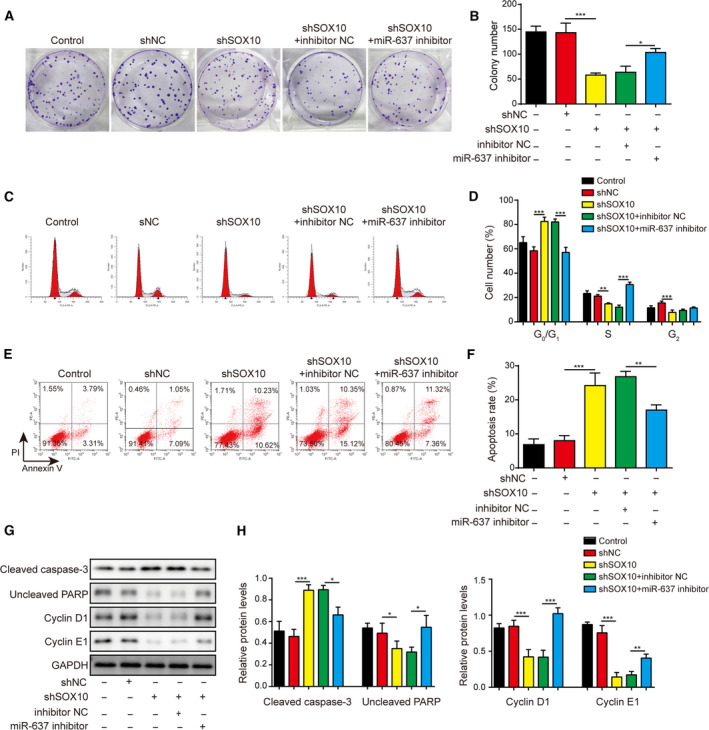
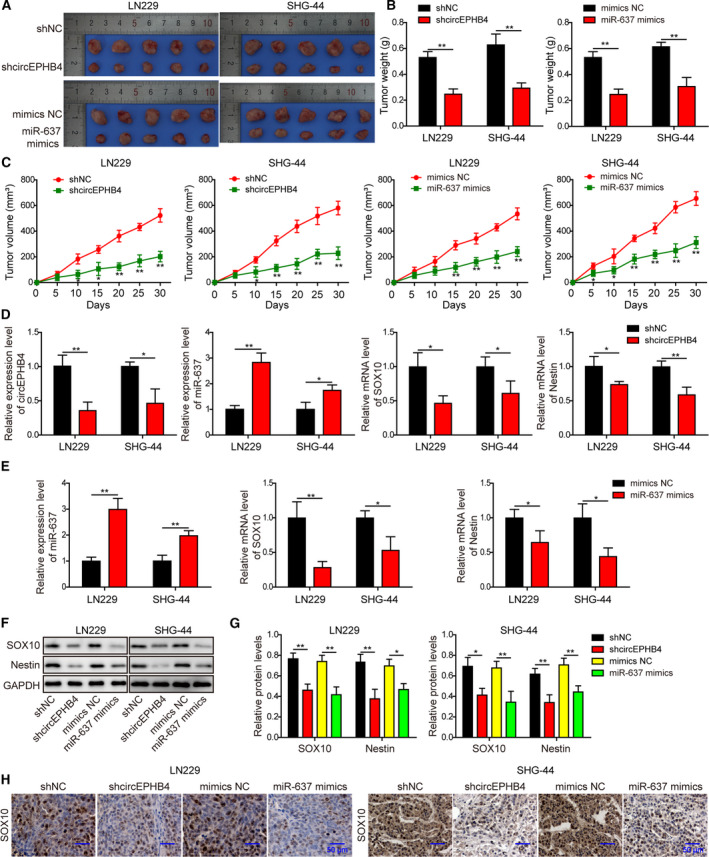
Gliomas are the most common type of primary brain tumors. CircRNA ephrin type-B receptor 4 (circEPHB4) is a circular RNA derived from the receptor tyrosine kinase EPHB4. However, the clinical significance and the specific roles of circEPHB4 in gliomas and glioma cancer stem cells (CSC) have not been studied. Here, we found that circEPHB4 (hsa_circ_0081519) and SOX10 were up-regulated and microRNA (miR)-637 was down-regulated in glioma tissues and cell lines. Consistently, circEPHB4 was positively correlated with SOX10 but negatively correlated with miR-637. The altered expressions of these molecules were independently associated with overall survival of patients. CircEPHB4 up-regulated SOX10 and Nestin by directly sponging miR-637, thereby stimulating stemness, proliferation and glycolysis of glioma cells. Functionally, silencing circEPHB4 or increasing miR-637 levels in glioma cells was sufficient to inhibit xenograft growth in vivo. In conclusion, the circEPHB4/miR-637/SOX10/Nestin axis plays a central role in controlling stem properties, self-renewal and glycolysis of glioma cells and predicts the overall survival of glioma patients. Targeting this axis might provide a therapeutic strategy for malignant gliomas.

Keywords: SOX10; cancer stemness; circEPHB4; gliomas; miR-637; proliferation.


Conflict of interest statement

The authors declare no conflict of interest.

Figures

Fig. 1
Fig. 1
CircEPHB4 and SOX10 were up‐regulated, while miR‐637 was down‐regulated in glioma tissues or cell lines. (A) The expression levels of circEPHB4, miR‐637 and SOX10 were examined by qRT‐PCR in 40 pairs of tumor‐free normal tissues and glioma tissues. (B) The relative expression of circEPHB4, miR‐637 and SOX10 examined in (A) is presented for each individual patient. (C) The correlations between the expression levels of circEPHB4 and miR‐637, circEPHB4 and SOX10, and miR‐637 and SOX10 were analyzed by Spearmen correlation analysis. (D) The correlations between the level of circEPHB4, miR‐637, and SOX10 and the overall survival of glioma patients were analyzed using Kaplan–Meier method. (E) TGCA dataset analyzed by Jefferson online tool (http://genomics.jefferson.edu/proggene/index.php) revealed significant correlation between high SOX10 expression and the reduced overall survival (3 and 5 years) of glioma patients (n = 103). (F,G) SOX10 expression was measured on the protein level by Western blotting and compared between NHA cells and three glioma cell lines A172, SHG‐44 and LN229 cells. (H) The expression levels of circEPHB4, miR‐637 and SOX10 were examined by qRT‐PCR and compared between NHA cells and three glioma cell lines A172, SHG‐44, and LN229. Data are presented as mean ± SD from three independent experiments. Comparison between two groups was performed using Student’s t‐test and between three or more groups using one‐way ANOVA followed by Tukey’s post hoc test. *P < 0.05, **P < 0.01 and ***P < 0.001.
Fig. 2
Fig. 2
CircEPHB4 necessarily and sufficiently promoted cancer stemness of glioma cells. (A,B) The expression levels of circEPHB4 were measured by qRT‐PCR and compared between indicated cells. (C,D) The stemness of indicated cells was examined by neurosphere formation assay, with representative images of formed neurospheres shown in (C) and the quantification results shown in (D). (E,F) The expression of CD133 on the surface of indicated cells was examined by flow cytometry in (E) and the quantification results are shown in (F). (G,H) The expression levels of stem‐cell markers Nestin, Oct4, Nanog, CD133 and CD44 were measured by Western blotting in indicated cells (G) and quantified as the ratio to GAPDH (H). LN229 or SHG‐44 cells were engineered either to stably knock down (shcircEPHB4) or to overexpress circEPHB4 (OE‐circEPHB4). shNC or OE‐NC vector was used as the corresponding negative control for shcircEPHB4 or OE‐circEPHB4. Data are presented as mean ± SD from three independent experiments. Comparison between two groups was performed using Student’s t‐test and between three or more groups using one‐way ANOVA followed by Tukey’s post hoc test. *P < 0.05, **P < 0.01.
Fig. 3
Fig. 3
CircEPHB4 played a central role in stimulating the viability and proliferation of glioma cells, while inhibiting apoptosis. (A) The viability of indicated LN229 or SHG‐44 cells was measured by MTT assay for 1, 2, 3, 4 and 5 days, respectively. (B,C) The long‐term proliferation of indicated cells was examined by colony‐forming assay, with representative images of colonies shown in (B) and the number of colonies in (C). (D,E) The cell‐cycle distribution of indicated cells was measured by staining the cells with PI, followed by flow cytometry. Representative images were presented in (D) and the percentages of cells in different phases of cell cycle presented in (E). (F,G) The apoptosis of indicated cells was measured by co‐staining the cells with Annexin V and PI, followed by flow cytometry. Representative images are presented in (F) and the percentage of Annexin V+ apoptotic cells in (G). (H,I) The expression levels of markers for apoptosis, cleaved caspase‐3 and uncleaved PARP, and markers for cell cycle progression, cyclin D1, cyclin E1 and cyclin B1 were examined by Western blotting (H) and quantified as the ratio to GAPDH (I). LN229 or SHG‐44 cells were engineered either to stably knock down (shcircEPHB4) or to overexpress circEPHB4 (OE‐circEPHB4). Short hairpin NC or OE‐NC vector was used as the corresponding negative control for shcircEPHB4 or OE‐circEPHB4. Data are presented as mean ± SD from three independent experiments. Comparison between two groups was performed using Student’s t‐test and between three or more groups using one‐way ANOVA followed by Tukey’s post hoc test. *P < 0.05, **P < 0.01 and ***P < 0.001.
Fig. 4
Fig. 4
MiR‐637 displayed stemness‐related phenotypes that were opposite those displayed by circEPHB4. (A,B) The expression of miR‐637 was examined by qRT‐PCR and compared between indicated cells. (C,D) The stemness of indicated cells was examined by neurosphere formation assay, with representative images of formed neurospheres shown in (C) and the quantification results in (D). (E,F) The expression of CD133 on the surface of indicated cells was examined by flow cytometry in (E) and the quantification results shown in (F). (G,H) The expression levels of stem‐cell markers Nestin, Oct4, Nanog, CD133 and CD44 were measured by Western blotting in indicated cells (G) and quantified as the ratio to GAPDH (H). MiR‐637 mimics or miR‐637 inhibitor was transfected into LN229 or SHG‐44 cells to either overexpress or knockdown miR‐637. Data are presented as mean ± SD from three independent experiments. Comparison between two groups was performed using Student’s t‐test and between three or more groups using one‐way ANOVA followed by Tukey’s post hoc test. *P < 0.05, **P < 0.01.
Fig. 5
Fig. 5
MiR‐637 displayed proliferation‐related phenotypes opposite to those displayed by circEPHB4. (A) The viability of indicated LN229 or SHG‐44 cells was measured by MTT assay for 1, 2, 3, 4 and 5 days, respectively. (B,C) The long‐term proliferation of indicated cells was examined by colony‐forming assay, with representative images of colonies shown in (B) and the number of colonies in (C). (D,E) The cell‐cycle distribution of indicated cells was measured by staining the cells with PI, followed by flow cytometry. Representative images were presented in (D) and the percentages of cells in different phases of cell cycle in (E). (F,G) The apoptosis of indicated cells was measured by co‐staining the cells with Annexin V and PI, followed by flow cytometry. Representative images were presented in (F) and the percentage of Annexin V+ apoptotic cells in (G). (H,I) The expression levels of markers for apoptosis, cleaved caspase‐3 and uncleaved PARP, and markers for cell cycle progression, cyclin D1, cyclin E1 and cyclin B1, were examined by Western blotting (H) and quantified as the ratio to GAPDH (I). MiR‐637 mimics or miR‐637 inhibitor was transfected into LN229 or SHG‐44 cells to either overexpress or knockdown miR‐637. Data are presented as mean ± SD from three independent experiments. Comparison between two groups was performed using Student’s t‐test and between three or more groups using one‐way ANOVA followed by Tukey’s post hoc test. *P < 0.05, **P < 0.01 and ***P < 0.001.
Fig. 6
Fig. 6
CircEPHB4 directly targeted the expression of miR‐637. (A,B) The expression of miR‐637 was measured by qRT‐PCR in LN229 or SHG‐44 cells with altered expression of circEPHB4. (C) Bioinformatic analysis revealed a potential binding site between circEPHB4 and miR‐637. (D) The luciferase activity was measured by reporter assay. Wild‐type (WT) or mutated (MUT) circEPHB4 sequence was cloned into luciferase reporter construct, co‐transfected into LN229 or SHG‐44 cells with either miR‐637 mimics or inhibitor. (E) The interaction between circEPHB4 and miR‐637 was examined by RIP assay using either anti‐Ago2 or IgG antibody. The level of circEPHB4 or miR‐637 pulled down by IgG was arbitrally defined as 1. Data are presented as mean ± SD from three independent experiments. Comparison between two groups was performed using Student’s t‐test and between three or more groups using one‐way ANOVA followed by Tukey’s post hoc test. *P < 0.05, **P < 0.01.
Fig. 7
Fig. 7
Knocking down miR‐637 reversed anti‐stemness phenotypes conferred by shcircEPHB4. (A) The expression of miR‐637 was measured by qRT‐PCR in indicated LN229 cells. (B) The viability of indicated LN229 cells was measured by MTT assay for 1, 2, 3, 4 and 5 days, respectively. (C,D) The stemness of indicated cells was examined by neurosphere formation assay, with representative images of formed neurospheres shown in (C) and the quantification results in (D). (E,F) The expression of CD133 on the surface of indicated cells was examined by flow cytometry in (E) and the quantification results are shown in (F). (G,H) The expression levels of the stem‐cell markers Nestin, Oct4, Nanog, CD133 and CD44 were measured by Western blot in indicated cells (G) and quantified as the ratio to GAPDH (H). LN229 cells were simultaneously manipulated for the levels of circEPHB4 and miR‐637 (shcircEPHB4 + miR‐637 inhibitor). Data are presented as mean ± SD from three independent experiments. Comparison between three or more groups was performed using one‐way ANOVA followed by Tukey’s post hoc test. *P < 0.05, **P < 0.01 and ***P < 0.001.
Fig. 8
Fig. 8
Knocking down miR‐637 reversed anti‐proliferation phenotypes conferred by shcircEPHB4. (A,B) The long‐term proliferation of indicated cells was examined by colony‐forming assay, with representative images of colonies shown in (A) and the number of colonies in (B). (C,D) The cell‐cycle distribution of indicated cells was measured by staining the cells with PI, followed by flow cytometry. Representative images were presented in (C) and the percentages of cells in different phases of cell cycle are presented in (D). (E,F) The apoptosis of indicated cells was measured by co‐staining the cells with Annexin V and PI, followed by flow cytometry. Representative images were presented in (E) and the percentage of Annexin V+ apoptotic cells in (F). (G,H) The expression levels of markers for apoptosis, cleaved caspase‐3 and uncleaved PARP, and markers for cell cycle progression, cyclin D1, cyclin E1 and cyclin B1, were examined by Western blotting (G), and quantified as the ratio to GAPDH (H). (I,J) Glucose consumption (I) and lactate production (J) from indicated cells were measured using corresponding assay kits. (K,L) The expression levels of glycolysis‐related biomarkers PKM2, HK2, and PDK1 were examined by Western blotting (K), and quantified as the ratio to β‐tubulin (L). LN229 cells were simultaneously manipulated for the levels of circEPHB4 and miR‐637 (shcircEPHB4 + miR‐637 inhibitor). Data are presented as mean ± SD from three independent experiments. Comparison between three or more groups was performed using one‐way ANOVA followed by Tukey’s post hoc test. *P < 0.05, **P < 0.01 and ***P < 0.001.
Fig. 9
Fig. 9
SOX10 was a direct target for miR‐637 in glioma cells. (A–D) The expression levels of SOX10 were measured by qRT‐PCR (A,B) or by Western blotting (C,D) in LN229 or SHG‐44 cells treated with miR‐637 mimics or inhibitor. (E) Bioinformatic analysis identified a potential binding site between miR‐637 and the 3’‐UTR sequences of SOX10. (F) The luciferase activity was measured by reporter assay. Wild‐type (WT) or mutated (MUT) SOX10 binding sequence was cloned into the reporter construct, co‐transfected into LN229 or SHG‐44 cells with either miR‐637 mimics or inhibitor. Data are presented as mean ± SD from three independent experiments. Comparison between two groups was performed using Student’s t‐test and between three or more groups using one‐way ANOVA followed by Tukey’s post hoc test. *P < 0.05, **P < 0.01.
Fig. 10
Fig. 10
SOX10 overexpression rescued the anti‐stemness phenotypes caused by miR‐637. (A) The expression of miR‐637 was measured by qRT‐PCR in indicated LN229 cells. (B) The expression of SOX10 was measured by qRT‐PCR in indicated LN229 cells. (C,D) The expression of SOX10 was measured by Western blotting in indicated LN229 cells. (E,F) The stemness of indicated cells was examined by neurosphere formation assay, with representative images of formed neurospheres shown in (E) and the quantification results in (F). (G,H) The expression of CD133 on the surface of indicated cells was examined by flow cytometry in (G) and the quantification results are shown in (H). (I,J) The expression levels of stem‐cell markers Nestin, Oct4, Nanog, CD133 and CD44 were measured by Western blotting in indicated cells (I) and are quantified as the ratio to GAPDH (J). (K) The viability of indicated LN229 cells was measured by MTT assay for 1, 2, 3, 4 and 5 days, respectively. LN229 cells were overexpressed miR‐637 (miR‐637 mimics), SOX10 (OE‐SOX10) or both (miR‐637 mimics + OE‐SOX10). Data are presented as mean ± SD from three independent experiments. Comparison between three or more groups was performed using one‐way ANOVA followed by Tukey’s post hoc test. *P < 0.05, **P < 0.01 and ***P < 0.001.
Fig. 11
Fig. 11
SOX10 overexpression rescued the anti‐proliferation phenotypes caused by miR‐637. (A,B) The long‐term proliferation of indicated LN229 cells was examined by colony‐forming assay, with representative images of colonies shown in (A) and the number of colonies in (B). (C,D) The cell‐cycle distribution of indicated cells was measured by staining the cells with PI, followed by flow cytometry. Representative images were presented in (C) and the percentages of cells in different phases of cell cycle in (D). (E,F) The apoptosis of indicated cells was measured by co‐staining the cells with Annexin V and PI, followed by flow cytometry. Representative images were presented in (E) and the percentage of Annexin V+ apoptotic cells in (F). (G,H) The expression levels of markers for apoptosis, cleaved caspase‐3 and uncleaved PARP, and markers for cell cycle progression, cyclin D1, cyclin E1 and cyclin B1, were examined by Western blotting (G) and quantified as the ratio to GAPDH (H). (I,J) Glucose consumption (I) and lactate production (J) from indicated cells were measured using corresponding assay kits. (K,L) The expression of glycolysis‐related biomarkers PKM2, HK2 and PDK1 were examined by Western blotting (K) and quantified as the ratio to β‐tubulin (L). LN229 cells were overexpressed miR‐637 (miR‐637 mimics), SOX10 (OE‐SOX10) or both (miR‐637 mimics + OE‐SOX10). Data are presented as mean ± SD from three independent experiments. Comparison between three or more groups was performed using one‐way ANOVA followed by Tukey’s post hoc test. *P < 0.05, **P < 0.01 and ***P < 0.001.
Fig. 12
Fig. 12
Knocking down SOX10 antagonized the pro‐stemness phenotypes induced by miR‐637 inhibitor. (A,B) The stemness of indicated LN229 cells was examined by neurosphere formation assay, with representative images of formed neurospheres shown in (A) and the quantification results in (B). (C,D) The expression of CD133 on the surface of indicated cells was examined by flow cytometry in (C) and the quantification results are shown in (D). (E,F) The expression levels of stem‐cell markers Nestin, Oct4, Nanog, CD133 and CD44 were measured by Western blotting in indicated cells (E) and quantified as the ratio to GAPDH (F). Data are presented as mean ± SD from three independent experiments. Comparison between three or more groups was performed using one‐way ANOVA followed by Tukey’s post hoc test. *P < 0.05, **P < 0.01 and ***P < 0.001.
Fig. 13
Fig. 13
Knocking down SOX10 abolished the pro‐proliferation phenotypes conferred by miR‐637 inhibitor. (A,B) The long‐term proliferation of indicated LN229 cells was examined by colony‐forming assay, with representative images of colonies shown in (A) and the number of colonies in (B). (C,D) The cell‐cycle distribution of indicated cells was measured by staining the cells with PI, followed by flow cytometry. Representative images are presented in (C) and the percentages of cells in different phases of cell cycle in (D). (E,F) The apoptosis of indicated cells was measured by co‐staining the cells with Annexin V and PI, followed by flow cytometry. Representative images are presented in (E) and the percentage of Annexin V+ apoptotic cells in (F). (G,H) The expression levels of markers for apoptosis, cleaved caspase‐3 and uncleaved PARP, and markers for cell cycle progression, cyclin D1, cyclin E1 and cyclin B1, were examined by Western blotting (G) and quantified as the ratio to GAPDH (H). Data are presented as mean ± SD from three independent experiments. Comparison between three or more groups was performed using one‐way ANOVA followed by Tukey’s post hoc test. *P < 0.05, **P < 0.01 and ***P < 0.001.
Fig. 14
Fig. 14
Knocking down circEPHB4 or up‐regulating miR‐637 inhibited the in vivo xenograft growth of glioma cells. (A) Images of xenograft tumors from indicated groups. (B) Weights of all xenograft tumors were measured and compared between indicated groups. (C) The growth curve of xenograft tumors is presented as changes in tumor volumes from indicated groups. (D) The expression levels of circEPHB4, miR‐637, SOX10 and Nestin were examined by qRT‐PCR in xenograft tumors derived from indicated cells. (E) The expression levels of miR‐637, SOX10 and Nestin were examined by qRT‐PCR in xenograft tumors derived from indicated cells. (F,G) The expression levels of SOX10 and Nestin were examined by Western blotting in xenograft tumors derived from indicated cells. The representative images are shown in (F) and quantified as the ratio to GAPDH (G). (H) Histological analysis on SOX10 from indicated xenograft tumors. Scale bar: 50 µm. LN229 or SHG‐44 cells expressing shcircEPHB4 or miR‐637 mimics were subcutaneously injected into nude mice (n = 5/group). After 30 days, all mice were euthanized. Data are presented as mean ± SD from three independent experiments. Comparison between two groups was performed using Student’s t‐test and between three or more groups using one‐way ANOVA followed by Tukey’s post hoc test. *P < 0.05, **P < 0.01.

References

    1. Dolecek TA, Propp JM, Stroup NE & Kruchko C (2012) CBTRUS statistical report: primary brain and central nervous system tumors diagnosed in the United States in 2005–2009. Neuro Oncol 14 (Suppl 5), v1–49. - PMC - PubMed
    1. Bray F, Ferlay J, Soerjomataram I, Siegel RL, Torre LA & Jemal A (2018) Global cancer statistics 2018: GLOBOCAN estimates of incidence and mortality worldwide for 36 cancers in 185 countries. CA Cancer J Clin 68, 394–424. - PubMed
    1. Ahmed R, Oborski MJ, Hwang M, Lieberman FS & Mountz JM (2014) Malignant gliomas: current perspectives in diagnosis, treatment, and early response assessment using advanced quantitative imaging methods. Cancer Manag Res 6, 149–170. - PMC - PubMed
    1. Bradshaw A, Wickremsekera A, Tan ST, Peng L, Davis PF & Itinteang T (2016) Cancer stem cell hierarchy in glioblastoma multiforme. Front Surg 3, 21. - PMC - PubMed
    1. Lathia JD, Mack SC, Mulkearns‐Hubert EE, Valentim CL & Rich JN (2015) Cancer stem cells in glioblastoma. Genes Dev 29, 1203–1217. - PMC - PubMed

Publication types

MeSH terms