. 2021 Jan 1;320(1):R19-R35.
doi: 10.1152/ajpregu.00139.2020. Epub 2020 Oct 21.

Aging and chronic high-fat feeding negatively affect kidney size, function, and gene expression in CTRP1-deficient mice

Affiliations

Aging and chronic high-fat feeding negatively affect kidney size, function, and gene expression in CTRP1-deficient mice

Susana Rodriguez et al. Am J Physiol Regul Integr Comp Physiol. .

Abstract

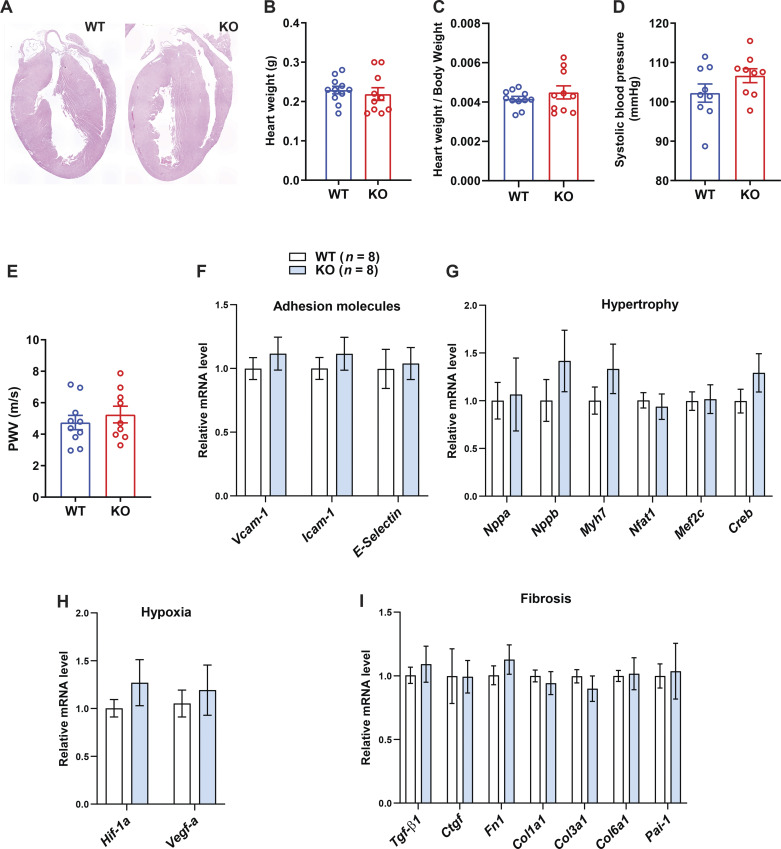
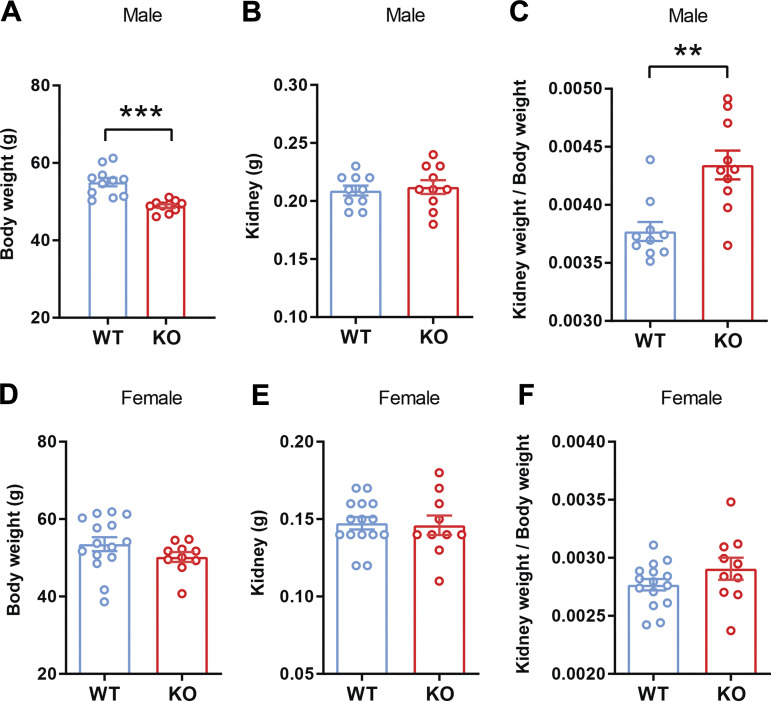
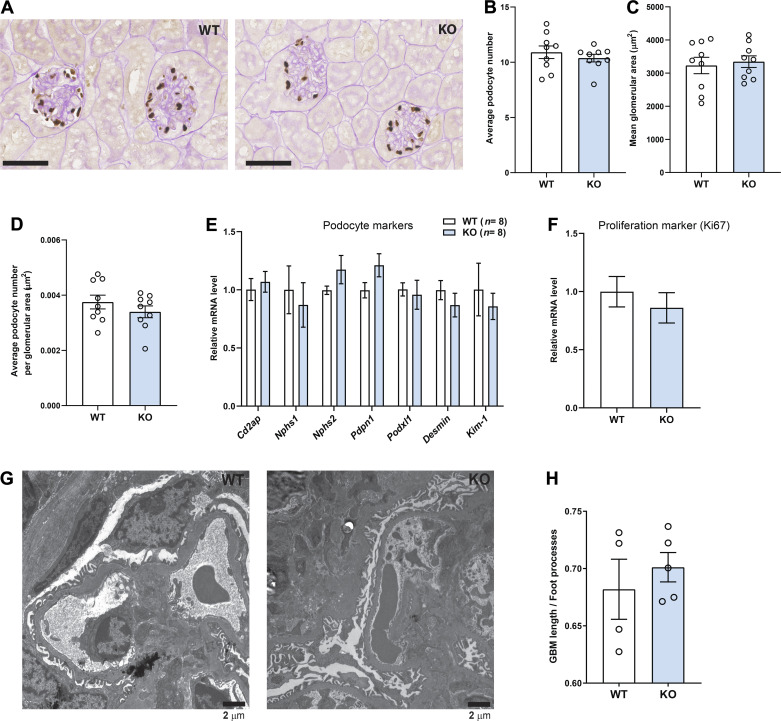
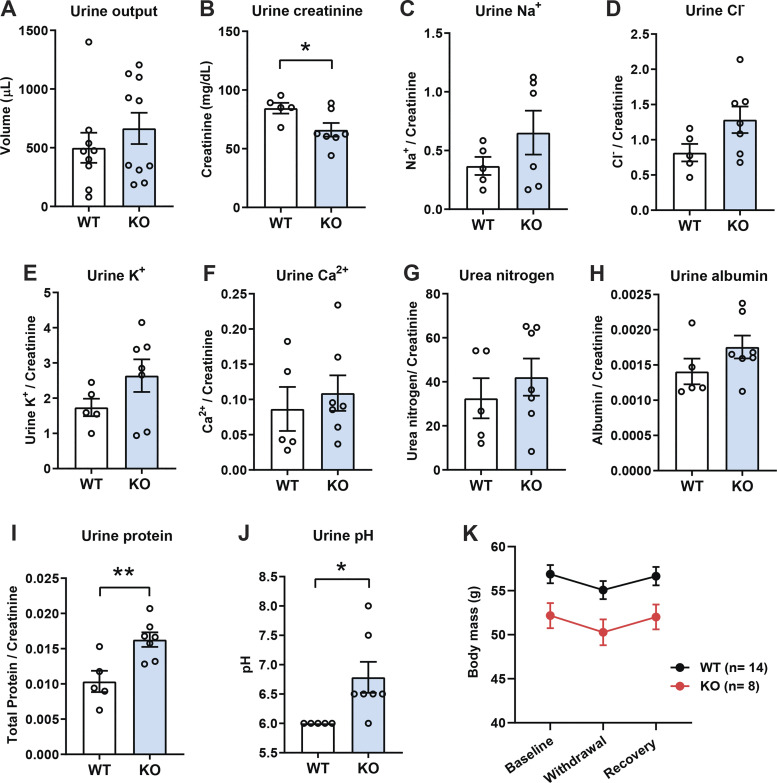
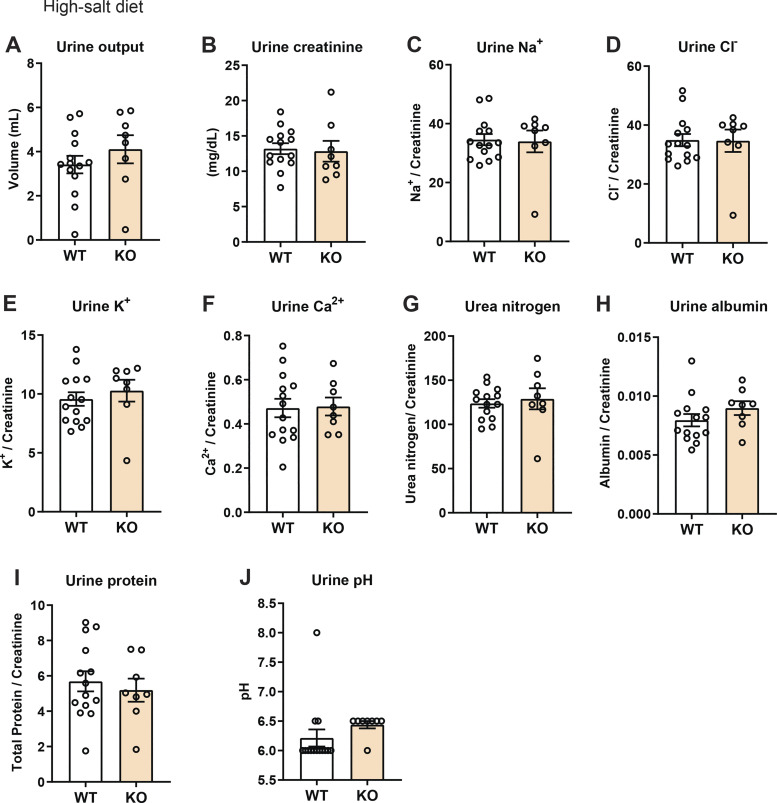
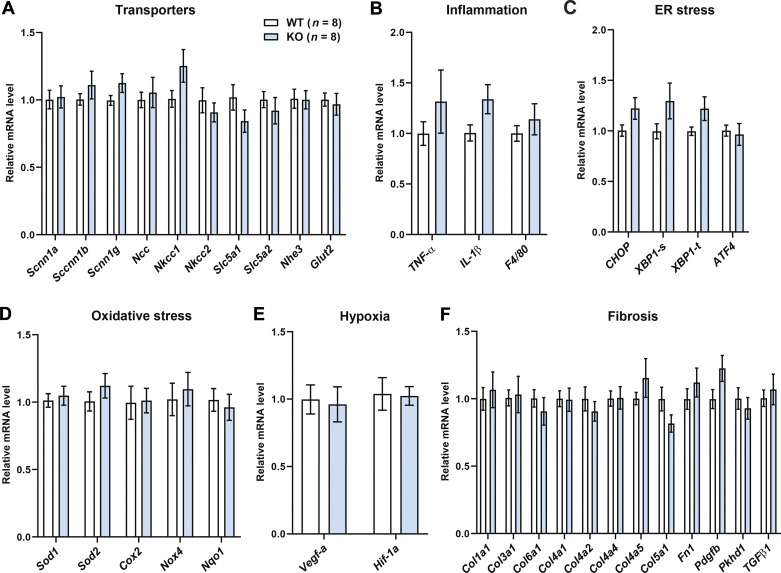
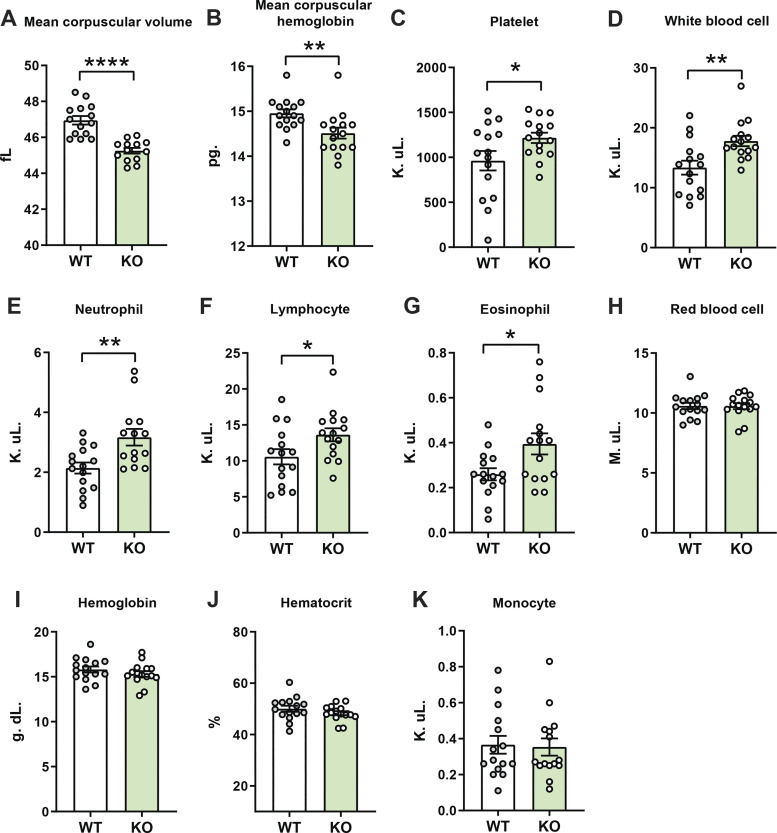
C1q/TNF-related protein 1 (CTRP1) is an endocrine factor with metabolic, cardiovascular, and renal functions. We previously showed that aged Ctrp1-knockout (KO) mice fed a control low-fat diet develop renal hypertrophy and dysfunction. Since aging and obesity adversely affect various organ systems, we hypothesized that aging, in combination with obesity induced by chronic high-fat feeding, would further exacerbate renal dysfunction in CTRP1-deficient animals. To test this, we fed wild-type and Ctrp1-KO mice a high-fat diet for 8 mo or longer. Contrary to our expectation, no differences were observed in blood pressure, heart function, or vascular stiffness between genotypes. Loss of CTRP1, however, resulted in an approximately twofold renal enlargement (relative to body weight), ∼60% increase in urinary total protein content, and elevated pH, and changes in renal gene expression affecting metabolism, signaling, transcription, cell adhesion, solute and metabolite transport, and inflammation. Assessment of glomerular integrity, the extent of podocyte foot process effacement, as well as renal response to water restriction and salt loading did not reveal significant differences between genotypes. Interestingly, blood platelet, white blood cell, neutrophil, lymphocyte, and eosinophil counts were significantly elevated, whereas mean corpuscular volume and hemoglobin were reduced in Ctrp1-KO mice. Cytokine profiling revealed increased circulating levels of CCL17 and TIMP-1 in KO mice. Compared with our previous study, current data suggest that chronic high-fat feeding affects renal phenotypes differently than similarly aged mice fed a control low-fat diet, highlighting a diet-dependent contribution of CTRP1 deficiency to age-related changes in renal structure and function.

Keywords: aging; heart; kidney; metabolism; obesity.


Conflict of interest statement

No conflicts of interest, financial or otherwise, are declared by the authors.

Figures

Figure 1.
Figure 1.
Heart function, vascular stiffness, and blood pressure in aged and obese Ctrp1-knockout (KO) male mice. A: representative hematoxylin-eosin (H&E)-stained heart histology of aged and obese wild-type (WT) and Ctrp1-KO mice fed a high-fat diet. B: heart weight of WT (n = 11) and Ctrp1-KO (n = 10) male mice (10 mo old) fed a high-fat diet. C: relative heart weight (normalized to body weight) of WT and KO male mice. D: systolic blood pressure measured via tail-vein cuff. E: pulse wave velocity (PWV) measurements of vascular stiffness. F–I: expression of genes involved in cell adhesion (F), hypertrophy (G), hypoxia (H), and fibrosis (I) in the heart of WT (n = 8) and Ctrp1-KO (n = 8) male mice (10 mo of age) fed a high-fat diet. All data are expressed as means ± SE. Col1a1, collagen type I α 1 chain; Creb, cAMP-response element binding protein; Ctgf, connective tissue growth factor; Fn1, fibronectin 1; Hif-1a, hypoxia inducible factor 1α; Icam-1, intercellular adhesion molecule; Mef2c, myocyte enhancer factor 2C; Myh7, myosin heavy chain β; Nfat1, nuclear factor of activated T-cells 1; Nppa, natriuretic peptide A; Nppb, natriuretic peptide B; Pai-1, plasminogen activator inhibitor 1; Tgf-β1, transforming growth factor-β1; Vcam-1, vascular adhesion molecule; Vegf-a, vascular endothelial growth factor α.
Figure 2.
Figure 2.
Aged and obese Ctrp1-knockout (KO) male mice have increased kidney weight relative to body weight. A: body weight of wild-type (WT; n = 11) and Ctrp1-KO (n = 10) male mice (10-mo old). B: kidney weight of WT (n = 11) and Ctrp1-KO (n = 10) male mice (10-mo old) fed a high-fat diet (HFD). C: kidney weight-to-body weight ratio of HFD-fed aged male mice. D: body weight of WT (n = 15) and Ctrp1-KO (n = 10) female mice (10-mo old). E: kidney weight of WT (n = 15) and Ctrp1-KO (n = 10) female mice (10-mo old) fed an HFD. F: kidney weight-to-body weight ratio of HFD-fed aged female mice. All data are expressed as means ± SE. **P < 0.01; ***P < 0.001 (2-tailed Student’s t tests).
Figure 3.
Figure 3.
Kidney glomerular parameters in aged and obese Ctrp1-knockout (KO) male mice. A: representative kidney histology (×40 magnification) of Ctrp1-KO male mice and wild-type (WT) littermate (10-mo old) fed a high-fat diet. Tissue sections were stained with podocyte-specific marker p57/Kip2, followed by periodic acid-Schiff (PAS) counterstaining. B–D: quantification of kidney podocyte number (B), glomeruli area (C), and podocyte number per glomerular area (D) in WT and Ctrp1-KO male mice (based on 6 random fields per slide from each mouse; n = 9 mice per genotype). Measurements were made in a blinded fashion. E–F: quantitative real-time PCR analysis of podocyte marker genes (E) and Ki67 (cell proliferation marker) (F) in the kidney of WT (n = 8) and Ctrp1-KO (n = 8) male mice (∼10 mo of age) fed a high-fat diet. Cd2ap, CD2 associated protein; Kim-1, kidney injury molecule 1; Nphs1, Nephrin; Nphs2, podocin; Pdpn1, podoplanin; Podxl1, podocalyxin-like 1. G: representative electron micrograph of WT and Ctrp1-KO glomerulus showing the glomerulus basement membrane (GBM) and podocyte foot processes. H: indexed podocyte foot processes to length of GBM. Quantifications were based on a total of 49 measurements in WT (n = 4 mice) and 42 measurements in Ctrp1-KO (n = 5 mice). All data are expressed as means ± SE.
Figure 4.
Figure 4.
Elevated urinary creatinine, total protein, and pH in aged and obese Ctrp1-knockout (KO) male mice. A–B: 24-h urine output (A) and urinary creatinine level (B) in wild-type (WT) and Ctrp1-KO male mice at ∼12 mo of age. C–J: 24-h urinary sodium (Na+) (C), chloride (Cl) (D), potassium (K+) (E), calcium (Ca2+) (F), nitrogen/urea (G), albumin (H), total protein (I), and pH (J) in WT and Ctrp1-KO male mice at ∼12 mo of age. K: renal response to water deprivation. Body mass of aged and obese HFD-fed WT (n = 14) and Ctrp1-KO (n = 8) male mice before (baseline) and after a 24-h water deprivation (withdrawal), and 24-h after water was re-introduced (recovery). All data are expressed as means ± SE. WT (n = 5–8 mice) and Ctrp1-KO (n = 7–10 mice). *P < 0.05, **P < 0.01 (2-tailed Student’s t tests).
Figure 5.
Figure 5.
Impact of salt loading (high-salt diet) on urine output and analytes in aged and obese Ctrp1-knockout (KO) male mice. A and B: 24-h urine output (A) and urinary creatinine level (B) in wild-type (WT) and Ctrp1-KO male mice (∼12 mo old) fed a high-salt diet for 2 wk. C–J: 24-h urinary sodium (Na+) (C), chloride (Cl) (D), potassium (K+) (E), calcium (Ca2+) (F), nitrogen/urea (G), albumin (H), total protein (I), and pH (J) in WT and Ctrp1-KO male mice fed a high-salt diet for 2 wk. All data are expressed as means ± SE. WT (n = 14 mice) and Ctrp1-KO (n = 8 mice).
Figure 6.
Figure 6.
Renal gene expression in aged and obese Ctrp1-knockout (KO) male mice. Expression of genes involved in sodium and potassium reabsorption (A), inflammation (B), ER stress (C), oxidative stress (D), hypoxia (E), and fibrosis (F) in the kidney of wild-type (WT) (n = 8) and Ctrp1-KO (n = 8) male mice (∼10 mo of age) fed a high-fat diet. All data are expressed as means ± SE. Atf4, activating transcription factor 4; Chop, C/EBP homologous protein; Col, collagen; Cox2, cyclooxygenase 2; F4/80, also known as adhesion G protein-coupled receptor E1 (Adgre1); EGFn1, fibronectin 1; Glut2, glucose transporter 2 (Slc2a2); Hif-1α, hypoxia-inducible factor 1 alpha; Il-1β, interleukin 1 beta; Ncc, sodium chloride co-transporter (Slc12a3); Nhe3, Sodium hydrogen exchanger 3; Nkcc, Na-K-Cl cotransporter; Nox4, NADPH oxidase 4; Nqo1, NADPH-quinone oxidoreductase 1; Pdgfb, platelet-derived growth factor b; Scnn1, sodium channel epithelial 1; Slc5a1, solute carrier family 5 (sodium/glucose co-transporter) member 1; Sod, superoxide dismutase; Tgf-β, transforming growth factor beta; Tnf-α, tumor necrosis factor α; Vegf-a, vascular endothelial growth factor α; Xbp-1, X-box binding protein 1.
Figure 7.
Figure 7.
Altered circulating levels of immune cells in aged and obese Ctrp1-knockout (KO) male mice. Complete blood count of wild-type (WT) (n = 15) and Ctrp1-KO (n = 15) male mice. At the time of sample collection, high-fat diet (HFD)-fed mice were ∼1-yr old. A: mean corpuscular volume. B: mean corpuscular hemoglobin. C: platelet. D: white blood cell. E: neutrophil. F: lymphocyte. G: eosinophil. H: red blood cell. I: hemoglobin. J: hematocrit. K: monocyte. All data are expressed as means ± SE. *P < 0.05, **P < 0.01, and ****P < 0.0001 (two-tailed Student’s t tests).

Similar articles

Cited by

References

    1. Akchurin OM, Kaskel F. Update on inflammation in chronic kidney disease. Blood Purif 39: 84–92, 2015. doi:10.1159/000368940. - DOI - PubMed
    1. Anders S, Pyl PT, Huber W. HTSeq—a Python framework to work with high-throughput sequencing data. Bioinformatics 31: 166–169, 2015. doi:10.1093/bioinformatics/btu638. - DOI - PMC - PubMed
    1. Bai B, Ban B, Liu Z, Zhang MM, Tan BK, Chen J. Circulating C1q complement/TNF-related protein (CTRP) 1, CTRP9, CTRP12 and CTRP13 concentrations in type 2 diabetes mellitus: in vivo regulation by glucose. PLoS One 12: e0172271, 2017. doi:10.1371/journal.pone.0172271. - DOI - PMC - PubMed
    1. Camici M, Galetta F, Abraham N, Carpi A. Obesity-related glomerulopathy and podocyte injury: a mini review. Front Biosci (Elite Ed) 4: 1058–1070, 2012. - PMC - PubMed
    1. Cepeda-Lopez AC, Aeberli I, Zimmermann MB. Does obesity increase risk for iron deficiency? A review of the literature and the potential mechanisms. Int J Vitam Nutr Res 80: 263–270, 2010. doi:10.1024/0300-9831/a000033. - DOI - PubMed

Publication types

MeSH terms