. 2020 Nov 4;12(44):49335-49345.
doi: 10.1021/acsami.0c12020. Epub 2020 Oct 21.

Continuous-Flow Production of Perfluorocarbon-Loaded Polymeric Nanoparticles: From the Bench to Clinic

Affiliations

Continuous-Flow Production of Perfluorocarbon-Loaded Polymeric Nanoparticles: From the Bench to Clinic

Esmee Hoogendijk et al. ACS Appl Mater Interfaces. .

Abstract

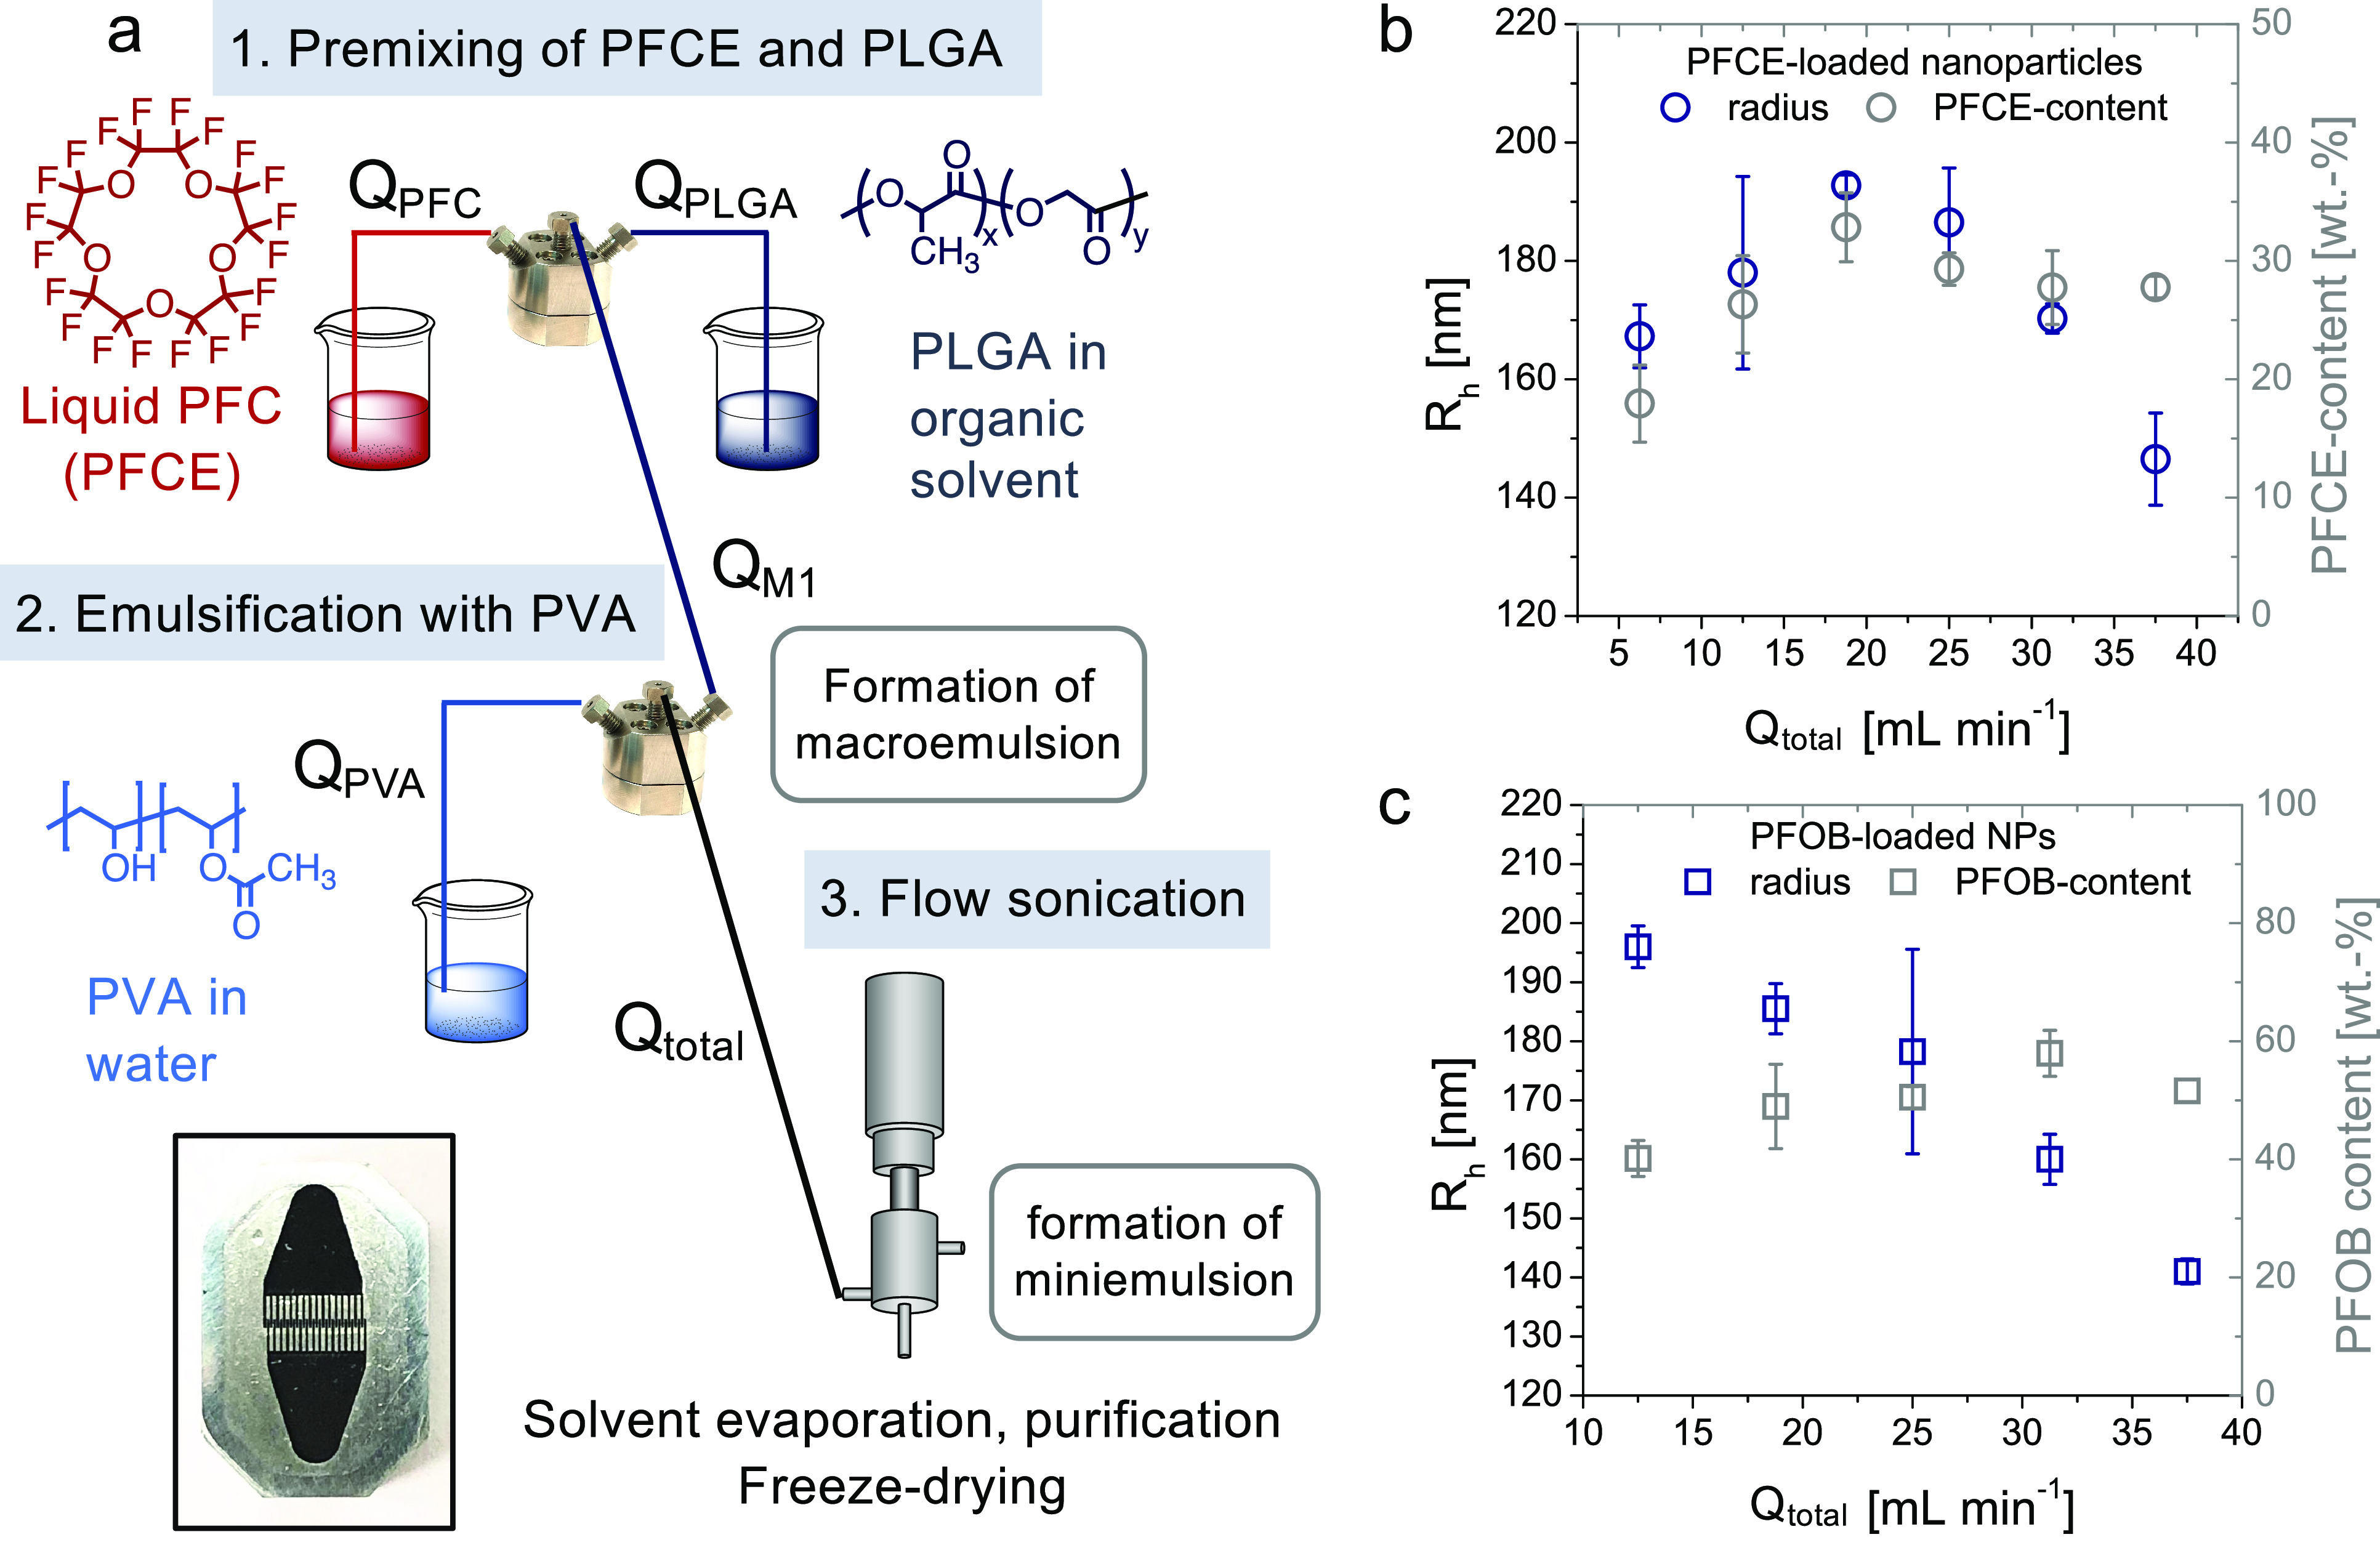
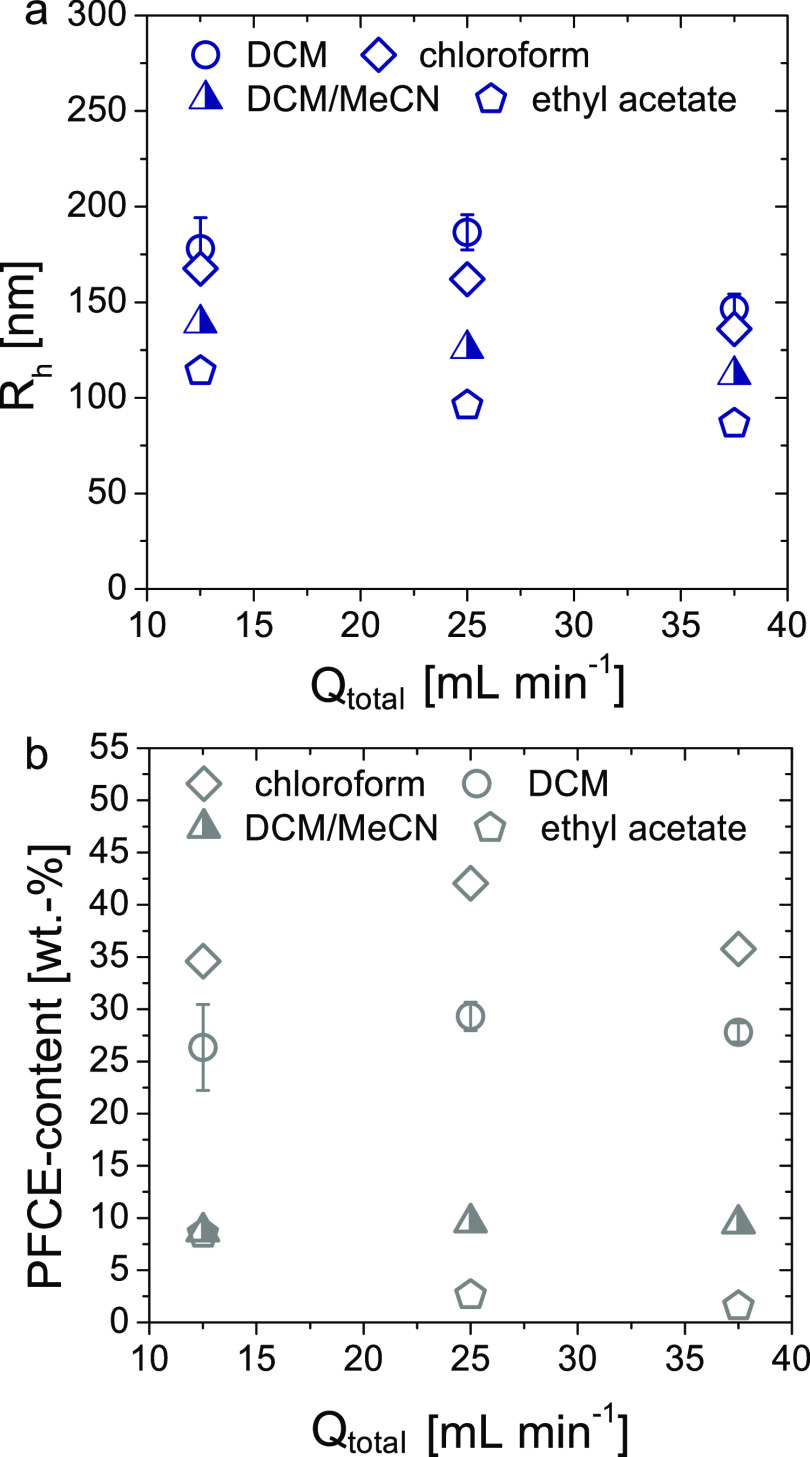
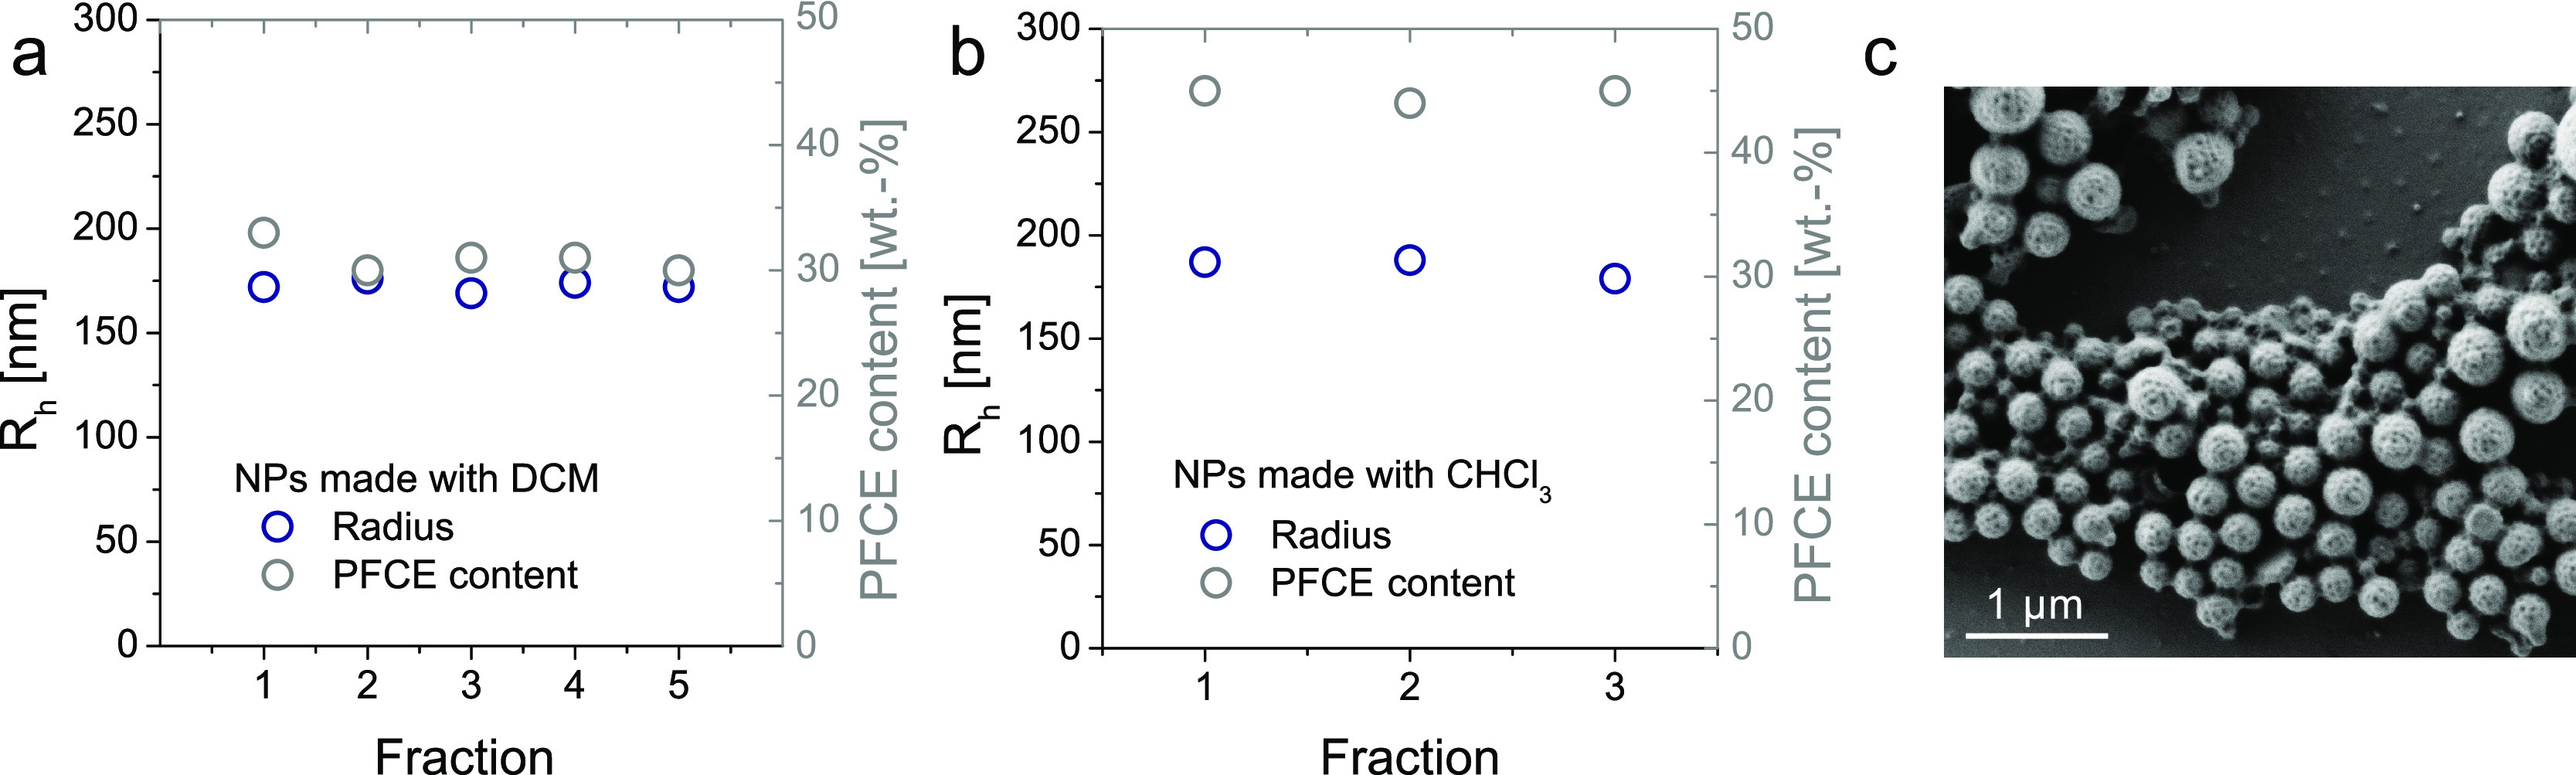
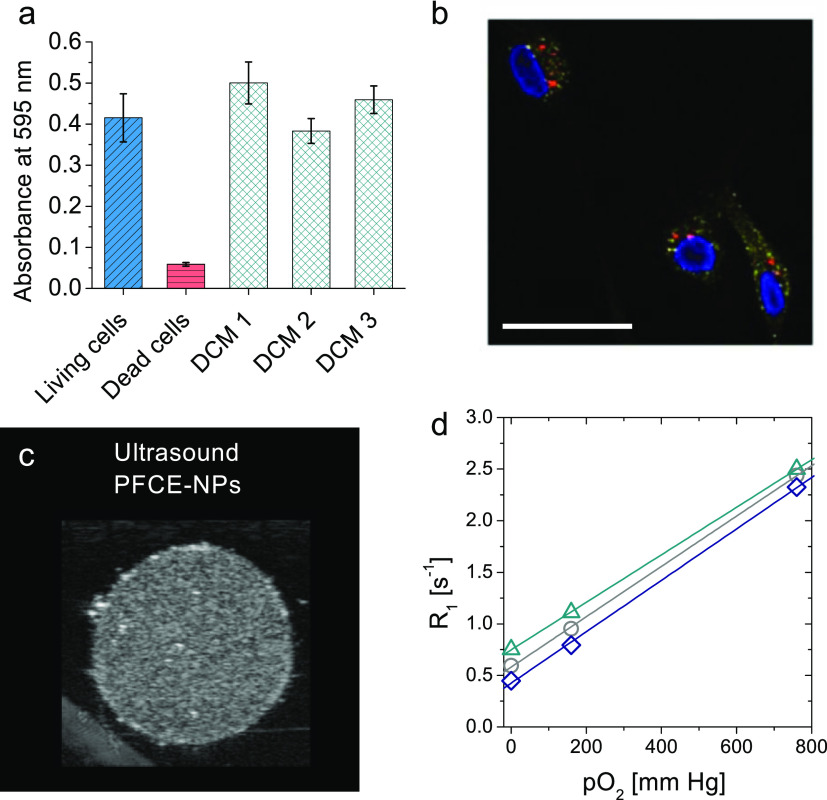
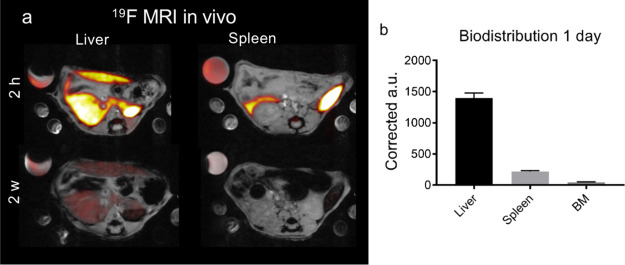
Perfluorocarbon-loaded nanoparticles are powerful theranostic agents, which are used in the therapy of cancer and stroke and as imaging agents for ultrasound and 19F magnetic resonance imaging (MRI). Scaling up the production of perfluorocarbon-loaded nanoparticles is essential for clinical translation. However, it represents a major challenge as perfluorocarbons are hydrophobic and lipophobic. We developed a method for continuous-flow production of perfluorocarbon-loaded poly(lactic-co-glycolic acid) (PLGA) nanoparticles using a modular microfluidic system, with sufficient yields for clinical use. We combined two slit interdigital micromixers with a sonication flow cell to achieve efficient mixing of three phases: liquid perfluorocarbon, PLGA in organic solvent, and aqueous surfactant solution. The production rate was at least 30 times higher than with the conventional formulation. The characteristics of nanoparticles can be adjusted by changing the flow rates and type of solvent, resulting in a high PFC loading of 20-60 wt % and radii below 200 nm. The nanoparticles are nontoxic, suitable for 19F MRI and ultrasound imaging, and can dissolve oxygen. In vivo 19F MRI with perfluoro-15-crown-5 ether-loaded nanoparticles showed similar biodistribution as nanoparticles made with the conventional method and a fast clearance from the organs. Overall, we developed a continuous, modular method for scaled-up production of perfluorocarbon-loaded nanoparticles that can be potentially adapted for the production of other multiphase systems. Thus, it will facilitate the clinical translation of theranostic agents in the future.

Keywords: 19F MRI; cell tracking; microfluidics; multimodal imaging; nanoparticles; oxygen carriers; perfluorocarbon; ultrasound.


Conflict of interest statement

The authors declare no competing financial interest.

Figures

Figure 1
Figure 1
(a) Schematic overview of the microfluidic setup. The first step is mixing of the PFC (flow rate QPFC) with the organic solution of the polymer (flow rate QPLGA) in the first micromixer. The resulting mixture M1 then proceeds to the second micromixer, where it is emulsified with an aqueous surfactant solution (here PVA, flow rate QPVA). This emulsion (flow rate Qtotal) flows to the sonication flow cell for active mixing. Ultracompact high-pressure pumps are not shown for simplicity. Inset: Mixing inlay of SIMM V2. (b,c) Encapsulation of PFCE (b) and PFOB (c) with the microfluidic setup. Hydrodynamic radius (DLS, blue, c(NP) = 0.1 mg mL–1) and PFC content [NMR, grey, in D2O with trifluoroacetic acid (TFA) as an internal reference, 5–10 mg in 600 μL of D2O, 378 MHz] at different total flow rates Qtotal are shown. The flow rate ratios between single phases were kept constant (compare Table S3). For encapsulation of PFCE, (b) size and PFCE content first increase and then decrease with increasing flow rate. For PFOB (c), an increasing flow rate results in the decrease in hydrodynamic radius and in the increase of PFOB encapsulation (compare Table S4). Error bars represent the standard deviation between the results obtained from two independent batches of particles that were produced on different days (see also Table S9 for additional results of NPs produced with the addition of a fluorophore).
Figure 2
Figure 2
Effect of the organic solvent on size and PFCE encapsulation. (a) Radius [DLS, blue, c(NP) = 0.1 mg mL–1] and (b) PFCE encapsulation versus total flow rate through the system Qtotal [NMR, grey, TFA as an internal reference, D2O, 378 MHz] of NPs synthesized with chloroform, ethyl acetate, and a mixture of DCM/MeCN in comparison with DCM are shown. For all solvents, three different flow rates were tested. The sizes of NPs are decreasing with increasing polarity of the solvent. The encapsulation of PFCE was higher in chloroform compared to DCM. In contrast, the use of DCM/MeCN mixture or ethyl acetate resulted in a lower PFCE encapsulation.
Figure 3
Figure 3
Reproducibility of the production of PFCE–PLGA NPs with the microfluidic system. (a) Radius [DLS, blue, c(NP) = 0.1 mg mL–1] and (b) PFCE encapsulation (NMR, grey TFA as an internal reference, 5–10 mg in 600 μL of D2O, 378 MHz) of single fractions. (c) SEM micrograph of NPs prepared using chloroform revealed that the majority of NPs have a radius between 100 and 200 nm. Scale bar 1 μm.
Figure 4
Figure 4
NPs can act as multimodal imaging agents and oxygen carriers. (a) Cell viability assay after incubation with PFCE–PLGA NPs for 24 h (prepared using DCM) showed that PFCE–PLGA NPs did not affect cell viability. DCM1/2/3 corresponds to different batches of NPs produced with DCM as a solvent (see Table S8 for characteristics of NPs and Figure S3 for NPs made with chloroform). (b) confocal microscopy images of NP uptake by moDCs. Fluorescent signal coming from the NPs (red) partially overlaps with the signal of the early endosomal marker EEA1. Scale bar 25 μm (c) ultrasound of NP dispersion (sample PFCE16) in gel phantom shows acoustic contrast to the surrounding gel (see Figure S6 for different samples & Table S10 for details on NPs). The settings were similar to the settings that are used for the imaging of PFCE–PLGA NPs prepared with the conventional method indicating that NPs should be suitable for in vivo imaging. c(NP) = 10 mg mL–1, 21 MHz, 50 dB. (d) 19F longitudinal relaxivity R1 changes with oxygen pressure indicating loading with oxygen. Relaxivity of three different 19F-groups at different oxygen pressures is shown. NPs at pO2 = 0 mm Hg were saturated with Ar; another sample was measured at ambient pressure and the third one was saturated with oxygen. Lines correspond to linear fits of the data points, demonstrating the linear trend of the data (R2 ≥ 0.999). NPs in D2O, 378 MHz. Compare SI for further images and NPs characteristics (Tables S8–S11, Figures S3–S7).
Figure 5
Figure 5
In vivo biodistribution and clearance of PFCE–PLGA NPs by 19F MRI (sample produced during the longer run of the system, compare Table S6). (a) Transversal 19F MRI images (red hot) overlaid on 1H MRI (grey scale) images of the liver and spleen 2 h (upper row) and 2 weeks (lower row) after the i.v. injection of 20 mg of PFCE–PLGA NPs. After 2 h NPs were mainly located in the liver and spleen. After 2 weeks, NPs show significant clearance from the organs. Note the varying reference tube signal because of the partial volume effect, and images are scaled identical. (b) Graph showing a biodistribution of NPs in the liver, spleen, and bone marrow of the thoracoabdominal part of the spine (BM) at day 1. The signal of the imaging agent is reported in corrected arbitrary units based on the signal from the reference tube. 11.7 T.

References

    1. Cheng Y.; Cheng H.; Jiang C.; Qiu X.; Wang K.; Huan W.; Yuan A.; Wu J.; Hu Y. Perfluorocarbon Nanoparticles Enhance Reactive Oxygen Levels and Tumour Growth Inhibition in Photodynamic Therapy. Nat. Commun. 2015, 6, 8785.10.1038/ncomms9785. - DOI - PMC - PubMed
    1. Liu J.; Chen Q.; Feng L.; Liu Z. Nanomedicine for Tumor Microenvironment Modulation and Cancer Treatment Enhancement. Nano Today 2018, 21, 55–73. 10.1016/j.nantod.2018.06.008. - DOI
    1. Hu D.; Zhong L.; Wang M.; Li H.; Qu Y.; Liu Q.; Han R.; Yuan L.; Shi K.; Peng J.; Qian Z. Perfluorocarbon-Loaded and Redox-Activatable Photosensitizing Agent with Oxygen Supply for Enhancement of Fluorescence/Photoacoustic Imaging Guided Tumor Photodynamic Therapy. Adv. Funct. Mater. 2019, 29, 1806199.10.1002/adfm.201806199. - DOI
    1. Ren H.; Liu J.; Su F.; Ge S.; Yuan A.; Dai W.; Wu J.; Hu Y. Relighting Photosensitizers by Synergistic Integration of Albumin and Perfluorocarbon for Enhanced Photodynamic Therapy. ACS Appl. Mater. Interfaces 2017, 9, 3463–3473. 10.1021/acsami.6b14885. - DOI - PubMed
    1. Wang W.; Cheng Y.; Yu P.; Wang H.; Zhang Y.; Xu H.; Ye Q.; Yuan A.; Hu Y.; Wu J. Perfluorocarbon Regulates the Intratumoural Environment to Enhance Hypoxia-based Agent Efficacy. Nat. Commun. 2019, 10, 1580.10.1038/s41467-019-09389-2. - DOI - PMC - PubMed

Substances