. 2020 Dec 15;53(6):1202-1214.e6.
doi: 10.1016/j.immuni.2020.10.002. Epub 2020 Oct 20.

Regulatory T Cell-Derived TGF-β1 Controls Multiple Checkpoints Governing Allergy and Autoimmunity

Affiliations

Regulatory T Cell-Derived TGF-β1 Controls Multiple Checkpoints Governing Allergy and Autoimmunity

Jacob A Turner et al. Immunity. .

Erratum in

  • Regulatory T Cell-Derived TGF-β1 Controls Multiple Checkpoints Governing Allergy and Autoimmunity.
    Turner JA, Stephen-Victor E, Wang S, Rivas MN, Abdel-Gadir A, Harb H, Cui Y, Fanny M, Charbonnier LM, Hung Fong JJ, Benamar M, Wang L, Burton OT, Bansal K, Bry L, Zhu C, Li QZ, Clement RL, Oettgen HC, Crestani E, Rachid R, Sage PT, Chatila TA. Turner JA, et al. Immunity. 2020 Dec 15;53(6):1331-1332. doi: 10.1016/j.immuni.2020.11.011. Immunity. 2020. PMID: 33326768 Free PMC article. No abstract available.

Abstract

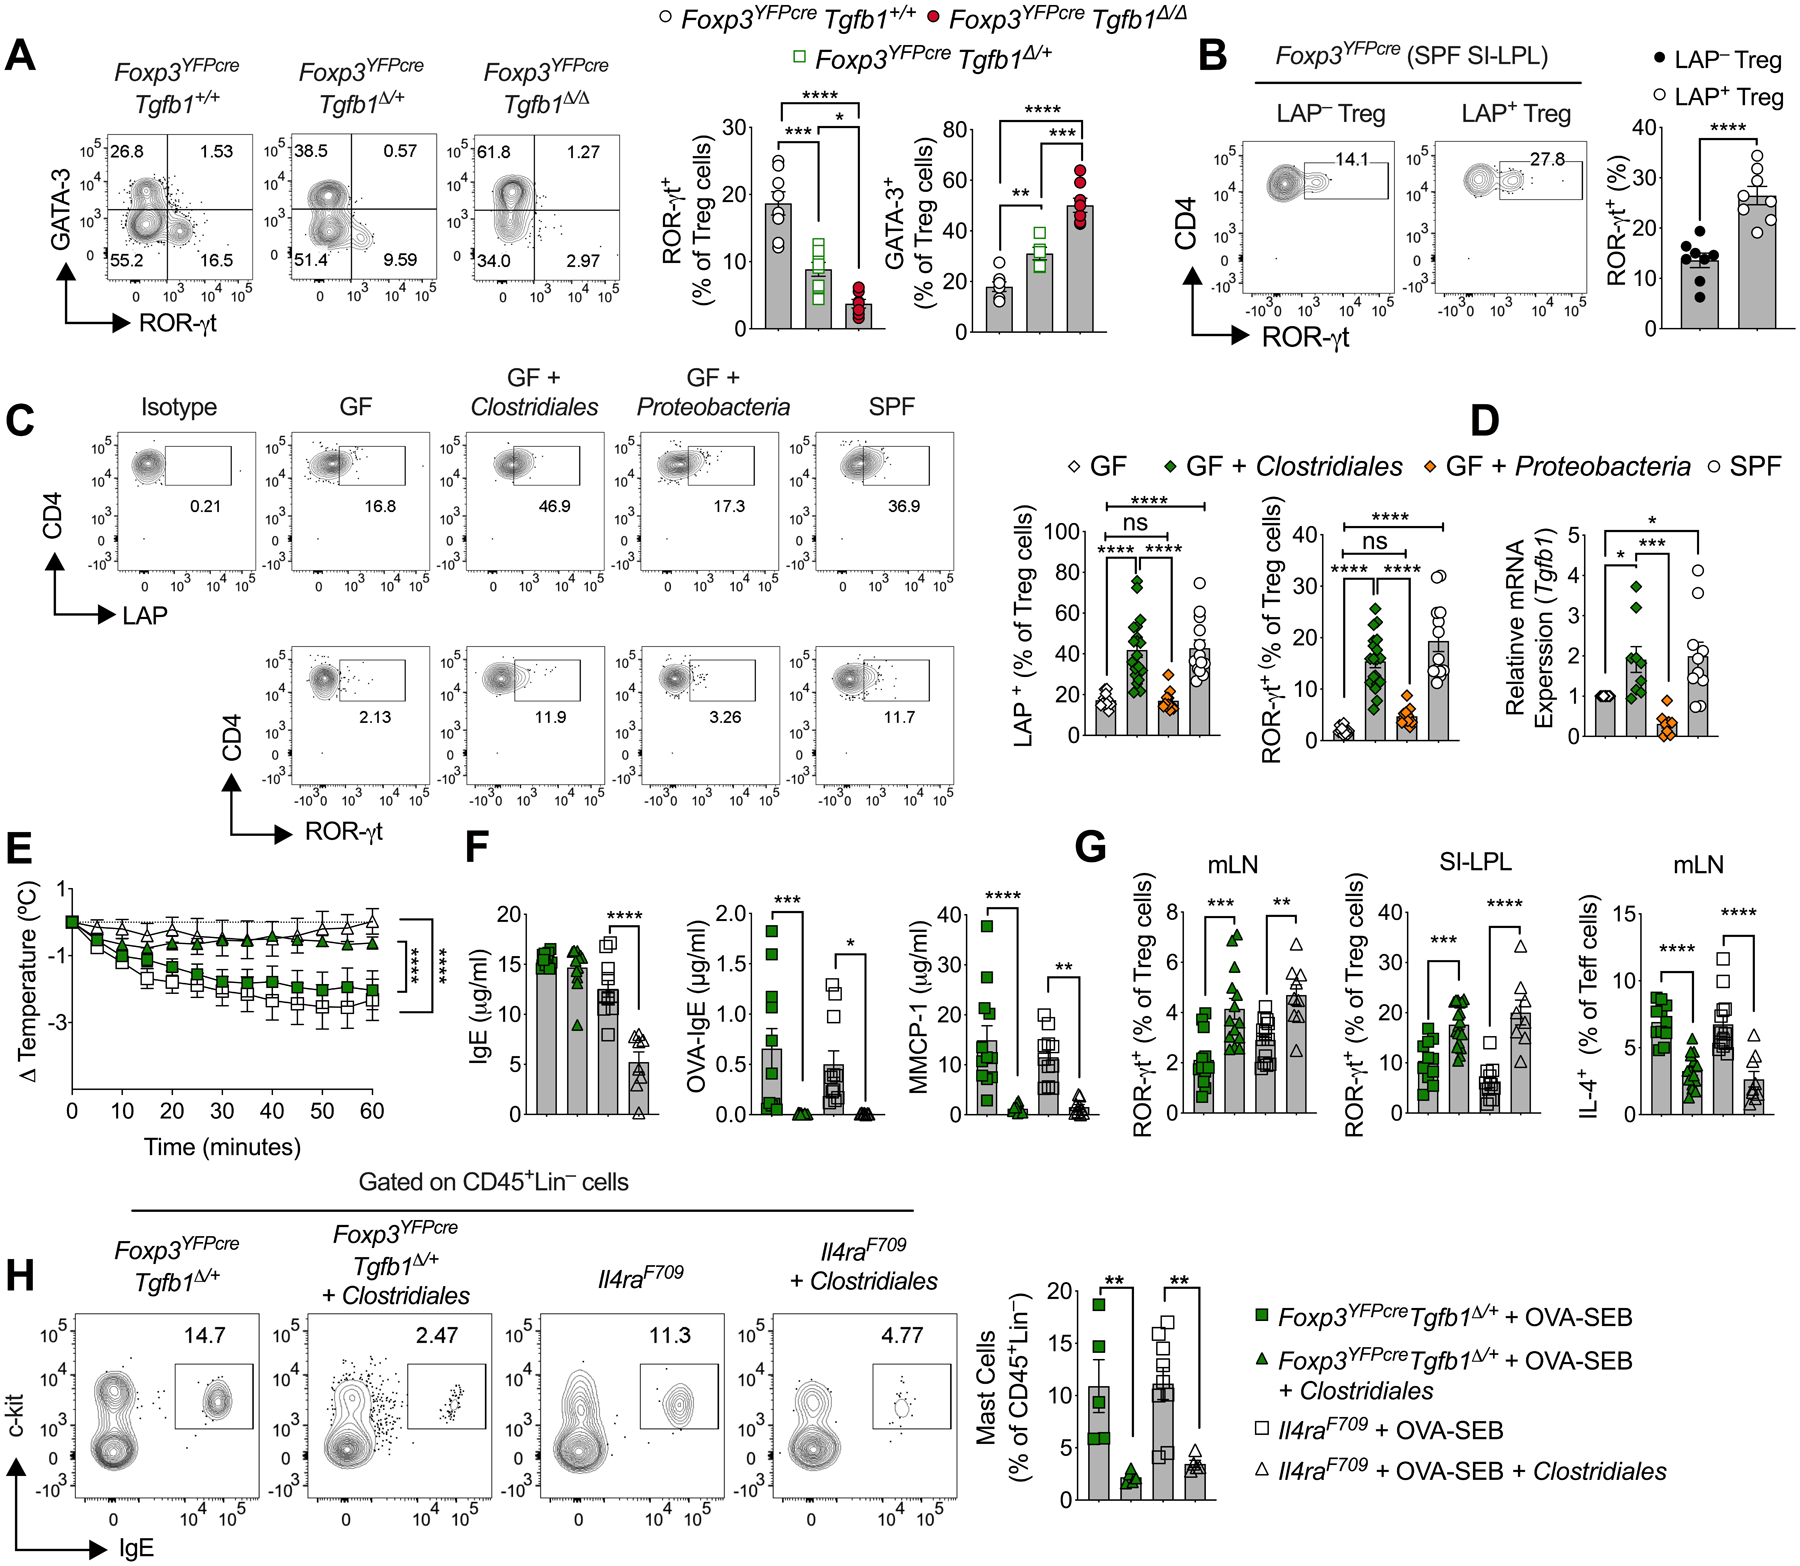
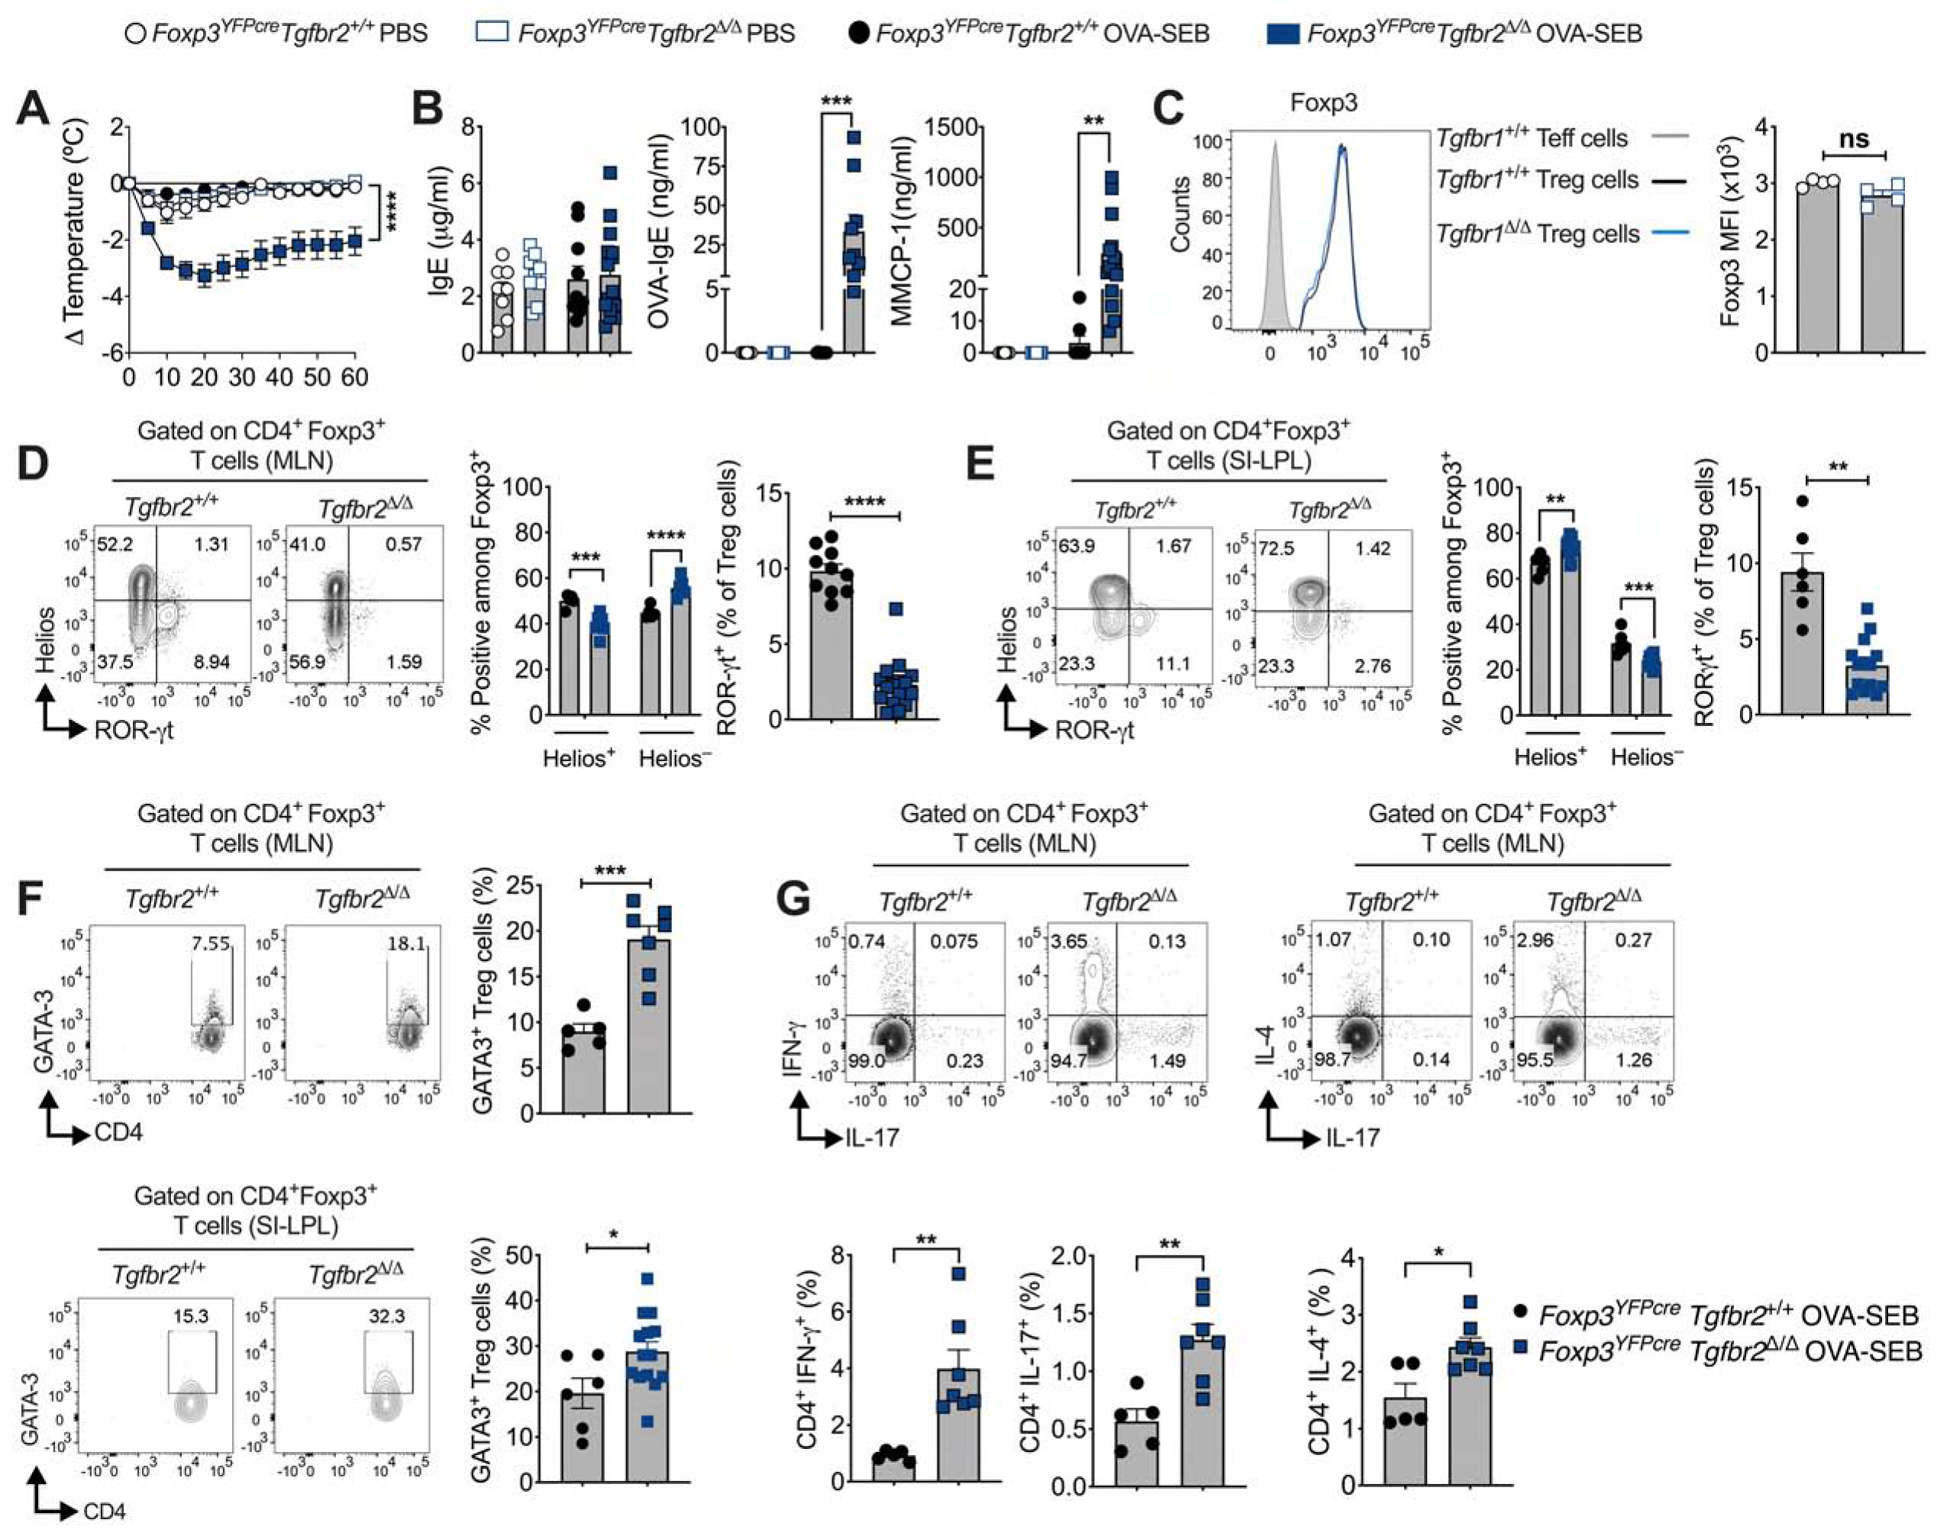
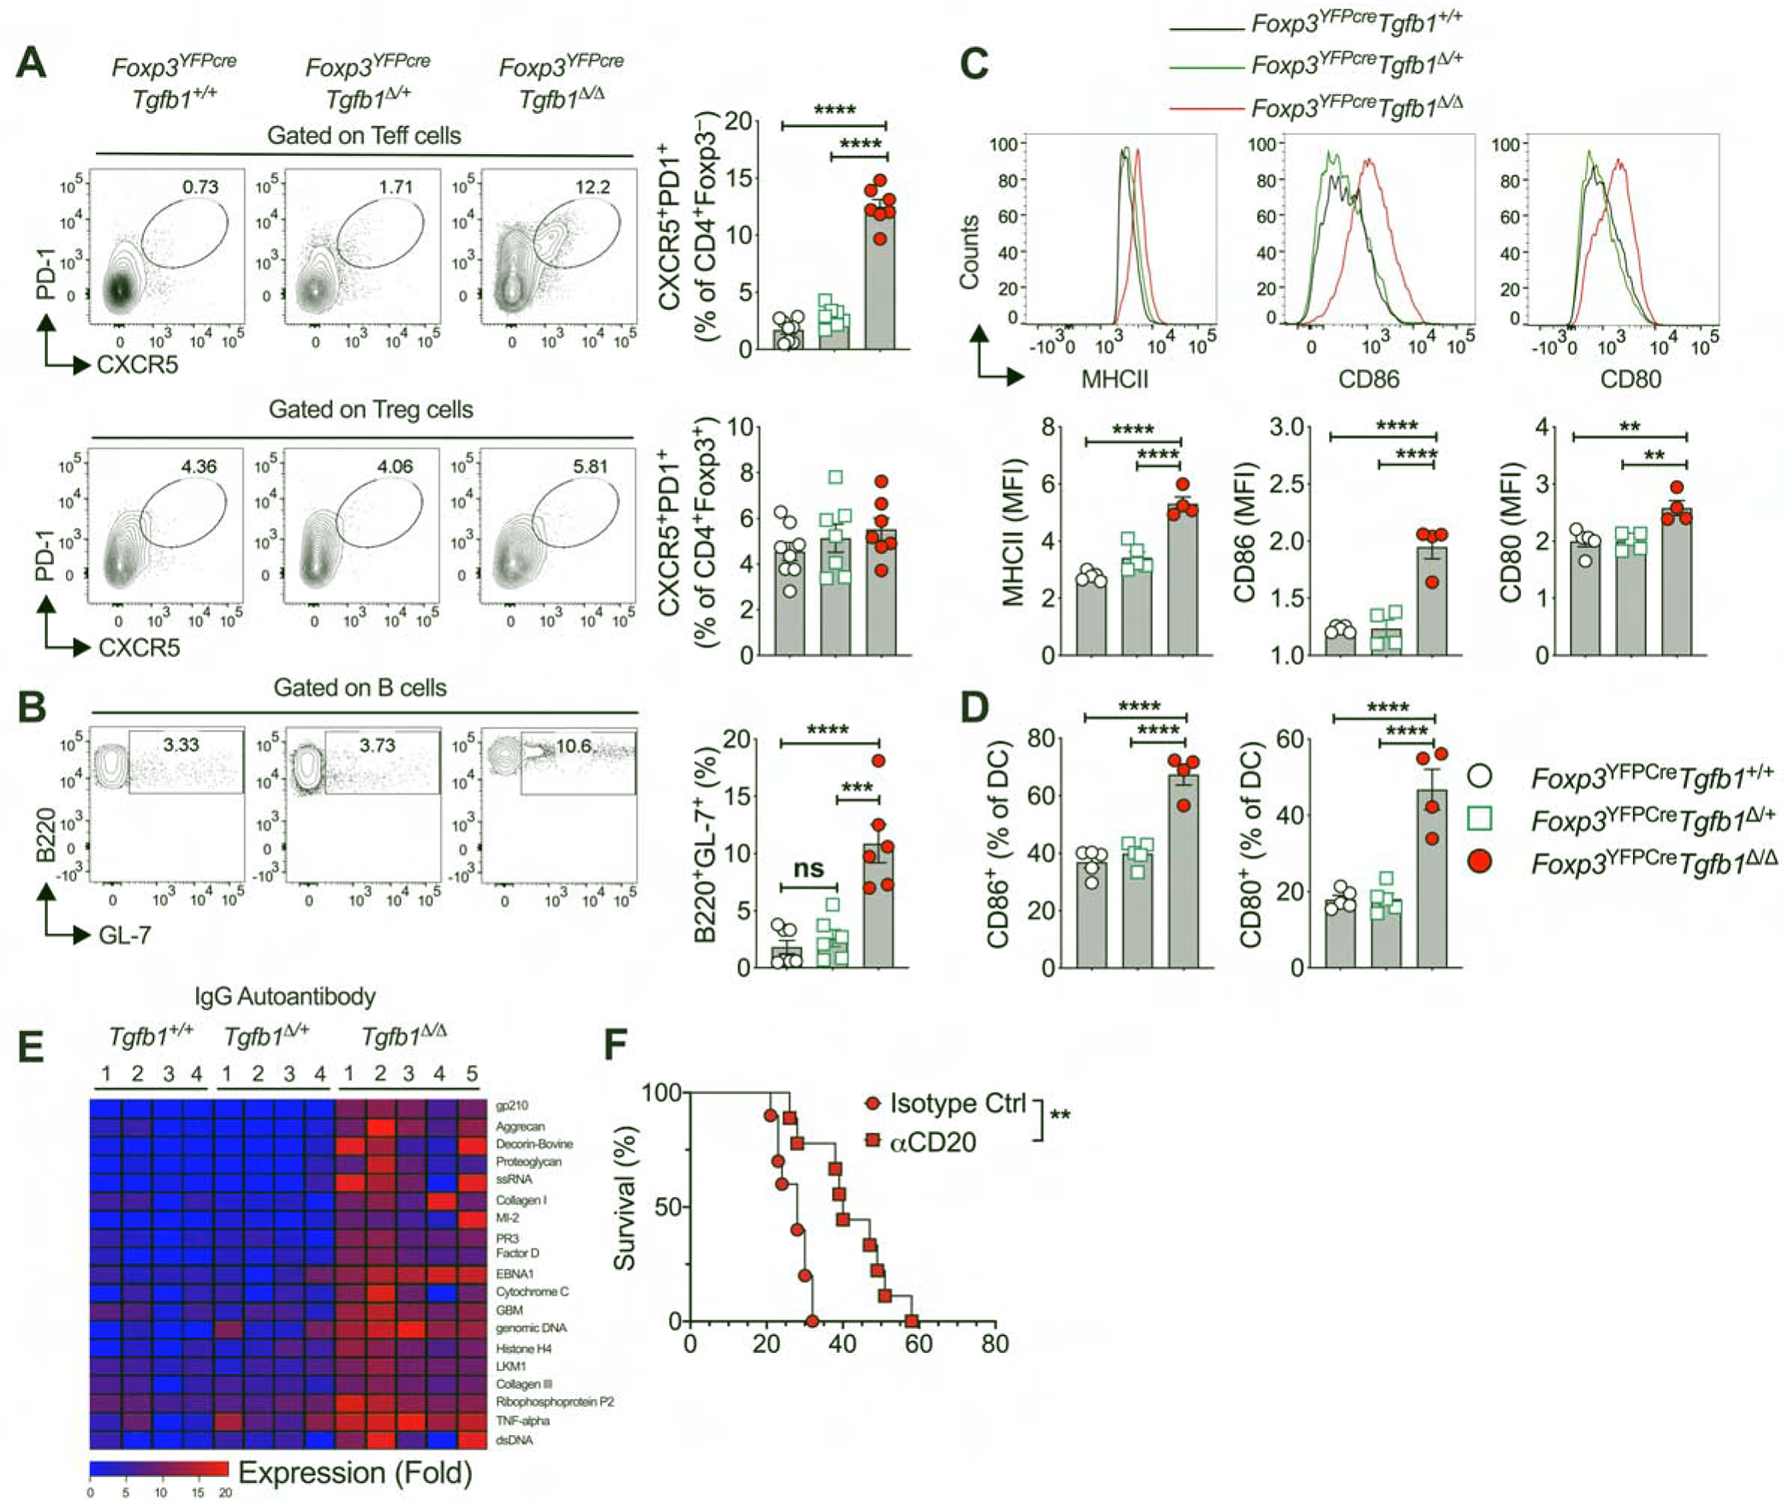
The mechanisms by which regulatory T (Treg) cells differentially control allergic and autoimmune responses remain unclear. We show that Treg cells in food allergy (FA) had decreased expression of transforming growth factor beta 1 (TGF-β1) because of interleukin-4 (IL-4)- and signal transducer and activator of transciription-6 (STAT6)-dependent inhibition of Tgfb1 transcription. These changes were modeled by Treg cell-specific Tgfb1 monoallelic inactivation, which induced allergic dysregulation by impairing microbiota-dependent retinoic acid receptor-related orphan receptor gamma t (ROR-γt)+ Treg cell differentiation. This dysregulation was rescued by treatment with Clostridiales species, which upregulated Tgfb1 expression in Treg cells. Biallelic deficiency precipitated fatal autoimmunity with intense autoantibody production and dysregulated T follicular helper and B cell responses. These results identify a privileged role of Treg cell-derived TGF-β1 in regulating allergy and autoimmunity at distinct checkpoints in a Tgfb1 gene dose- and microbiota-dependent manner.

Keywords: ROR-γt; T follicular helper cells; TGF-β; allergy; autoimmunity; checkpoint; food allergy; mast cells; microbiota; regulatory T cells.


Conflict of interest statement

Declaration of Interests L.B., T.C., A.A.-G., and R.R. are inventors on published US patent no. US10391131B2, submitted by The Brigham and Women’s Hospital, Inc. and Children’s Medical Center Corporation, which covers methods and compositions for prevention and treatment of food allergy using microbial treatments. T.C, E.S.-V., A.A.-G. and R.R. have pending patent applications related to the use of probiotics in enforcing oral tolerance in food allergy (no. 62/798,224). L.B., T.C., and R.R. are co-founders of and/or have equity in Paretobio.

Figures

Fig. 1.
Fig. 1.. Suppression of Tgfb1 expression by IL-4R signaling in Treg cells.
(A) ATAC-seq analysis of the Tgfb1 locus in Treg cells of the respective genotypes. (B) ChIP assays for the binding of STAT6, H3K4me1, H3K27me3 and control (IgG) antibodies to the Tgfb1 promoter in Treg cells of Foxp3YFPcre mice. (C) Luciferase reporter assays for Tgfb1 promoters with or without STAT6 binding site treated as indicated (D) RT-PCR of Tgfb1 transcripts in splenic Treg and Teff cells sorted from Foxp3YFPcre and Foxp3YFPcreIl4raF709 sham and OVA-SEB sensitized mice. Transcript expression in CD4+ Teff cells is also shown. (E) Tgfb1–3 transcripts in Foxp3YFPcre, Foxp3YFPcreIl4raF709, Foxp3YFPcreIl4raF709 Il4-l13Δ/Δ and Foxp3YFPcreIl4raF709Stat6−/− splenic Treg cells, the latter either sufficient of deficient in Il4-l13 or Stat6. (F) Flow cytometric analysis and frequencies of LAP+ staining in Treg cells sorted from the respective mouse strains. (G) Fow cytometry (FACS) plots showing the gating strategy for human Treg and Teff cells. (H) LAP staining on Treg cells isolated from PBMCs of FA, atopics without FA and healthy subjects. Each symbol represents an independent sample. Numbers in flow plots indicate percentages. Error bars indicate SEM. Statistical tests: Student’s t-test (B), two-way ANOVA (C); One-way ANOVA with Dunnett’s post hoc analysis (D, E, F, G). *P<0.05, **P<0.01, ***P<0.001, ****P<0.0001. Data representative of two or three independent experiments. n=5–13 mice per group (B), 11 replicates per group (C), 4–14 mice per group for panels (D, E, F), and 6 to 26 subjects for panel G. Please also see Figure S1.
Fig. 2.
Fig. 2.. Treg cell-specific Tgfb1 haploinsufficiency promotes allergic dysregulation.
(A) Core body temperature drop following OVA challenge of OVA/SEB sensitized WT, Il4raF709 and Foxp3YFPcreTgfb1Δ/+ mice. (B) Serum total and OVA-specific IgE and MMCP-1, mast cell counts from the histology of the small intestinal (C) Microscopic pictures (original magnification; x600) of toluidine blue stained histological sections from the jejunum of mice sensitized and challenged in (A). Arrows indicate mast cells. (D) Flow cytometric analysis of mast cells in the SI-LPL of mice challenged in (A). (E, G) Flow cytometric analysis and frequencies of Helios+ and Helios Treg cells (E) IL-4+ (F) and GATA-3+ (G) Treg and Teff cells in SI-LPL of mice from panel (A). Each symbol represents an independent sample. Numbers in flow plots indicate percentages. Error bars indicate SEM. Statistical tests: repeat measure two-way ANOVA (A); One-way ANOVA with Dunnett’s post hoc analysis (B, E, F). *P<0.05, **P<0.01, ***P<0.001, ****P<0.0001. Data representative of at least three independent experiments with 9–31 mice per group for (A) and 5–17 mice per group for panels (B, E, F, G). *p<0.05, **p<0.01 and p****<0.0001.
Fig. 3.
Fig. 3.. Treg cell-derived TGF-β1 enables oral tolerance by promoting ROR-γt+ gut Treg cell differentiation.
(A) Flow cytometric analysis and cell frequencies of ROR-γt and GATA3 staining in SI-LPL Treg cells isolated from 4-week-old Foxp3YFPcre, Foxp3YFPcreTgfb1Δ/+, Foxp3YFPcreTgfb1Δ/Δ mice strains. (B) Flow cytometric analysis and cell frequencies of ROR-γt expression in LAP+ and LAP SI-LPL Treg cells. (C) Flow cytometric analysis and cell frequencies of LAP and ROR-γt expression in SI-LPL Treg cells of GF mice, GF mice reconstituted with Clostridiales or Proteobacteria consortia and SPF mice. (D) RT-PCR analysis of Tgfb1 mRNA expression in the mouse groups in (C). (E) Temperature changes in OVA/SEB-sensitized Foxp3YFPcreTgfb1Δ/+ and Il4raF709 mice that were either left untreated or treated with the Clostridiales during sensitization then challenged with OVA. (F) Serum total and OVA-specific IgE and serum MMCP-1. (G) Frequencies of ROR-γt+ Treg cells in the MLN and SI-LPL and of IL-4+ Treg cells in the MLN of the mouse groups in (E). (H) Flow cytometric analysis of SI c-Kit+FcεRI+ mast cells and their frequencies in the mouse groups in (E). Each symbol represents an independent sample. Numbers in flow plots indicate percentages. Error bars indicate SEM. Statistical tests: One-way ANOVA with Dunnett’s post hoc analysis (A-D, F-H); repeat measure two-way ANOVA (E); *P<0.05, **P<0.01, ***P<0.001, ****P<0.0001. Data representative of at least three independent experiments with 5–8 mice per group for (A and B) and 4–19 mice for (C, E to H).
Fig. 4.
Fig. 4.. Treg cell-specific Tgfbr2-deficiency impairs oral tolerance.
(A) Core body temperature drop following OVA challenge of OVA-SEB sensitized WT and Foxp3YFPcreTgfbr2Δ/Δ mice. (B) Serum concentrations of IgE, OVA-specific IgE, and MMCP-1. (C) Flow cytometric analysis of mean fluorescence intensity (MFI) of Foxp3 in Treg cells isolated from MLN. (D and E) Flow cytometric analysis and frequencies of Helios+, Helios and ROR-γt+ cells among CD4+Foxp3+ Treg cells from MLN (D) and SI-LPL (E) of mice from panel (A). (F) Flow cytometric analysis and frequencies of GATA3+ cells among CD4+Foxp3+ Treg cells from MLN and SI-LPL of mice from panel (A). (G) Flow cytometric analysis and frequencies of Teff cytokines. Each symbol represents an independent sample. Numbers in flow plots indicate percentages. Error bars indicate SEM. Statistical tests: Two-way ANOVA (A, D, E); Student’s t-test (B to G). *P<0.05, **P<0.01, ***P<0.001, ****P<0.0001. Data representative of two independent experiments. n=4–16 mice per group.
Fig. 5.
Fig. 5.. TGF-β1-deficient Treg cells fail to suppress mast cell degranulation.
(A, B) Flow cytometric analysis of LAMP1 staining (A), and quantification of percent LAMP1 MFI inhibition (B), from in vitro bone-marrow mast cell suppression assay with sorted MLN Treg cells from 8 weeks old Foxp3YFPcre (+/+), Foxp3YFPcreTgfb1Δ/+ (Δ/+) and Foxp3EGFPcreTgfb1Δ/Δ (Δ/Δ) mice, or mast cells were treated with recombinant TGFβ1 (5ng/ml). (C) Core body temperature drop following OVA challenge of OVA-SEB sensitized WT and Mcpt5creTgfbr2Δ/Δ mice. (D) Serum concentrations of total IgE, OVA-specific IgE, and MMCP-1. Each symbol represents an independent sample. Numbers in flow plots indicate percentages. Error bars indicate SEM. Statistical tests: One-way ANOVA with Dunnett’s post hoc analysis (B), Two-way ANOVA (C); Student’s t-test (D); *P<0.05, **P<0.01, ***P<0.001, ****P<0.0001. Data representative of two independent experiments. n=6–12 replicates per group (A, B), and 5–8 mice per group (C, D).
Fig. 6.
Fig. 6.. Biallelic Treg cell Tgfb1 deficiency precipitates fatal autoimmunity.
(A) Appearance of Foxp3YFPcre, Foxp3YFPcreTgfb1Δ/+, and Foxp3YFPcreTgfb1Δ/Δ littermate mice. (B) Body weights at 19 d of age. (C) Survival curves of the respective mouse strains. (D) Histological pictures of skin, lung and liver tissues stained with hematoxylin and eosin (original magnification; ×200). (E) Serum immunoglobulin concentrations. (F) Flow cytometric analysis and cell frequencies of IL-4 and IFNγ expression in splenic Treg and Teff cells. (G) Flow cytometric analysis of CD62 and CD44 staining on splenic CD4+ T cells (left), and cell frequencies of CD62lowCD44high Teff cells. (H) Flow cytometric analysis and cell frequencies of CD4+Foxp3+ Treg cells. (I) Flow cytometric analysis and MFI of Foxp3 and PD-1 expression in splenic Treg cells. Each symbol represents an independent sample. The age of the mice in A and C to H were between 3 to 4 weeks age. Numbers in flow plots indicate percentages. Error bars indicate SEM. Statistical tests: log-rank test (A), Student’s t-test (C, F-J), and One-way ANOVA with Dunnett’s post hoc analysis (D). *P<0.05, **P<0.01, ***P<0.001, ****P<0.0001. Data representative of two to three independent experiments with 4–16 mice per group. Please also see Figure S2–S6.
Fig. 7.
Fig. 7.. Treg cell Tgfb1 gene dose-dependent regulation of autoimmune humoral responses.
(A) Flow cytometric analysis and frequencies of CXCR5 and PD-1 expression in splenic Teff and Treg cells. (B) Flow cytometric analysis and frequencies of germinal center B cells (B220+GL-7+) within the splenic B cell population. (C) Frequencies of CD80 and CD86 expressing cells within CD11c+MHCII+ splenic dendritic cell population. (D) Flow cytometric analysis and MFI of MHCII, CD80 and CD86 expression within the CD11c+MHCII+ splenic dendritic cell population. (E) Heat map representation of serum IgG autoantibodies in littermate mice of the respective genotypes. (F) Survival curves of Foxp3YFPcreTgfb1Δ/Δ mice treated with isotype control or anti-CD20 mAb. The age of the mice in panels A- F were between 3 to 4 weeks of age. Each symbol or column number represents an independent sample. Numbers in flow plots indicate percentages. Error bars indicate SEM. Statistical tests: One-way ANOVA with Dunnett’s post hoc analysis (A-D), R package ‘limma’ and multiple comparisons corrections adjusted to p<0.05 (E), and log-rank test (F). *P<0.05, **P<0.01, ****P<0.0001. Data representative of two to three independent experiments with 4–8 mice per group. Please also see Figure S7.

Comment in

References

    1. Abdel-Gadir A, Schneider L, Casini A, Charbonnier LM, Little SV, Harrington T, Umetsu DT, Rachid R, and Chatila TA (2018). Oral immunotherapy with omalizumab reverses the Th2 cell-like programme of regulatory T cells and restores their function. Clin Exp Allergy 48, 825–836. - PMC - PubMed
    1. Abdel-Gadir A, Stephen-Victor E, Gerber GK, Noval Rivas M, Wang S, Harb H, Wang L, Li N, Crestani E, Spielman S, et al. (2019). Microbiota therapy acts via a regulatory T cell MyD88/RORgammat pathway to suppress food allergy. Nat Med 25, 1164–1174. - PMC - PubMed
    1. Al Nabhani Z, Dulauroy S, Marques R, Cousu C, Al Bounny S, Dejardin F, Sparwasser T, Berard M, Cerf-Bensussan N, and Eberl G (2019). A Weaning Reaction to Microbiota Is Required for Resistance to Immunopathologies in the Adult. Immunity 50, 1276–1288 e1275. - PubMed
    1. Apostolou I, and von Boehmer H (2004). In vivo instruction of suppressor commitment in naive T cells. J Exp Med 199, 1401–1408. - PMC - PubMed
    1. Azhar M, Yin M, Bommireddy R, Duffy JJ, Yang J, Pawlowski SA, Boivin GP, Engle SJ, Sanford LP, Grisham C, et al. (2009). Generation of mice with a conditional allele for transforming growth factor beta 1 gene. Genesis 47, 423–431. - PMC - PubMed

Publication types

MeSH terms

Substances