

Integrated Proteomic and Glycoproteomic Characterization of Human High-Grade Serous Ovarian Carcinoma
- PMID: 33086064
- PMCID: PMC7970828
- DOI: 10.1016/j.celrep.2020.108276
Integrated Proteomic and Glycoproteomic Characterization of Human High-Grade Serous Ovarian Carcinoma
Abstract
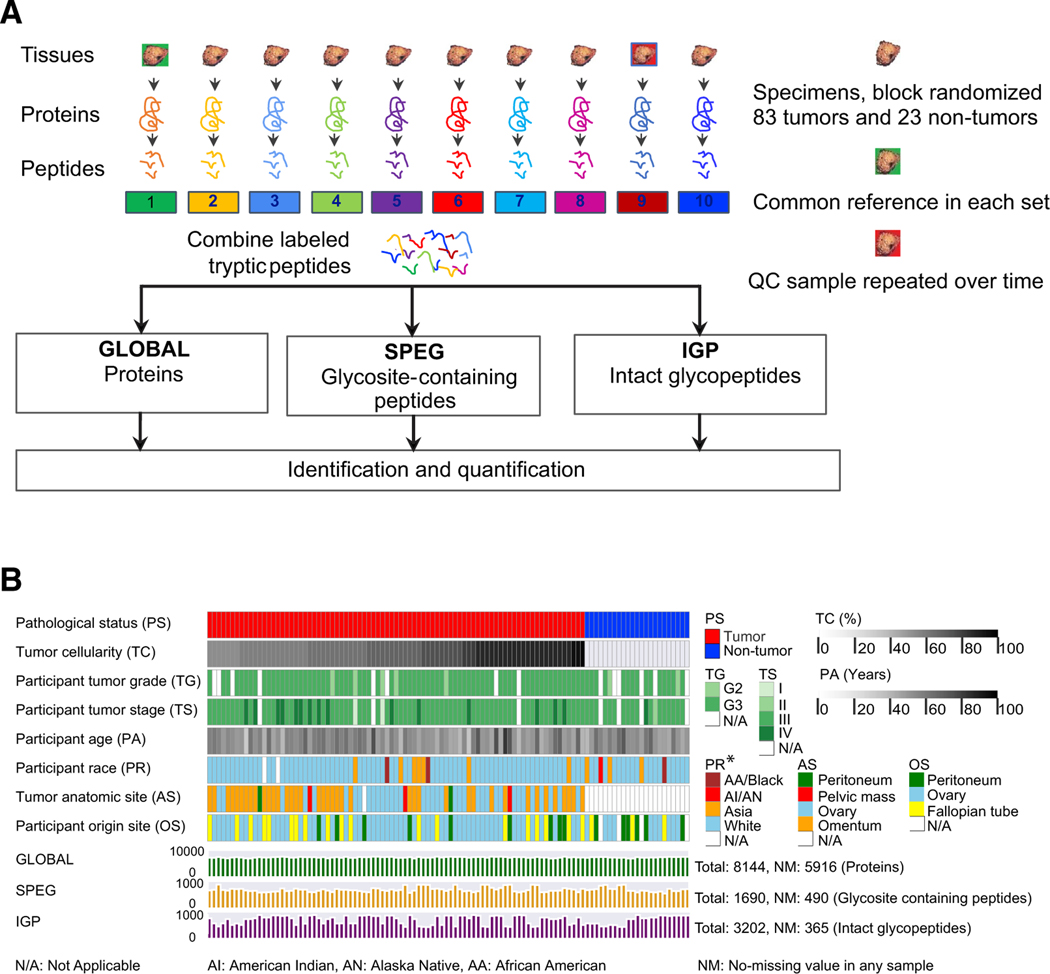
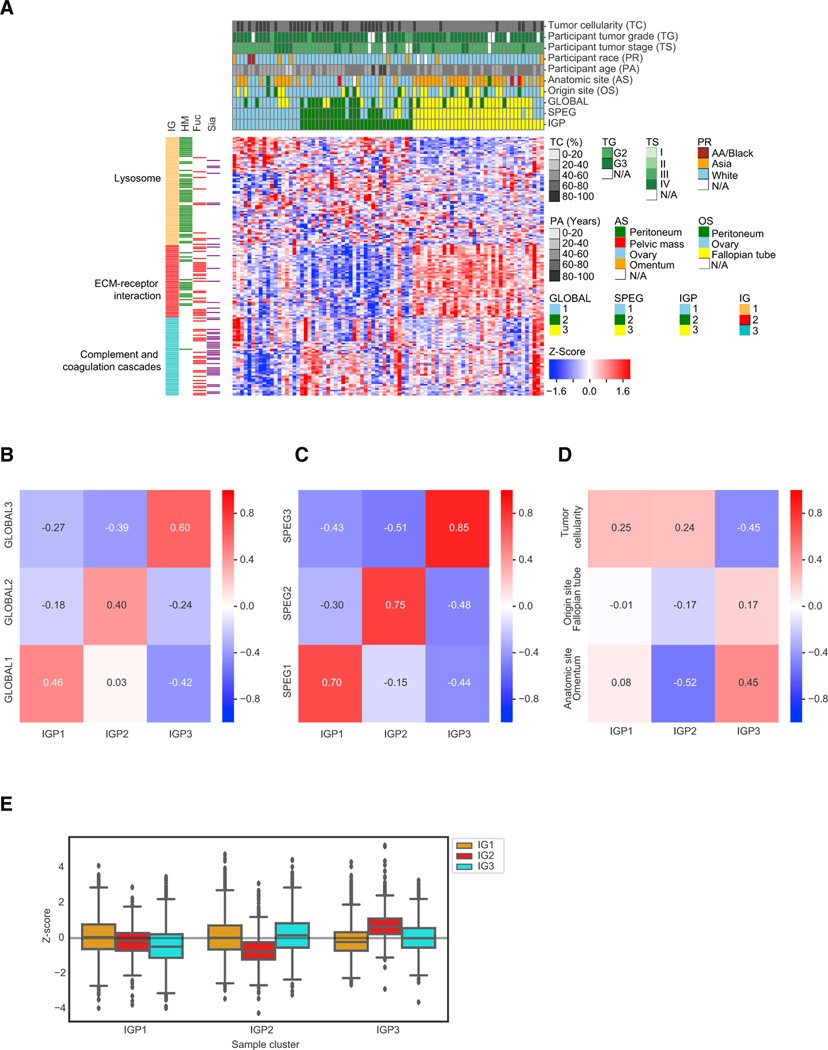
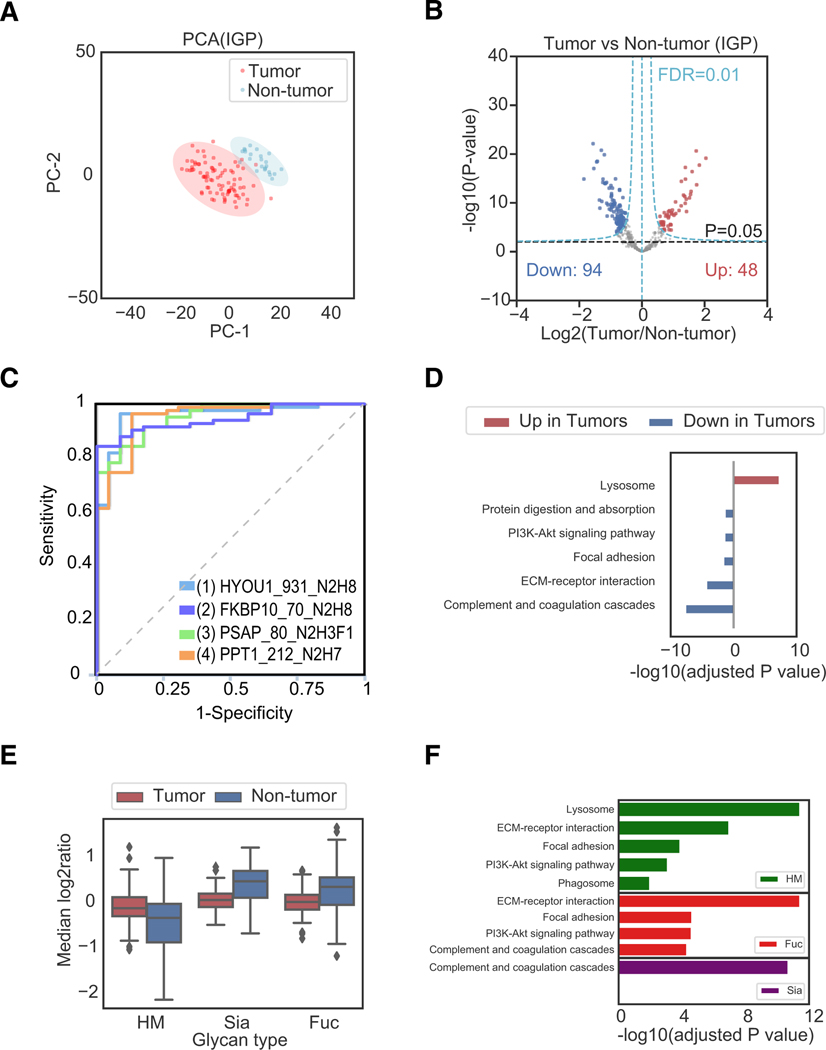
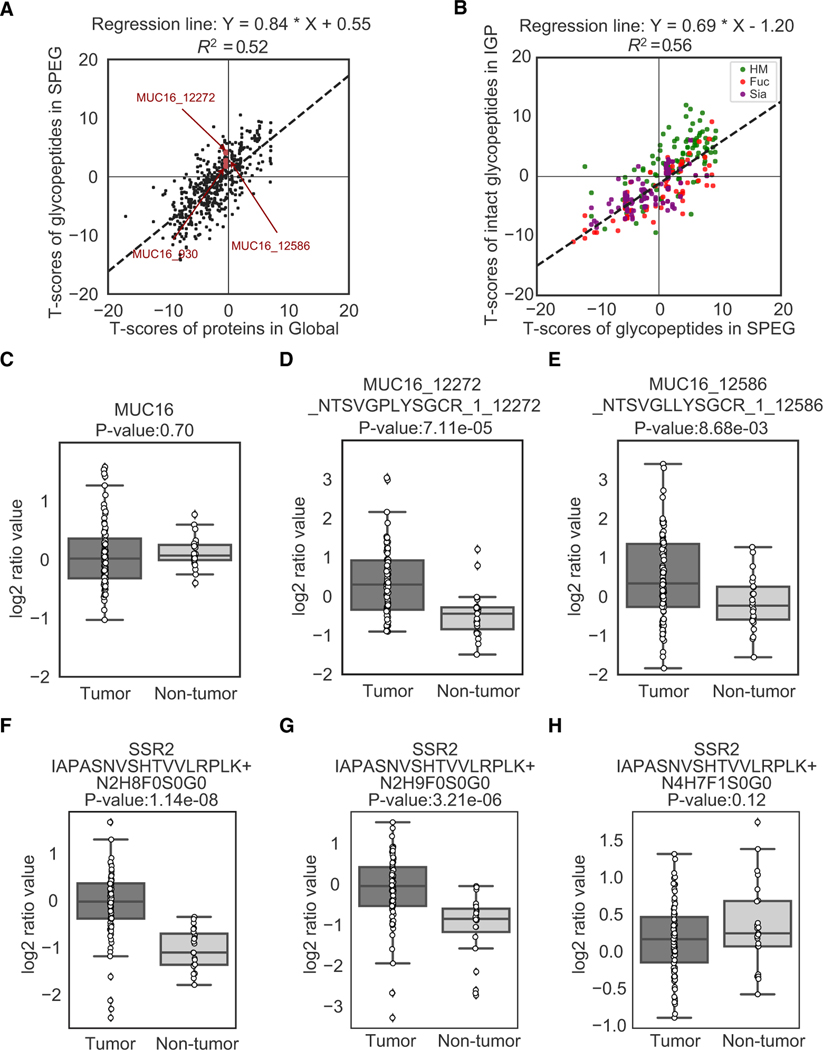
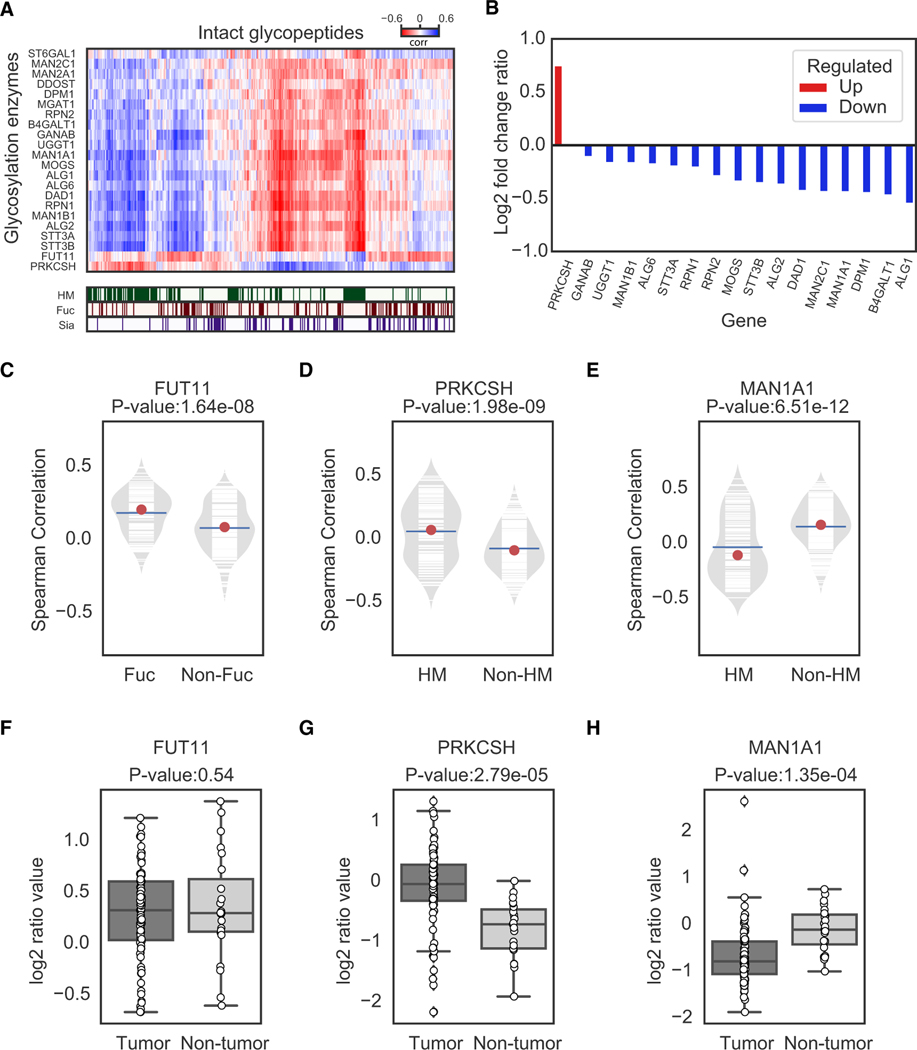
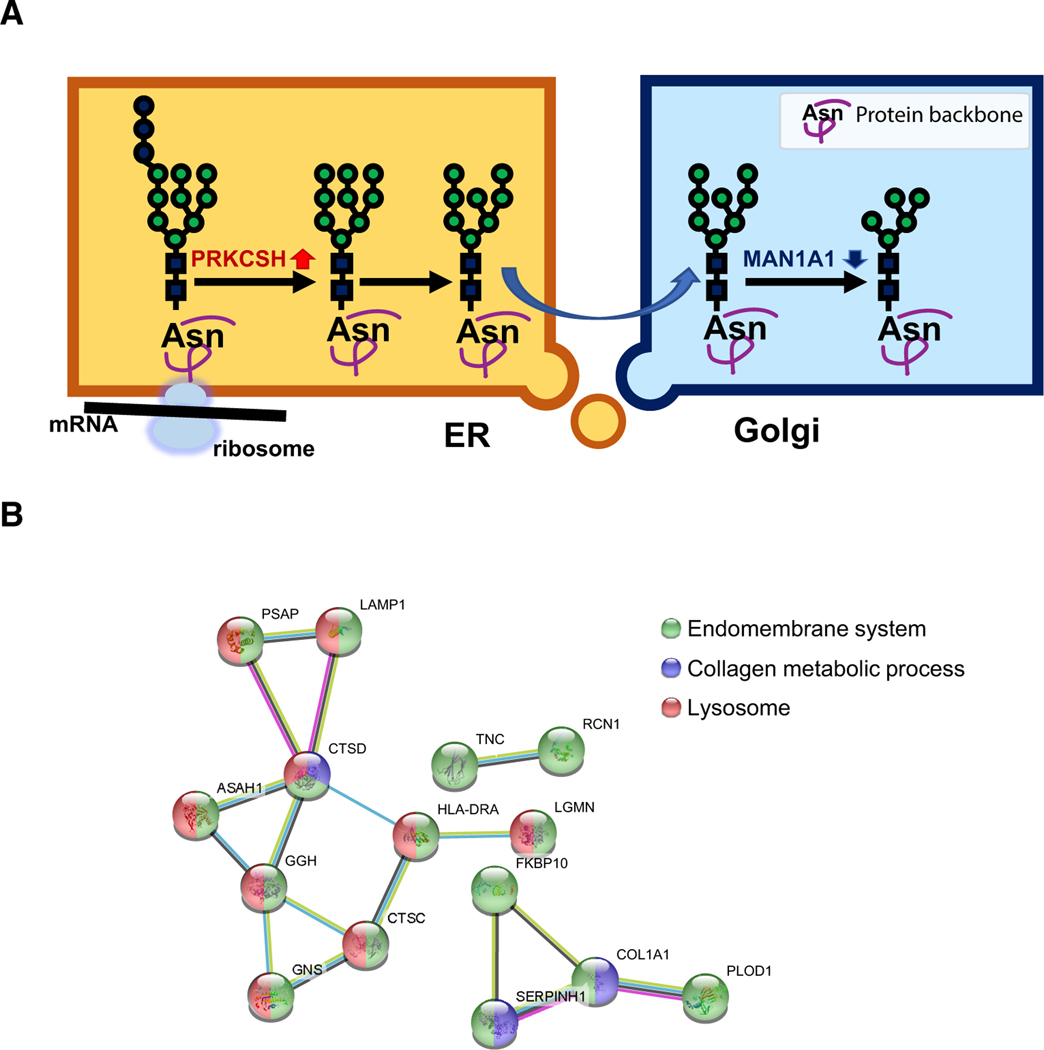
Many gene products exhibit great structural heterogeneity because of an array of modifications. These modifications are not directly encoded in the genomic template but often affect the functionality of proteins. Protein glycosylation plays a vital role in proper protein functions. However, the analysis of glycoproteins has been challenging compared with other protein modifications, such as phosphorylation. Here, we perform an integrated proteomic and glycoproteomic analysis of 83 prospectively collected high-grade serous ovarian carcinoma (HGSC) and 23 non-tumor tissues. Integration of the expression data from global proteomics and glycoproteomics reveals tumor-specific glycosylation, uncovers different glycosylation associated with three tumor clusters, and identifies glycosylation enzymes that were correlated with the altered glycosylation. In addition to providing a valuable resource, these results provide insights into the potential roles of glycosylation in the pathogenesis of HGSC, with the possibility of distinguishing pathological outcomes of ovarian tumors from non-tumors, as well as classifying tumor clusters.
Keywords: CPTAC; HGSC; glycoproteomics; glycosylation; high-grade serous ovarian carcinoma; mass spectrometry; proteomics; tumor clusters.
Copyright © 2020 The Authors. Published by Elsevier Inc. All rights reserved.
Conflict of interest statement
Declaration of Interests The authors declare no competing interests.
Figures
Similar articles
-
Proteomics of High-Grade Serous Ovarian Cancer Models Identifies Cancer-Associated Fibroblast Markers Associated with Clinical Outcomes.Biomolecules. 2022 Dec 30;13(1):75. doi: 10.3390/biom13010075. Biomolecules. 2022. PMID: 36671461 Free PMC article.
-
Glycoproteomics-based signatures for tumor subtyping and clinical outcome prediction of high-grade serous ovarian cancer.Nat Commun. 2020 Dec 1;11(1):6139. doi: 10.1038/s41467-020-19976-3. Nat Commun. 2020. PMID: 33262351 Free PMC article.
-
[Significance and expression of PAX8, PAX2, p53 and RAS in ovary and fallopian tubes to origin of ovarian high grade serous carcinoma].Zhonghua Fu Chan Ke Za Zhi. 2017 Oct 25;52(10):687-696. doi: 10.3760/cma.j.issn.0529-567X.2017.10.008. Zhonghua Fu Chan Ke Za Zhi. 2017. PMID: 29060967 Chinese.
-
Sequential molecular changes and dynamic oxidative stress in high-grade serous ovarian carcinogenesis.Free Radic Res. 2017 Oct;51(9-10):755-764. doi: 10.1080/10715762.2017.1383605. Epub 2017 Oct 11. Free Radic Res. 2017. PMID: 28931330 Review.
-
Ovarian low-grade serous carcinoma: a comprehensive update.Gynecol Oncol. 2012 Aug;126(2):279-85. doi: 10.1016/j.ygyno.2012.04.029. Epub 2012 Apr 30. Gynecol Oncol. 2012. PMID: 22555104 Review.
Cited by
-
Glycoproteomics Landscape of Asymptomatic and Symptomatic Human Alzheimer's Disease Brain.Mol Cell Proteomics. 2022 Dec;21(12):100433. doi: 10.1016/j.mcpro.2022.100433. Epub 2022 Oct 27. Mol Cell Proteomics. 2022. PMID: 36309312 Free PMC article.
-
High-throughput site-specific N-glycoproteomics reveals glyco-signatures for liver disease diagnosis.Natl Sci Rev. 2022 Apr 5;10(1):nwac059. doi: 10.1093/nsr/nwac059. eCollection 2023 Jan. Natl Sci Rev. 2022. PMID: 36879659 Free PMC article.
-
Proteogenomic characterization of 2002 human cancers reveals pan-cancer molecular subtypes and associated pathways.Nat Commun. 2022 May 13;13(1):2669. doi: 10.1038/s41467-022-30342-3. Nat Commun. 2022. PMID: 35562349 Free PMC article.
-
Multi-modal Profiling of the Extracellular Matrix of Human Fallopian Tubes and Serous Tubal Intraepithelial Carcinomas.J Histochem Cytochem. 2022 Feb;70(2):151-168. doi: 10.1369/00221554211061359. Epub 2021 Dec 5. J Histochem Cytochem. 2022. PMID: 34866441 Free PMC article.
-
Instrumentation at the Leading Edge of Proteomics.Anal Chem. 2024 May 21;96(20):7976-8010. doi: 10.1021/acs.analchem.3c04497. Epub 2024 May 13. Anal Chem. 2024. PMID: 38738990 Free PMC article. Review.
References
-
- Bast RC Jr., Klug TL, St John E, Jenison E, Niloff JM, Lazarus H, Berkowitz RS, Leavitt T, Griffiths CT, Parker L, et al. (1983). A radioimmuno-assay using a monoclonal antibody to monitor the course of epithelial ovarian cancer. N. Engl. J. Med 309, 883–887. - PubMed
-
- Bast RC Jr., Badgwell D, Lu Z, Marquez R, Rosen D, Liu J, Baggerly KA, Atkinson EN, Skates S, Zhang Z, et al. (2005). New tumor markers: CA125 and beyond. Int. J. Gynecol. Cancer 15 (Suppl 3), 274–281. - PubMed
Publication types
MeSH terms
Substances
Grants and funding
LinkOut - more resources
Full Text Sources
Other Literature Sources
Medical
Miscellaneous
